ConceptDraw Arrows10 Technology
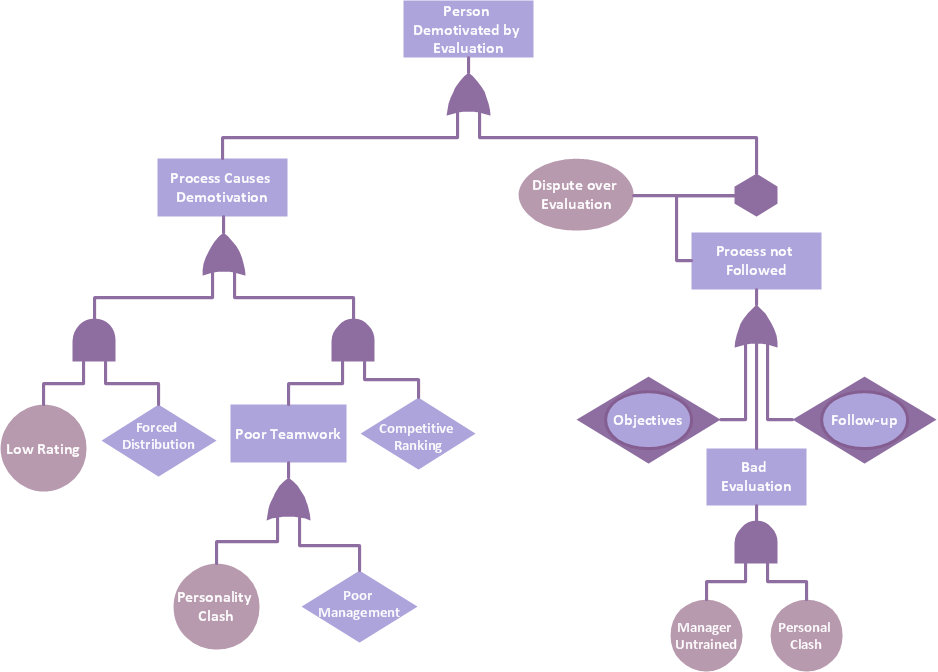
How should diagramming software work? The answer is - Fast and easy. "Tree"- mode drawing works like that. Just select objects in your drawing and press Tree or Chain button to connect all of them just in one click. Your diagram looks professional and it took only a moment to draw.Diagrama de Topologia
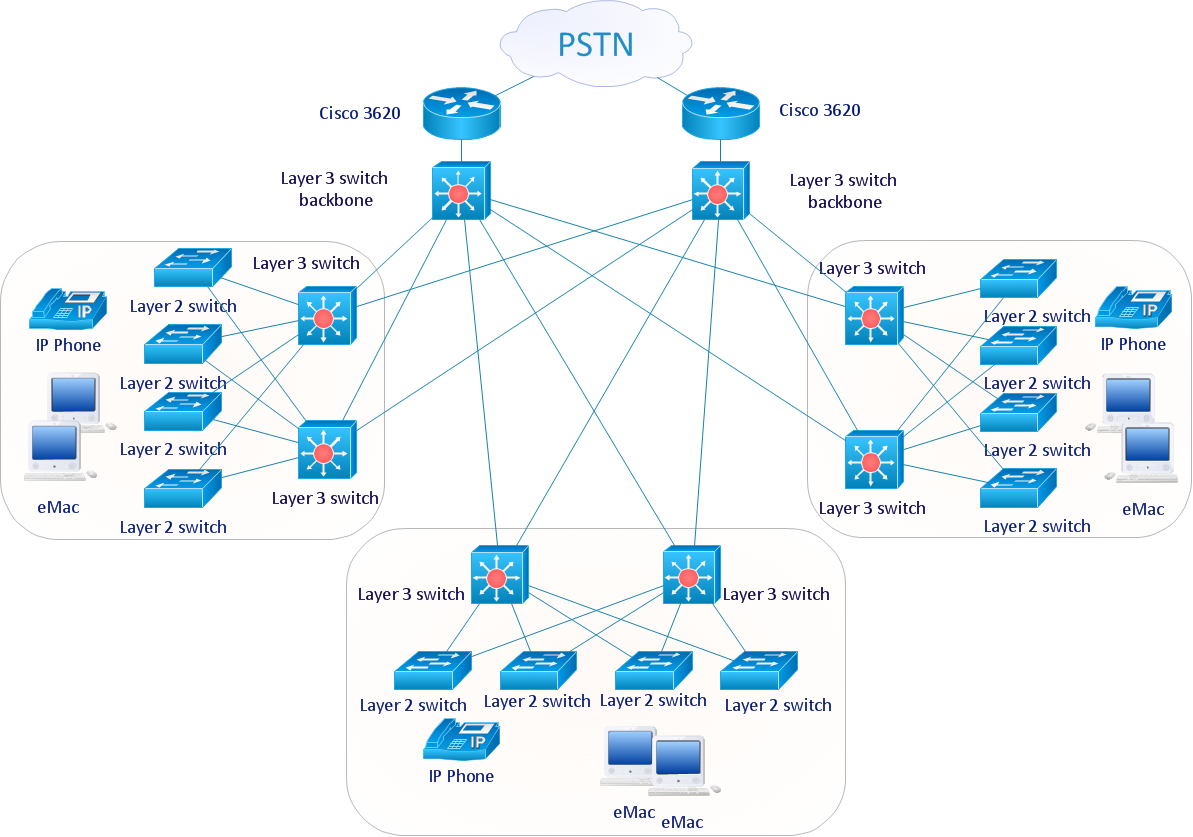
PRO is a powerful drawing tool that changes the way diagrams are produced. ConceptDraw Arrows10 Technology - This is more than enough versatility to draw any type of diagram with any degree of complexity. Diagrama de Topologia or Topology Diagram helps you see the big picture as you develop a service.Graphic Technologies
Graphics Technology looks at how to communicate graphically, develop ability to create graphical presentations for varied needs, understand standards and special conventions, develop specific techniques and build an understanding of the impact of graphical presentation on society. If you want to use effective methods for your work, you may need a tool which may let you represent your ideas and goals in graphic way.How To Make a Bubble Chart
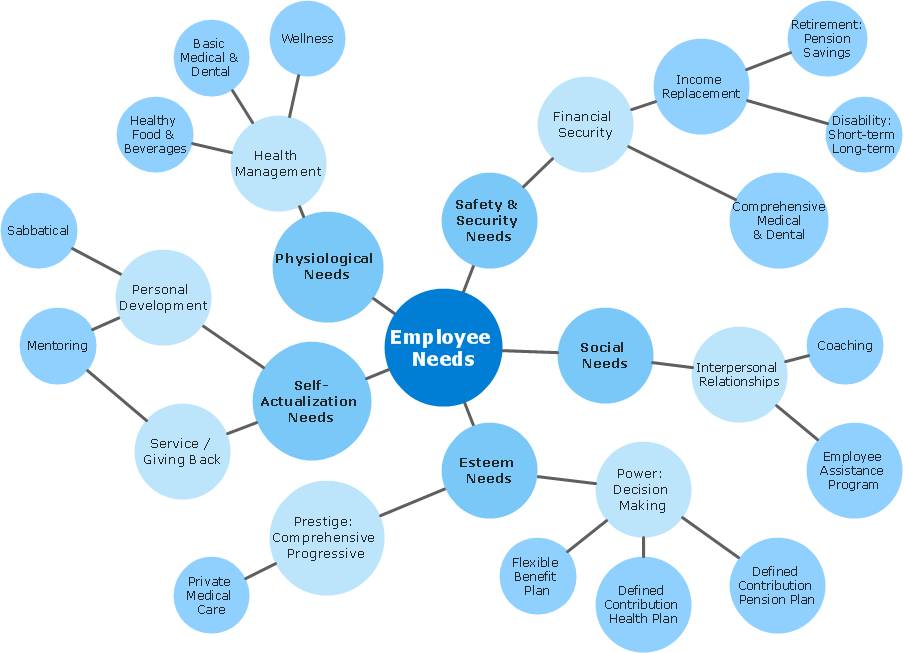
Bubble diagrams solution extends ConceptDraw DIAGRAM software with templates, Using ConceptDraw Connectors, you can make a bubble chart in moments. Using ConceptDraw you will be able to make a bubble chart from the ready ConceptDraw library objects or make your own objects. The created diagram can represent ideas organization, in brainstorming processes, by teachers for explaining difficult ideas or for presentations.ConceptDraw Arrows10 Technology
Auto-connection mode - This is more than enough versatility to draw any type of diagram with any degree of complexity. How should diagramming software work? Is it possible to develop a diagram as quickly as the ideas come to you? The innovative Auto-connection mode is what you need to start draw.HelpDesk
Flowchart Software Free Download
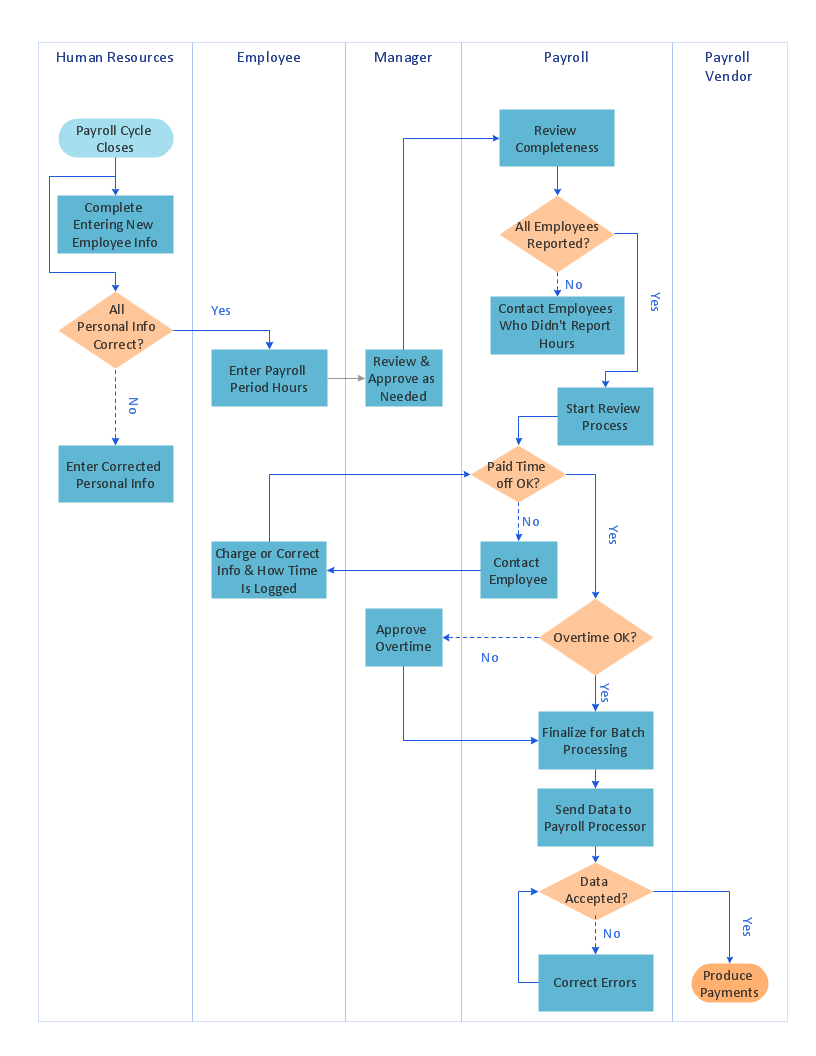
Making flowchart is an easiest way to depict any typical process. Any complex process, consisting from standard components can be displayed as a Flowchart. ConceptDraw DIAGRAM is proved to be a simple and easy tool for creating flowcharts. It does not require the skills of a professional designer. Making flowchart to map any process you will see the ways of its optimization and improvement. Flowchart software is here and you can download it for free.Create Organizational Chart
ConceptDraw DIAGRAM software is greatly powerful in many fields due to the large collection of provided solutions by ConceptDraw Solution Park, among them the cost effective Organizational Chart design capabilities. Organizational Charts Solution from the Management Area of ConceptDraw Solution Park perfectly suits for analyzing the organizational structures, visualizing and designing Organizational Charts for the companies of any sizes, for creation the hotel organizational chart, hospital organizational chart, corporate organizational chart, different flow charts, time lines, and much more. Organizational Charts Solution makes ConceptDraw DIAGRAM the perfect analyzer tool for managers and administrative staff. It offers plenty of useful and convenient tools for ConceptDraw DIAGRAM users, including the set of Organizational chart templates that make the process of creation Organizational Charts on their base easier and quicker, extensive Organizational chart library of tasks-specific symbols and shapes, helpful Organizational chart examples and samples.Wireless Network Mode
Wireless network mode engineers can schematically diagram with help of the ConceptDraw DIAGRAM best Network Diagramming software.Computers and Communications
Computers and communications solution extends ConceptDraw DIAGRAM software with illustration samples, templates and vector stencils libraries with clip art of computers, control devices, communications, technology, Apple machines.
HelpDesk
How to Create a Genogram
The Genogram solution for ConceptDraw DIAGRAM provides libraries of scalable vector objects and example drawings for all-types Genograms. The Genogram solution helps to create easily all types of genograms. The set of genogram standard symbols together with ConceptDraw DIAGRAM drawing tools make short work of visualization of sociological and medical information on family and kinship relations.HelpDesk
How to Create an Active Directory Diagram
Active Directory Service represents a distributed database that contains all the domain objects. The Active Directory domain environment is a single point of authentication and authorization of users and applications across the enterprise. The domain of the organization and deployment of Active Directory Service are exactly the cornerstones of the enterprise IT infrastructure. The logical diagrams of MS Windows Active Directory structure are used to visually support an enterprise IT infrastructure planning and management. ConceptDraw DIAGRAM allows you to make AD Diagrams quickly and easily using the set of special libraries.HelpDesk
How to Create a Health Informatics Diagram
The ability to create Health Informatics Workflow diagrams is provided with the ConceptDraw Health Informatics solution. It includes 33 vector graphics icons and 10 sample documents that can be used when representing the flow of data, documents, and tasks during the performance of a health management process.HelpDesk
How to Design Effective Medical Illustrations
The Medical Illustrations solution extends abilities of ConceptDraw DIAGRAM software with an incredibly large variety of ready-to-use vector objects and icons that help to design professional-looking, colorful and attractive Medical illustrations, Medical diagrams and infographics, slides for presentations in a field of medicine and healthcare.HelpDesk
How to Create Immunology Graphics
The Immunology solution for ConceptDraw DIAGRAM supports designing immunology-related infographics, diagrams, charts, and illustrations.HelpDesk
How To Make a Jackson Diagram
The example of Jackson structured programming (JSP) diagram was created in ConceptDraw DIAGRAM using the vector library delivered with JSP Diagrams Solution.HelpDesk
How to Add a Bubble Diagram to PowerPoint Presentation
Bubble diagrams can be used to compare concepts, and identify areas of similarity and difference. ConceptDraw DIAGRAM allows you to make a MS PowerPoint Presentation from your charts in a few simple steps.How to Draw an Organizational Chart
An Organizational chart is a type of diagram which visually displays the structure of an organization, relationships and relative ranks of the organization′s parts and positions. Organizational chart is constructed as an hierarchical structure, in the form of tree. How to Draw an Organization Chart the most easy and quickly? The Organizational Charts solution, innovative Tree Auto-connection mode and ConceptDraw Arrows10 Technology included in ConceptDraw DIAGRAM software are powerful drawing tools that change the way of diagrams production. Arrows10 Technology provides smart behavior for the connectors, and so quick and precise placement when drawing, and lets easy make the changes and automatic rearrangement. It helps to make the process of drawing diagrams more efficient, easier and faster. Now, you don′t need to think on how to connect or place the objects, you can concentrate fully on what to draw. See obligatory the helpful video tutorial about creation the Organization Charts and orgchart professional presentations with ConceptDraw products.How to Draw a Bubble Chart
Video tutorials on ConceptDraw products. Try it today!- ConceptDraw Arrows10 Technology | Mac Diagramming Software ...
- ConceptDraw Arrows10 Technology | Auto Connect Mode ...
- ConceptDraw Arrows10 Technology | Tree Diagram Software
- ConceptDraw Arrows10 Technology | Project —Task Trees and ...
- | Fault Tree Analysis Diagrams | Tree Diagram App
- Fault Tree Analysis Diagrams | Software Tree Diagram
- ConceptDraw Arrows10 Technology | Fault Tree Analysis Diagrams ...
- Cross-functional flowcharts - Vector stencils library | Cross-functional ...
- ConceptDraw Arrows10 Technology | Cross Functional Flowchart for ...
- Cross-functional flowcharts | Parallel Mode Flowchart