How can you illustrate the weather condition
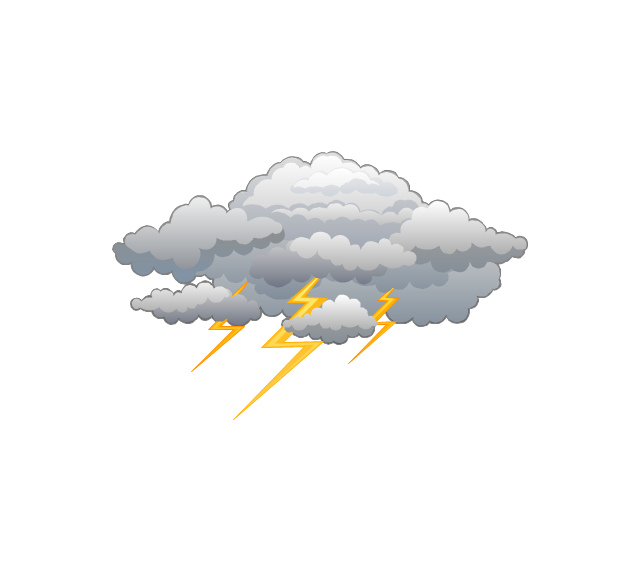
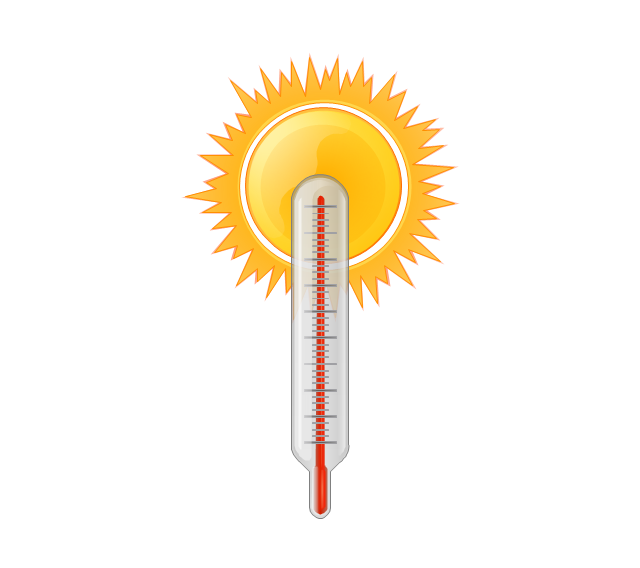
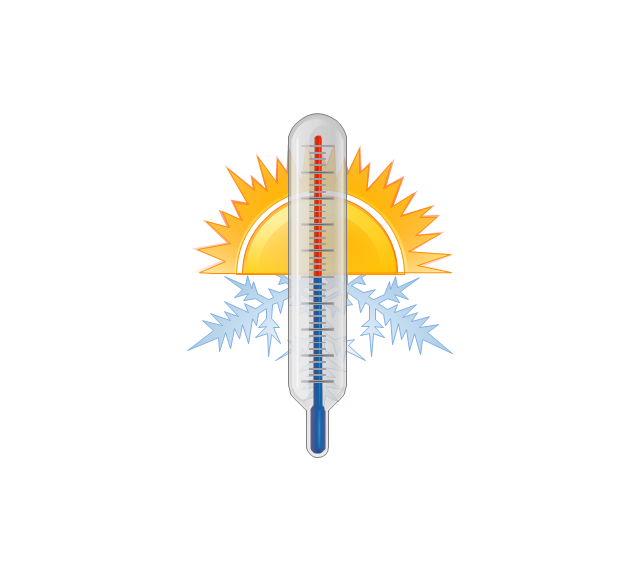
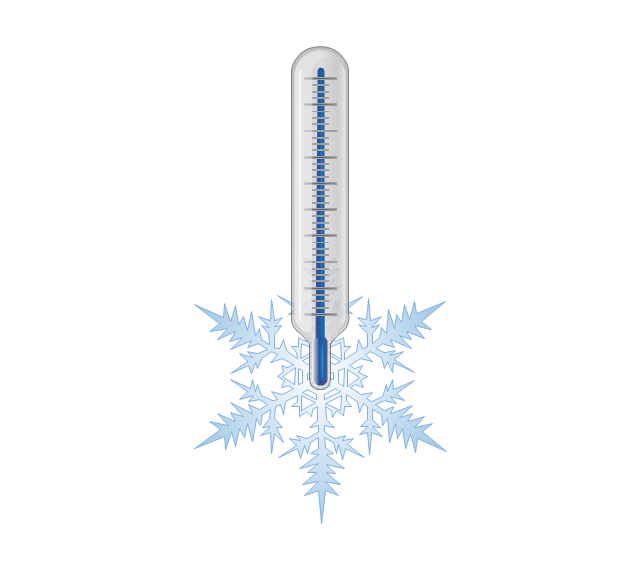
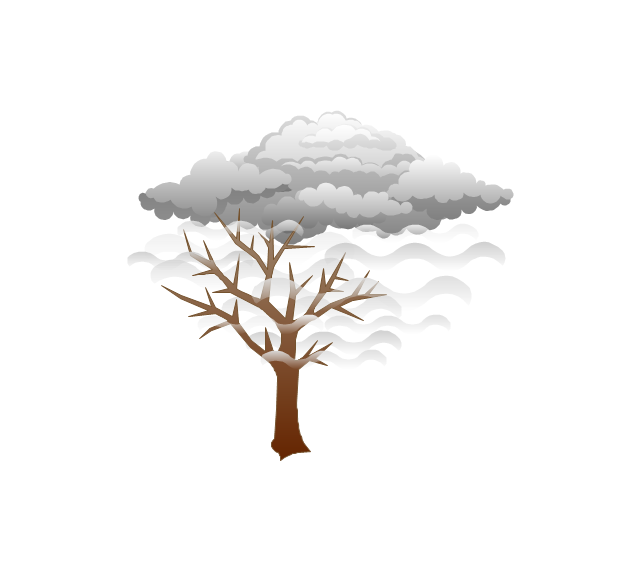
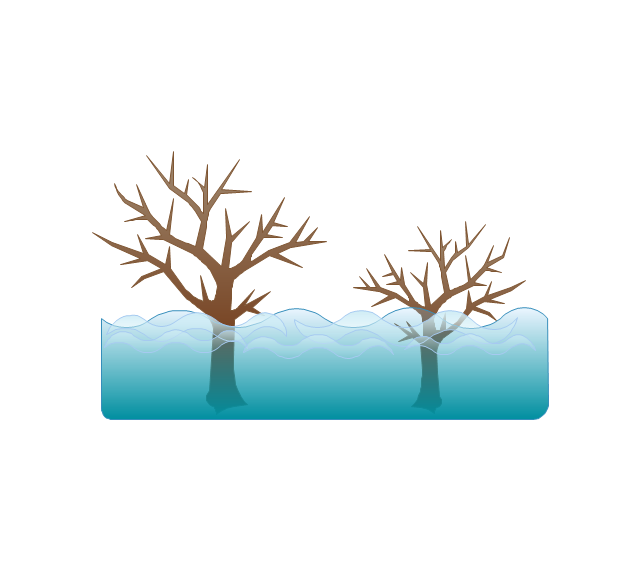
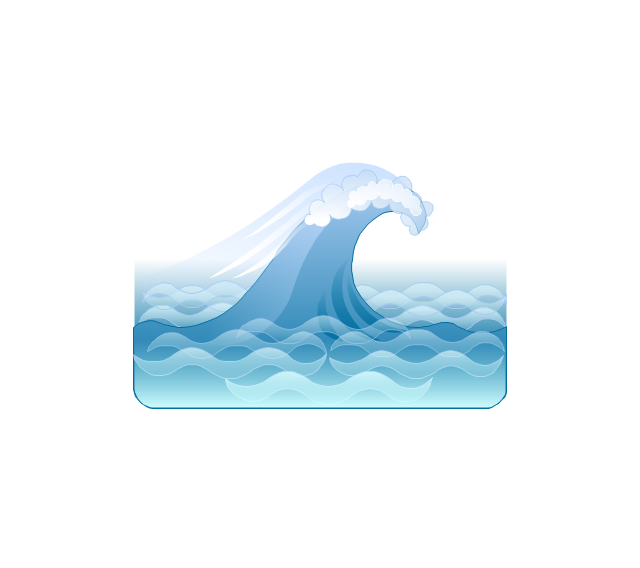
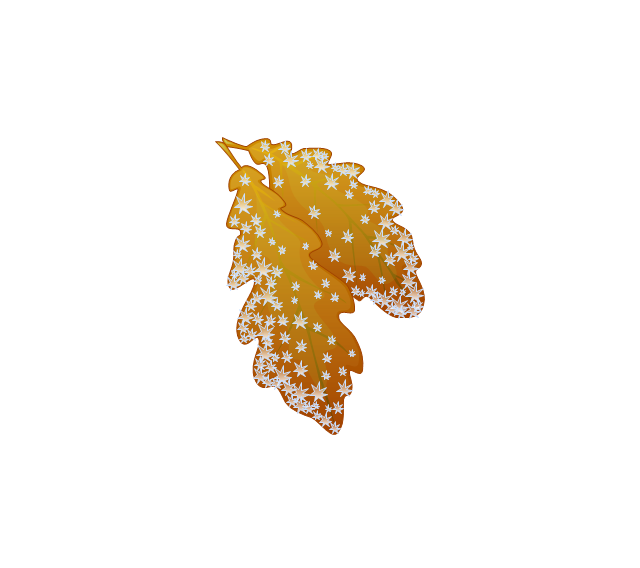
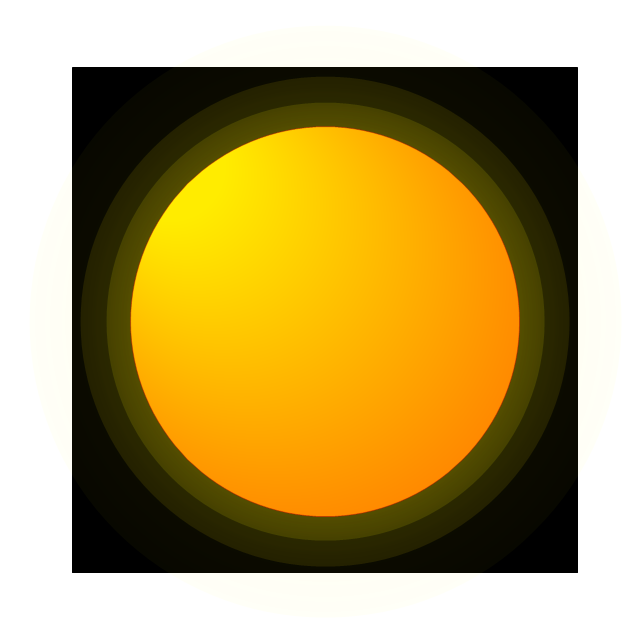
Use it to make professional looking documents, presentations, and websites illustrated with color scalable vector clipart for geography, weather, and animals.The vector stencils library Weather contains 17 symbols of meteorological conditions: sunny, cloudy, overcast, snow, rain, lighting, hot, warm, cold, mist, strong wind, flood, tsunami, dew, hoarfrost, earthquake, snowflake.
Use the design elements library Weather to draw illustrations, calendars, maps and infographics with weather phenomena clipart using the ConceptDraw PRO diagramming and vector graphics software.
"Weather is the state of the atmosphere, to the degree that it is hot or cold, wet or dry, calm or stormy, clear or cloudy. Most weather phenomena occur in the troposphere, just below the stratosphere. Weather generally refers to day-to-day temperature and precipitation activity, whereas climate is the term for the average atmospheric conditions over longer periods of time. When used without qualification, "weather" is understood to mean the weather of Earth." [Weather. Wikipedia]
This example of weather clipart is included in the Nature solution from the Illustration area of ConceptDraw Solution Park.
The vector stencils library "Weather" contains 17 weather clipart images for drawing illustrations on climate to show cloudiness, air temperature, precipitation, wind.
"Weather is the state of the atmosphere, to the degree that it is hot or cold, wet or dry, calm or stormy, clear or cloudy. Most weather phenomena occur in the troposphere, just below the stratosphere. Weather generally refers to day-to-day temperature and precipitation activity, whereas climate is the term for the average atmospheric conditions over longer periods of time. When used without qualification, "weather", is generally understood to mean the weather of Earth.
Weather is driven by air pressure (temperature and moisture) differences between one place and another. These pressure and temperature differences can occur due to the sun angle at any particular spot, which varies by latitude from the tropics. The strong temperature contrast between polar and tropical air gives rise to the jet stream. Weather systems in the mid-latitudes, such as extratropical cyclones, are caused by instabilities of the jet stream flow. Because the Earth's axis is tilted relative to its orbital plane, sunlight is incident at different angles at different times of the year. On Earth's surface, temperatures usually range ±40°C (−40°F to 100°F) annually. Over thousands of years, changes in Earth's orbit affect the amount and distribution of solar energy received by the Earth and influence long-term climate and global climate change." [Weather. Wikipedia]
The clip art example "Weather - Vector stencils library" was created using the ConceptDraw PRO diagramming and vector drawing software extended with the Nature solution from the Illustration area of ConceptDraw Solution Park.
www.conceptdraw.com/ solution-park/ illustrations-nature
This work flow chart sample was redesigned from the picture "Weather Forecast" from the article "Simulation Workflows".
[iaas.uni-stuttgart.de/ forschung/ projects/ simtech/ sim-workflows.php]
"(1) The weather is predicted for a particular geological area. Hence, the workflow is fed with a model of the geophysical environment of ground, air and water for a requested area.
(2) Over a specified period of time (e.g. 6 hours) several different variables are measured and observed. Ground stations, ships, airplanes, weather balloons, satellites and buoys measure the air pressure, air/ water temperature, wind velocity, air humidity, vertical temperature profiles, cloud velocity, rain fall, and more.
(3) This data needs to be collected from the different sources and stored for later access.
(4) The collected data is analyzed and transformed into a common format (e.g. Fahrenheit to Celsius scale). The normalized values are used to create the current state of the atmosphere.
(5) Then, a numerical weather forecast is made based on mathematical-physical models (e.g. GFS - Global Forecast System, UKMO - United Kingdom MOdel, GME - global model of Deutscher Wetterdienst). The environmental area needs to be discretized beforehand using grid cells. The physical parameters measured in Step 2 are exposed in 3D space as timely function. This leads to a system of partial differential equations reflecting the physical relations that is solved numerically.
(6) The results of the numerical models are complemented with a statistical interpretation (e.g. with MOS - Model-Output-Statistics). That means the forecast result of the numerical models is compared to statistical weather data. Known forecast failures are corrected.
(7) The numerical post-processing is done with DMO (Direct Model Output): the numerical results are interpolated for specific geological locations.
(8) Additionally, a statistical post-processing step removes failures of measuring devices (e.g. using KALMAN filters).
(9) The statistical interpretation and the numerical results are then observed and interpreted by meteorologists based on their subjective experiences.
(10) Finally, the weather forecast is visualized and presented to interested people." [iaas.uni-stuttgart.de/ forschung/ projects/ simtech/ sim-workflows.php]
The example "Workflow diagram - Weather forecast" was drawn using the ConceptDraw PRO diagramming and vector drawing software extended with the Workflow Diagrams solution from the Business Processes area of ConceptDraw Solution Park.
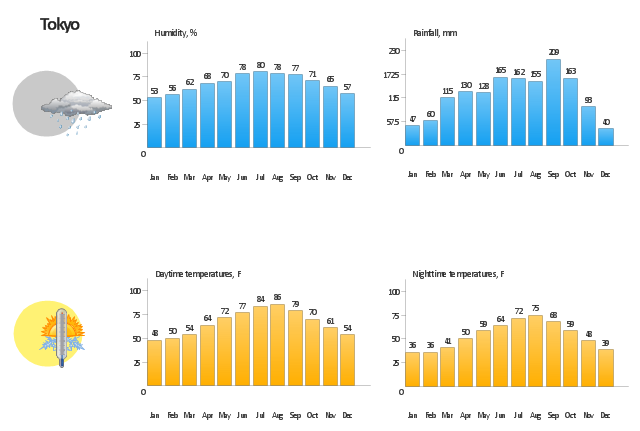
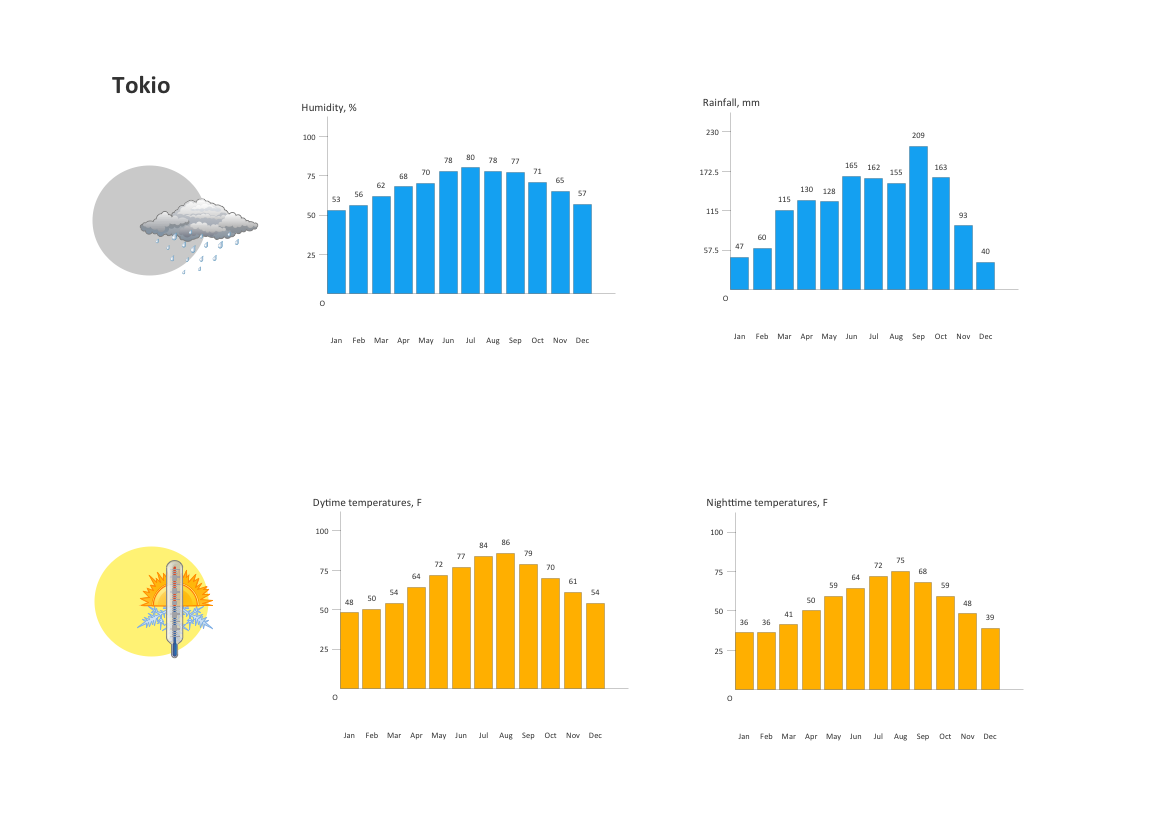
This weather conditions dashboard example depicting climate in Tokyo was drawn using the ConceptDraw PRO diagramming and vector graphics software extended with the clipart library Weather.
"Meteorology is the interdisciplinary scientific study of the atmosphere. ...
Meteorological phenomena are observable weather events which illuminate, and are explained by the science of meteorology. Those events are bound by the variables that exist in Earth's atmosphere; temperature, air pressure, water vapor, and the gradients and interactions of each variable, and how they change in time. Different spatial scales are studied to determine how systems on local, regional, and global levels impact weather and climatology." [Meteorology. Wikipedia]
This weather conditions dashboard example is included in the Nature solution from the Illustration area of ConceptDraw Solution Park.
The vector stencils library Weather contains 17 symbols of meteorological conditions: sunny, cloudy, overcast, snow, rain, lighting, hot, warm, cold, mist, strong wind, flood, tsunami, dew, hoarfrost, earthquake, snowflake.
Use the design elements library Weather to draw illustrations, calendars, maps and infographics with weather phenomena clipart using the ConceptDraw PRO diagramming and vector graphics software.
"Weather is the state of the atmosphere, to the degree that it is hot or cold, wet or dry, calm or stormy, clear or cloudy. Most weather phenomena occur in the troposphere, just below the stratosphere. Weather generally refers to day-to-day temperature and precipitation activity, whereas climate is the term for the average atmospheric conditions over longer periods of time. When used without qualification, "weather" is understood to mean the weather of Earth." [Weather. Wikipedia]
This example of weather clipart is included in the Nature solution from the Illustration area of ConceptDraw Solution Park.
The vector stencils library "App icons" contains 24 icons of iOS 8 / iPhone 6 software applications.
Use it to design iOS 8 apps GUI prototypes and iPhone 6 software applications user interface sketches and mockups.
The icons example "App icons - Vector stencils library" was created using the ConceptDraw PRO diagramming and vector drawing software extended with the iPhone User Interface solution from the Software Development area of ConceptDraw Solution Park.
The vector stencils library "Windows 8 apps" contains 40 shortcut icons of Windows 8 software applications.
Use this shortcut UI icon set to design graphic user interface (GUI) prototypes of your software apps for Windows 8.
"In computing, a file shortcut is a handle in a user interface that allows the user to find a file or resource located in a different directory or folder from the place where the shortcut is located.
Shortcuts are typically implemented as a small file containing a target URI or GUID to an object, or the name of a target program file that the shortcut represents. The shortcut might additionally specify parameters to be passed to the target program when it is run. Each shortcut can have its own icon. Shortcuts are very commonly placed on a desktop, in an application launcher panel such as the Microsoft Windows Start menu, or in the main menu of a desktop environment. ...
File shortcuts (also known as shell links) were introduced in Windows 95. Microsoft Windows uses .lnk as the filename extension for shortcuts to local files, and .URL for shortcuts to remote files, like web pages. Commonly referred to as "shortcuts" or "link files", both are displayed with a curled arrow overlay icon by default, and no filename extension. ...
Shortcut files can be used to launch programs in minimized or maximized window states if the program supports it. ...
Beginning with Windows 7, some shortcuts also store Application User Model IDs (AppUserModelIDs). Instead of the target command line, AppUserModelIDs may directly be used to launch applications. Shortcuts with AppUserModelIDs are used by some desktop programs and all WinRT Modern apps for launching." [File shortcut. Wikipedia]
The shortcut icons example "Windows 8 apps - Vector stencils library" was created using the ConceptDraw PRO diagramming and vector drawing software extended with the Windows 8 User Interface solution from the Software Development area of ConceptDraw Solution Park.
Nature Clipart and Illustrations
ConceptDraw DIAGRAM is a vector design software, it includes numerous vector stencils. Weather vector clipart library for ConceptDraw DIAGRAM allows the user to produce professional-looking illustrations in seconds.
 Nature
This solution extends ConceptDraw DIAGRAM software with samples, templates and libraries of vector clipart for drawing the Nature illustrations. Use it to make professional-looking documents, presentations and websites illustrated with color scalable vector c
The vector stencils library "Apps icons" contains 24 icons of iOS 8 / iPhone 6 applications: Messages, Calendar, Photos, Camera, Weather, Clock, Maps, Videos, Notes, Reminders, Stocks, Game Center, Newsstand, iTunes Store, App Store, iBooks, Health, Passbook, Settings, Phone, Mail, Music, Safari.
Use it to design iOS 8 apps GUI prototypes and iPhone 6 applications user interface sketches and mockups.
"iOS 8 is the eighth major release of the iOS mobile operating system designed by Apple Inc. as the successor to iOS 7. It was announced at the company's Worldwide Developers Conference (WWDC) 2014 on June 2, 2014 and will be released on September 17, 2014.
A new app named Health and a corresponding framework named HealthKit will be available. Siri will support hands-free activation and music identification using Shazam. Voice and video messages will be automatically deleted unless the user saves them for future reference. Interactive notifications will let the user respond to texts without leaving the app they are currently using." [iOS 8. Wikipedia]
The example "Design elements - Apps icons" was created using the ConceptDraw PRO diagramming and vector drawing software extended with the iPhone User Interface solution from the Software Development area of ConceptDraw Solution Park.
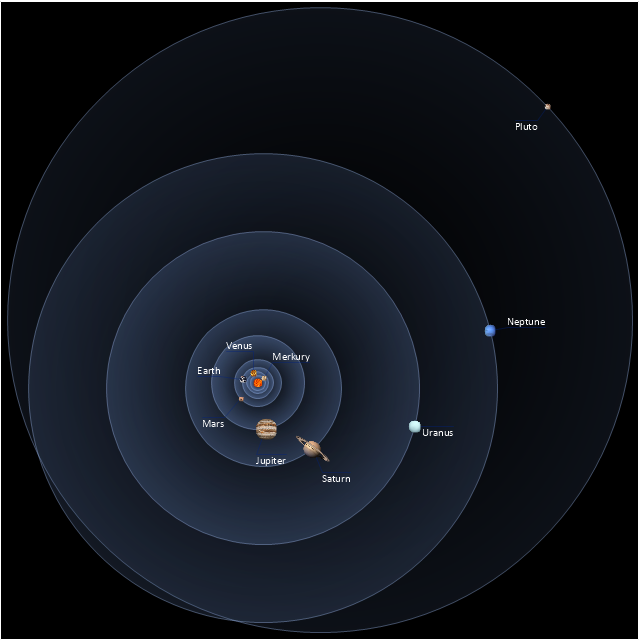
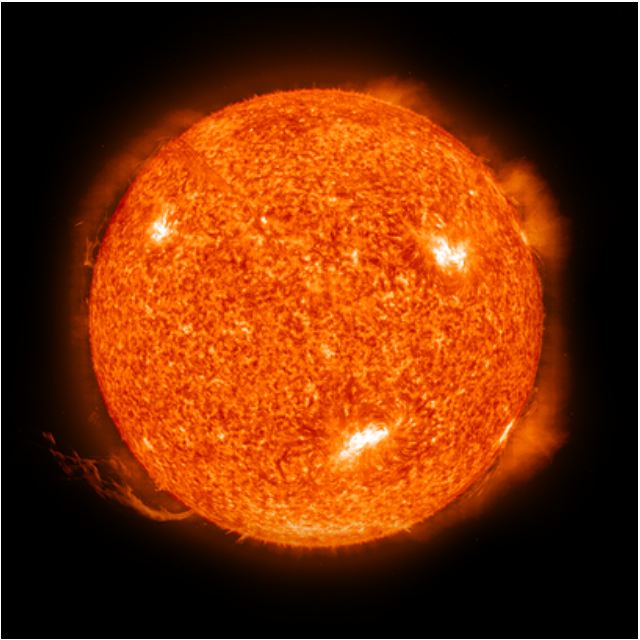
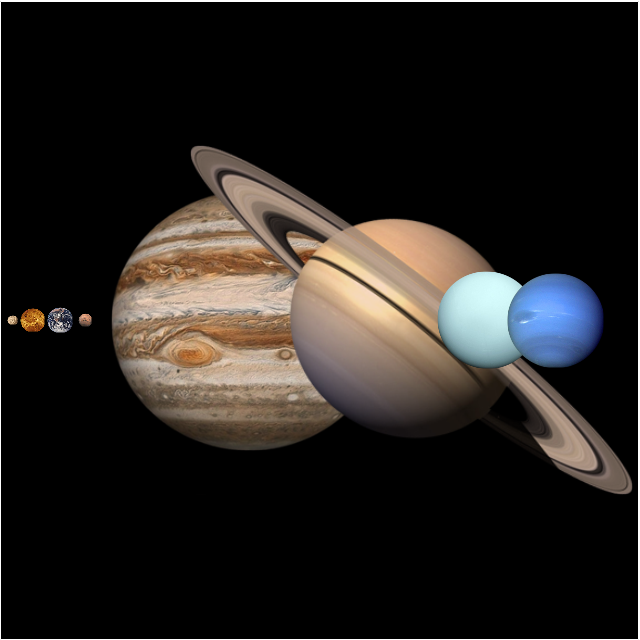
This vector stencils library contains 30 clipart images and astronomical symbols of sun and stars, solar system planets and moon.
Use these shapes for drawing your astronomical diagrams and illustrations.
Use these shapes for drawing your astronomical diagrams and illustrations.
The vector stencils library "App icons" contains 24 icons of iOS 8 / iPhone 6 software applications.
Use it to design iOS 8 apps GUI prototypes and iPhone 6 software applications user interface sketches and mockups.
The icons example "App icons - Vector stencils library" was created using the ConceptDraw PRO diagramming and vector drawing software extended with the iPhone User Interface solution from the Software Development area of ConceptDraw Solution Park.
Use it to design iOS 8 apps GUI prototypes and iPhone 6 software applications user interface sketches and mockups.
The icons example "App icons - Vector stencils library" was created using the ConceptDraw PRO diagramming and vector drawing software extended with the iPhone User Interface solution from the Software Development area of ConceptDraw Solution Park.
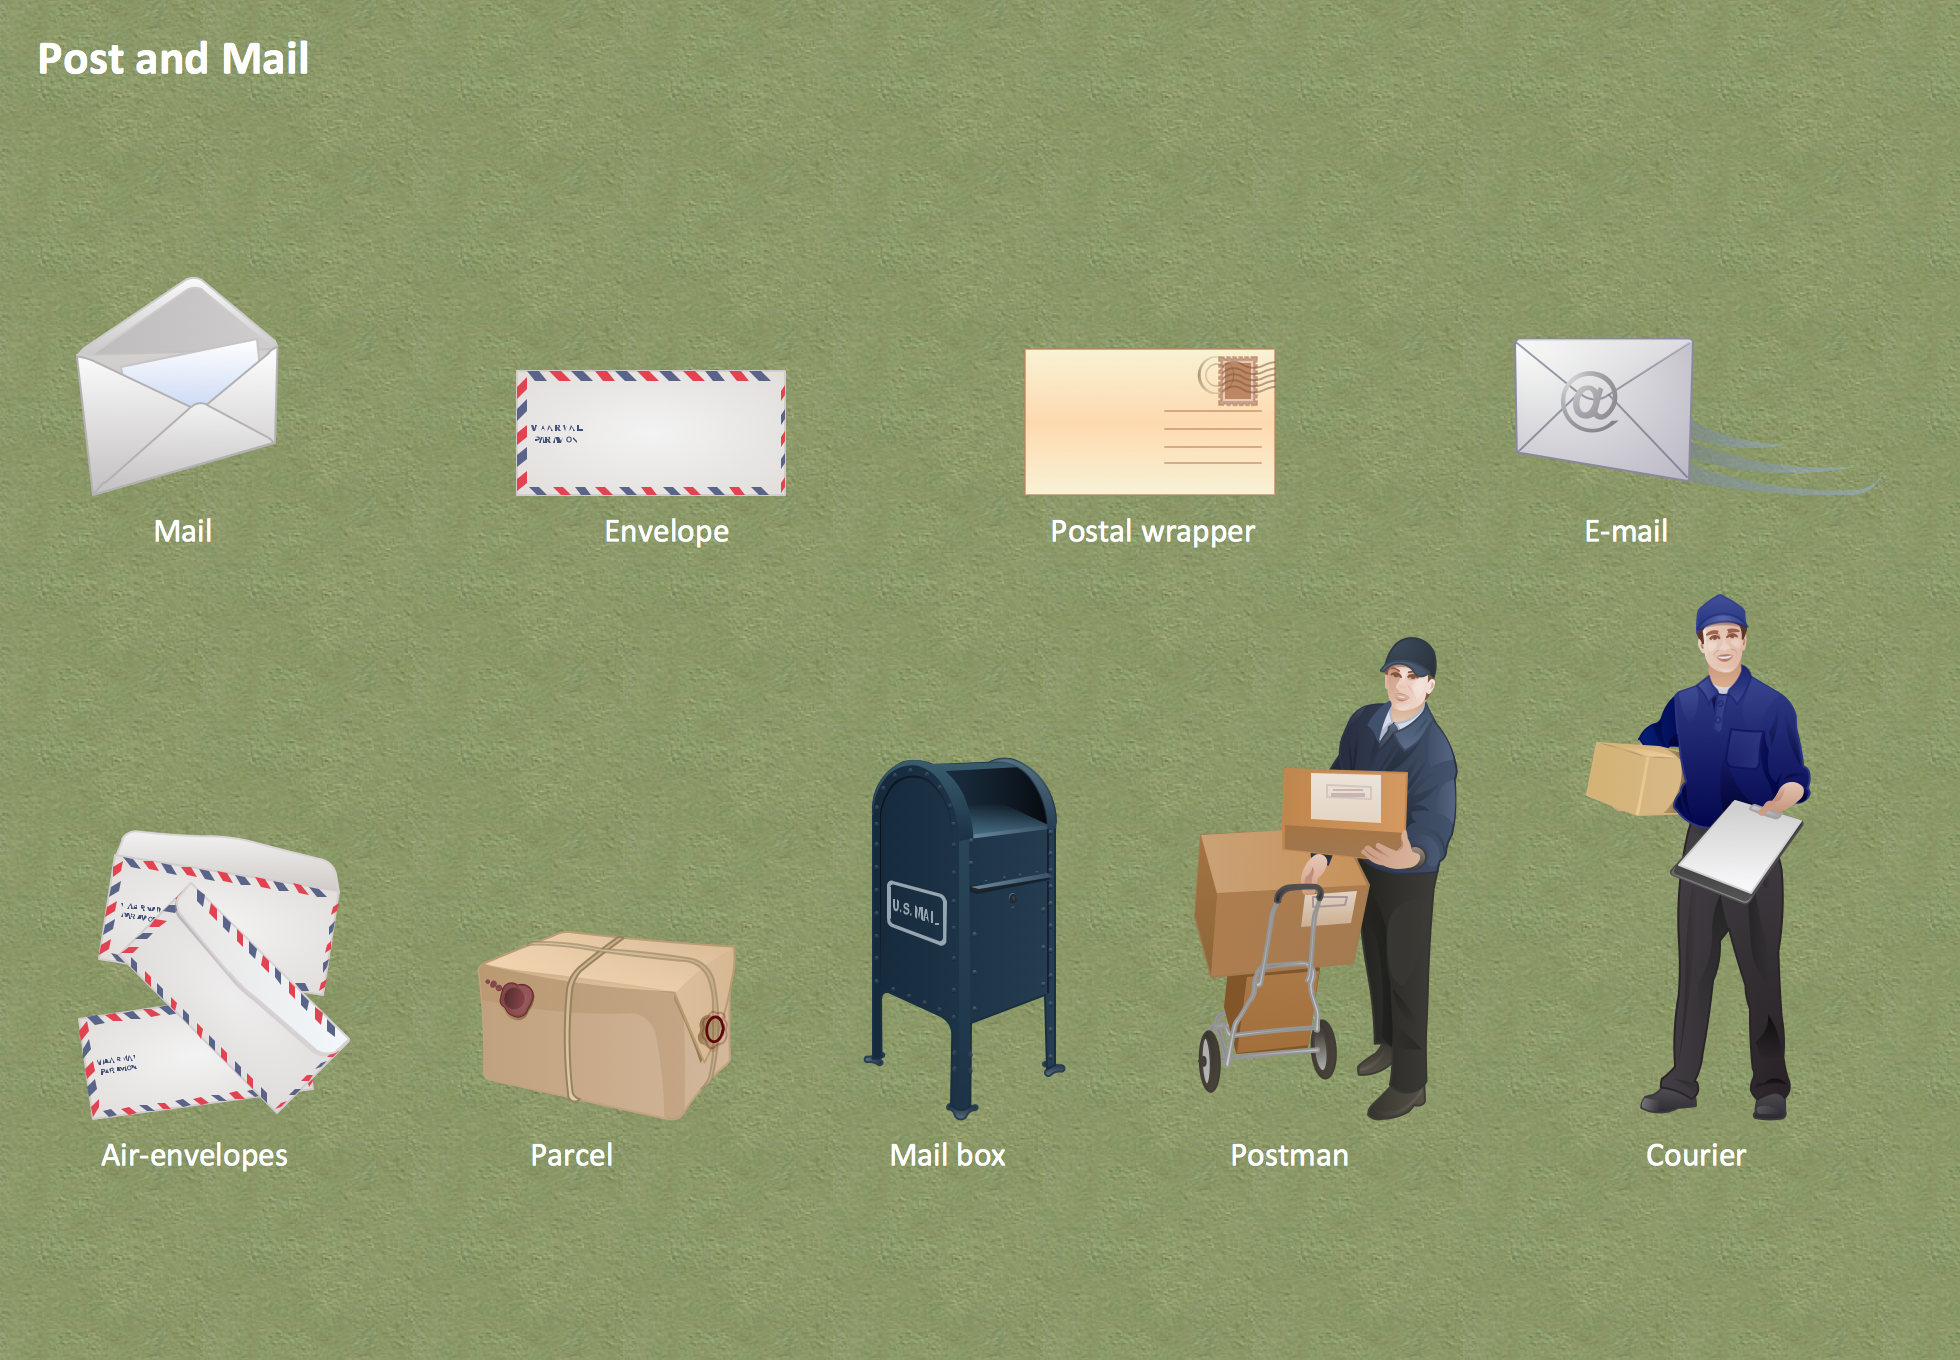
Post and Mail - Design Elements
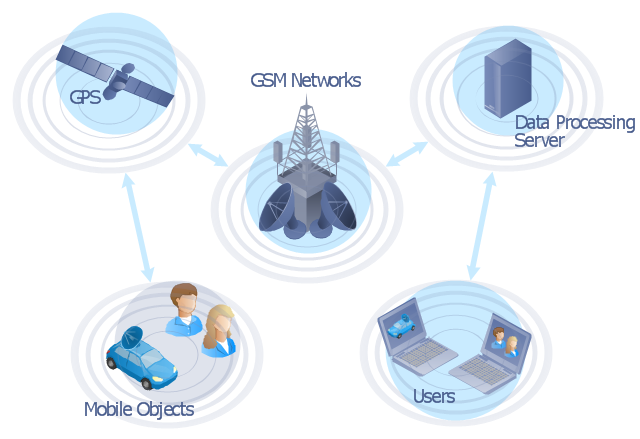
Deliver your message with ConceptDraw Post Mail Design Elements. Samples, templates and libraries contain vector clip art for drawing the Post and Mail Illustrations. Choose your graphic Mail illustration among Envelope, Postal wrapper, Air-envelopes, Parcel, Mail box, Postman, Courier, E-mail."The Global Positioning System (GPS) is a space-based satellite navigation system that provides location and time information in all weather conditions, anywhere on or near the Earth where there is an unobstructed line of sight to four or more GPS satellites. The system provides critical capabilities to military, civil and commercial users around the world. It is maintained by the United States government and is freely accessible to anyone with a GPS receiver." [Global Positioning System. Wikipedia]
This GPS operation diagram example was created using the ConceptDraw PRO diagramming and vector drawing software extended with the Telecommunication Network Diagrams solution from the Computer and Networks area of ConceptDraw Solution Park.
This GPS operation diagram example was created using the ConceptDraw PRO diagramming and vector drawing software extended with the Telecommunication Network Diagrams solution from the Computer and Networks area of ConceptDraw Solution Park.
Work Flow Chart
What is a Work Flow Chart? It is a chart which visually displays the step-by-step transferring of data, documents and tasks during the work. ConceptDraw DIAGRAM extended with Workflow Diagrams solution from the Business Processes area of ConceptDraw Solution Park is the best software for drawing the Work Flow Chart of any complexity.Drawing Illustration
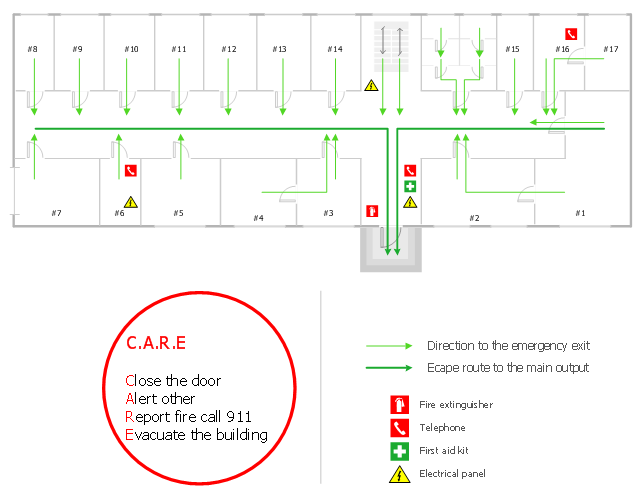
The Nature Solution addition to ConceptDraw Solution Park for ConceptDraw DIAGRAM includes new libraries that provide a wide range nature objects and it can be used in many areas."Emergency evacuation is the immediate and urgent movement of people away from the threat or actual occurrence of a hazard. Examples range from the small scale evacuation of a building due to a storm or fire to the large scale evacuation of a district because of a flood, bombardment or approaching weather system. In situations involving hazardous materials or possible contamination, evacuees may be decontaminated prior to being transported out of the contaminated area. ...
Planning.
Emergency evacuation plans are developed to ensure the safest and most efficient evacuation time of all expected residents of a structure, city, or region. A benchmark "evacuation time" for different hazards and conditions is established. These benchmarks can be established through using best practices, regulations, or using simulations, such as modeling the flow of people in a building, to determine the benchmark. Proper planning will use multiple exits, contra-flow lanes, and special technologies to ensure full, fast and complete evacuation. Consideration for personal situations which may affect an individual's ability to evacuate is taken into account, including alarm signals that use both aural and visual alerts, and also evacuation equipment such as sleds, pads, and chairs for non-ambulatory people. Regulations such as building codes can be used to reduce the possibility of panic by allowing individuals to process the need to self-evacuate without causing alarm. Proper planning will implement an all-hazards approach so that plans can be reused for multiple hazards that could exist." [Emergency evacuation. Wikipedia]
The evacuation plan example was created using the ConceptDraw PRO diagramming and vector drawing software extended with the Fire and Emergency Plans solution from the Building Plans area of ConceptDraw Solution Park.
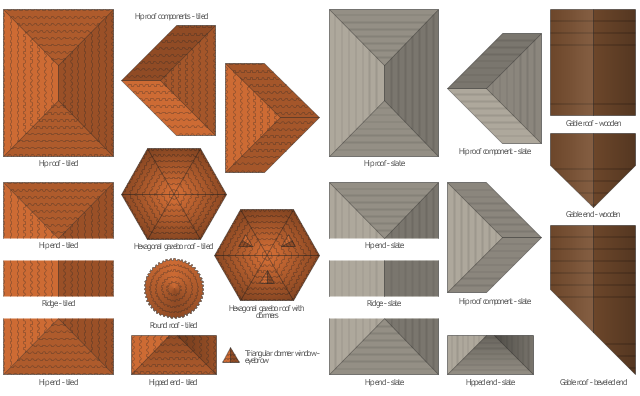
The vector stencils library "Roofs" contains 21 roof clipart images.
Use it to create your landscape design and garden plans.
"A roof of a building envelope, both the covering on the uppermost part of a building or shelter which provides protection from animals and weather, notably rain, but also heat, wind and sunlight; and the framing or structure which supports the covering. ...
In most countries a roof protects primarily against rain. A verandah may be roofed with material that protects against sunlight but admits the other elements. The roof of a garden conservatory, protects plants from cold, wind and rain but admits light.
A roof may also provide additional living space, for example a roof garden." [Roof. Wikipedia]
The clip art example "Design elements - Roofs" was created using the ConceptDraw PRO diagramming and vector drawing software extended with the Landscape & Garden solution from the Building Plans area of ConceptDraw Solution Park.
- New Nature Solution for ConceptDraw PRO v9 to Better Illustrate ...
- Workflow diagram - Weather forecast | Work Flow Chart | Workflow ...
- Workflow diagram - Weather forecast | How to Connect Social Media ...
- Weather - Vector stencils library
- Workflow diagram - Weather forecast | Workflow Diagrams | Cross ...
- How can you illustrate the weather condition | Design elements ...
- Design elements - Weather
- Er Diagram For Weather Forecasting
- Workflow diagram - Weather forecast
- Design elements - Weather | How can you illustrate the weather ...
- Design elements - Weather | Draw Element Of Weather And Climate
- Workflow diagram - Weather forecast | Workflow Diagrams | IVR ...
- Nature Clipart and Illustrations | Design elements - Weather | How ...
- Water cycle diagram | Weather - Vector stencils library | Rain And ...
- Workflow Diagram Software | Weather - Vector stencils library | Work ...
- How can you illustrate the weather condition | Nature Clipart and ...
- Water cycle diagram | Weather - Vector stencils library | Weather ...
- Workflow diagram - Weather forecast | Work Flow Chart | Types of ...
- Diagrams Of Weather Symbols


