Exam Preparation Mind Map
Mind Map is a way to effectively visualize the complex knowledge, to simplify and accelerate the learning and teaching processes. In this way Mind Maps are always in demand in a lot of spheres, among them business, education, engineering, software development, and many others. Mind Maps are perfect for illustration the documents, reports, textbooks, websites, education materials, lectures, etc. The ConceptDraw MINDMAP professional software from ConceptDraw Office suite provides a lot of powerful tools for brainstorming and designing colorful and attractive Mind Maps, drawings and charts, which ideally suit for structuring information and its representation in a visual and comprehensive form. To prepare effectively for examination, you need organize yourself and also clearly understand the correct sequence of actions. This Mind Map created in ConceptDraw MINDMAP application illustrates the main items during the exam preparation process. The use of predesigned cliparts lets to make your Mind Maps illustrative, colorful and attractive.Mathematics Symbols
ConceptDraw PRO extended with Mathematics solution from the Science and Education area is a powerful diagramming and vector drawing software that offers all needed tools for mathematical diagrams designing. Mathematics solution provides 3 libraries with predesigned vector mathematics symbols and figures: Solid Geometry Library, Plane Geometry Library and Trigonometric Functions Library.
 Mathematics
Mathematics solution extends ConceptDraw PRO software with templates, samples and libraries of vector stencils for drawing the mathematical illustrations, diagrams and charts.
Physics Symbols
ConceptDraw PRO diagramming and vector drawing software extended with Physics solution from the Science and Education area is a powerful software for creating various physics diagrams. Physics solution provides all tools that you can need for physics diagrams designing. It includes 3 libraries with predesigned vector physics symbols: Optics Library, Mechanics Library and Nuclear Physics Library.Scientific Symbols Chart
ConceptDraw PRO is the beautiful design software that provides many vector stencils, examples and templates for drawing different types of illustrations and diagrams.Mathematics Solution from the Science and Education area of ConceptDraw Solution Park includes a few shape libraries of plane, solid geometric figures, trigonometrical functions and greek letters to help you create different professional looking mathematic illustrations for science and education.
Mathematical Diagrams
ConceptDraw PRO diagramming and vector drawing software extended with Mathematics solution from the Science and Education area is the best for creating: mathematical diagrams, graphics, tape diagrams various mathematical illustrations of any complexity quick and easy. Mathematics solution provides 3 libraries: Plane Geometry Library, Solid Geometry Library, Trigonometric Functions Library.Pie Chart Examples and Templates
A pie chart or a circle graph is a circular chart divided into sectors, illustrating numerical proportion. In a pie chart, the arc length of each sector and consequently its central angle and area, is proportional to the quantity it represents. Pie chart examples and templates created using ConceptDraw PRO software helps you get closer with pie charts and find pie chart examples suite your needs.Electrical Symbols — Analog and Digital Logic
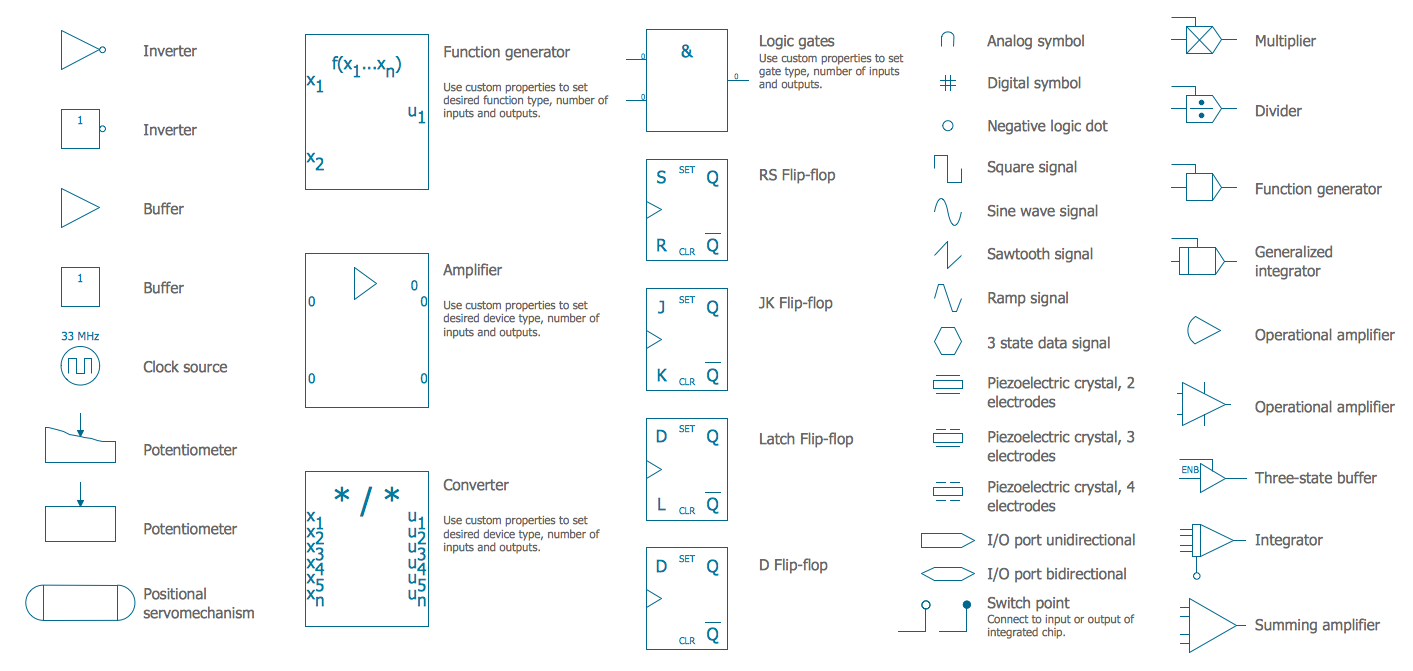
Digital electronics or digital (electronic) circuits are electronics that handle digital signals – discrete bands of analog levels – rather than by continuous ranges (as used in analogue electronics). All levels within a band of values represent the same numeric value. Because of this discretization, relatively small changes to the analog signal levels due to manufacturing tolerance, signal attenuation or parasitic noise do not leave the discrete envelope, and as a result are ignored by signal state sensing circuitry. 26 libraries of the Electrical Engineering Solution of ConceptDraw PRO make your electrical diagramming simple, efficient, and effective. You can simply and quickly drop the ready-to-use objects from libraries into your document to create the electrical diagram.- Sine Series Flowchart
- Design elements - Trigonometric functions | Mathematics Symbols ...
- Design elements - Trigonometric functions | Basic Flowchart ...
- Function hall floor plan | Sine function | Design elements ...
- How To Draw A Flowchart That Solve An Equation
- Draw The Flow Chart Of An Algorithm Of Quadrant Function
- Basic Flowchart Symbols and Meaning | Mathematical Diagrams ...
- Basic Flowchart Symbols and Meaning | Mathematics Symbols ...
- Basic Flowchart Symbols and Meaning | Flow Chart Symbols ...
- Flow Charts Symbol And Their Functions
- Diagram Or Chart About Quadratic Function
- Sine function | Weather - Vector stencils library | Sunlight
- Basic Flowchart Symbols and Meaning | Types of Flowcharts ...
- Geometrical Drawing Program
- Scientific Symbols Chart | Basic Flowchart Symbols and Meaning ...
- Basic Diagramming | Types of Flowchart - Overview | Software ...
- Software Diagrams | Mathematics Symbols | Types of Flowchart ...
- Basic Flowchart Symbols and Meaning | How to Draw Geometric ...
- Feature Comparison Chart Software | Rainfall Bar Chart | Design ...


