Business diagrams & Org Charts with ConceptDraw DIAGRAM
The business diagrams are in great demand, they describe the business processes, business tasks and activities which are executed to achieve specific organizational and business goals, increase productivity, reduce costs and errors. They let research and better understand the business processes. ConceptDraw DIAGRAM is a powerful professional cross-platform business graphics and business flowcharting tool which contains hundreds of built-in collections of task-specific vector stencils and templates. They will help you to visualize and structure information, create various Business flowcharts, maps and diagrams with minimal efforts, and add them to your documents and presentations to make them successful. Among them are Data flow diagrams, Organization charts, Business process workflow diagrams, Audit flowcharts, Cause and Effect diagrams, IDEF business process diagrams, Cross-functional flowcharts, PERT charts, Timeline diagrams, Calendars, Marketing diagrams, Pyramids, Target diagrams, Venn diagrams, Comparison charts, Analysis charts, Dashboards, and many more. Being a cross-platform application, ConceptDraw DIAGRAM is very secure, handy, free of bloatware and one of the best alternatives to Visio for Mac users.
HelpDesk
How to Use the MS Word Exchange Solution
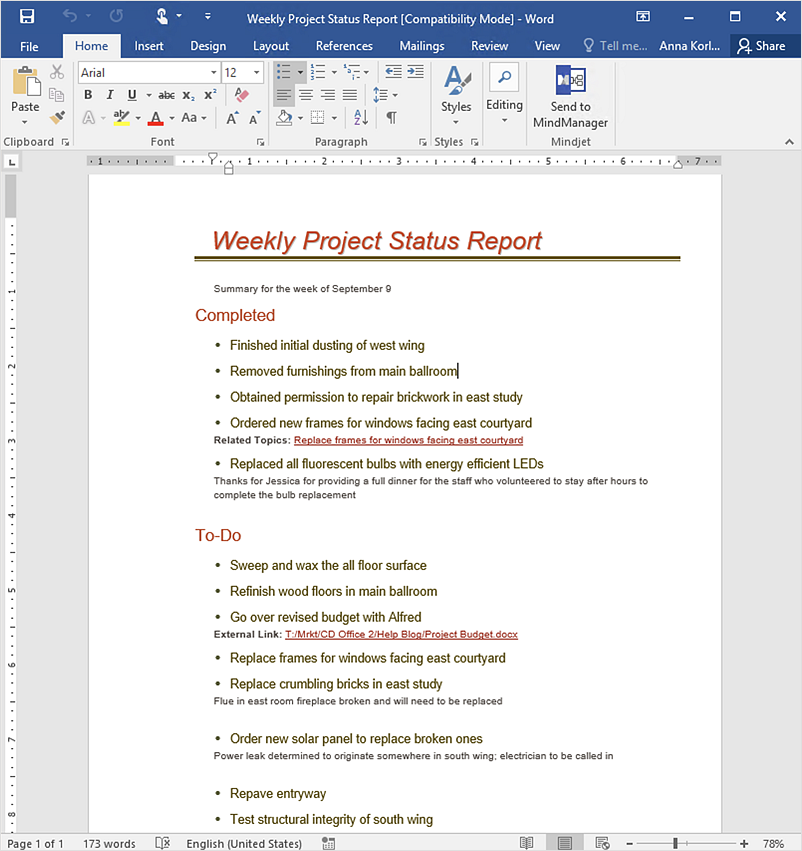
ConceptDrwa MINDMAP gives you the ability to export your mind map into a ready-to-use Microsoft Word document.HelpDesk
How to Draw a Matrix Organizational Chart
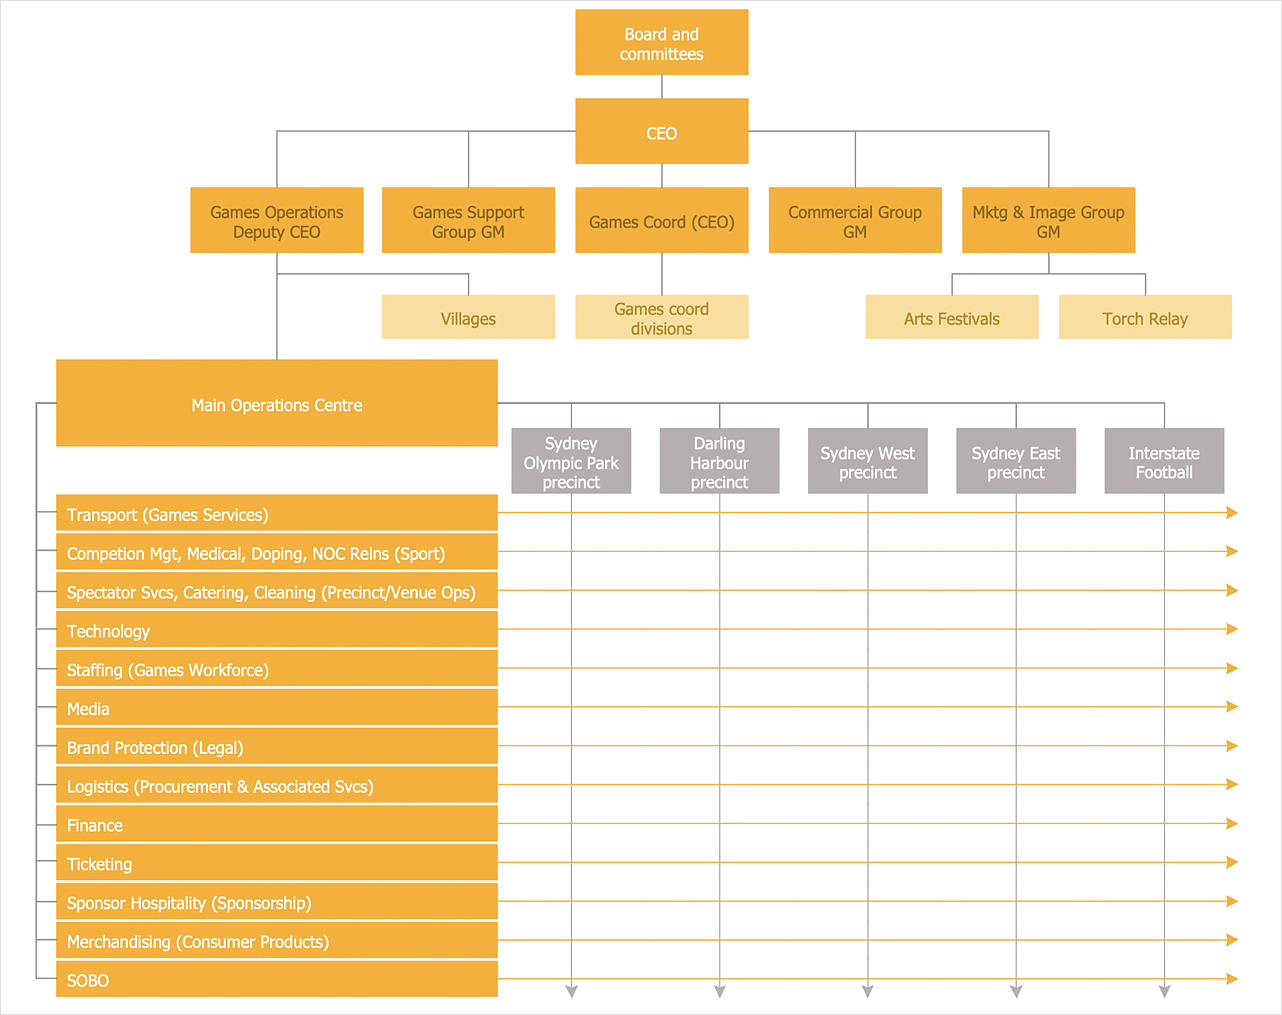
There are a number of moments which are influenced on how the organizational structure of a certain business needs to be, how complex, and which type it should keep. The matrix organizational structure is atypical because it brings together employees and managers from different departments to work toward accomplishing a goal. This structure is commonly found in businesses that have more than one line of reportage. For instance, a company might contain an engineering department with engineering managers who workers report to. However, these workers might also have to liaise with different product or project managers depending on current tasks. Some form of matrix organization is found in most large-scale modern businesses. It is one of the most complicated reporting structures. You can easily build a clear matrix organizational chart in ConceptDraw DIAGRAM using templates from ConceptDraw Solution Park.HelpDesk
How to Create Organizational Chart Quickly
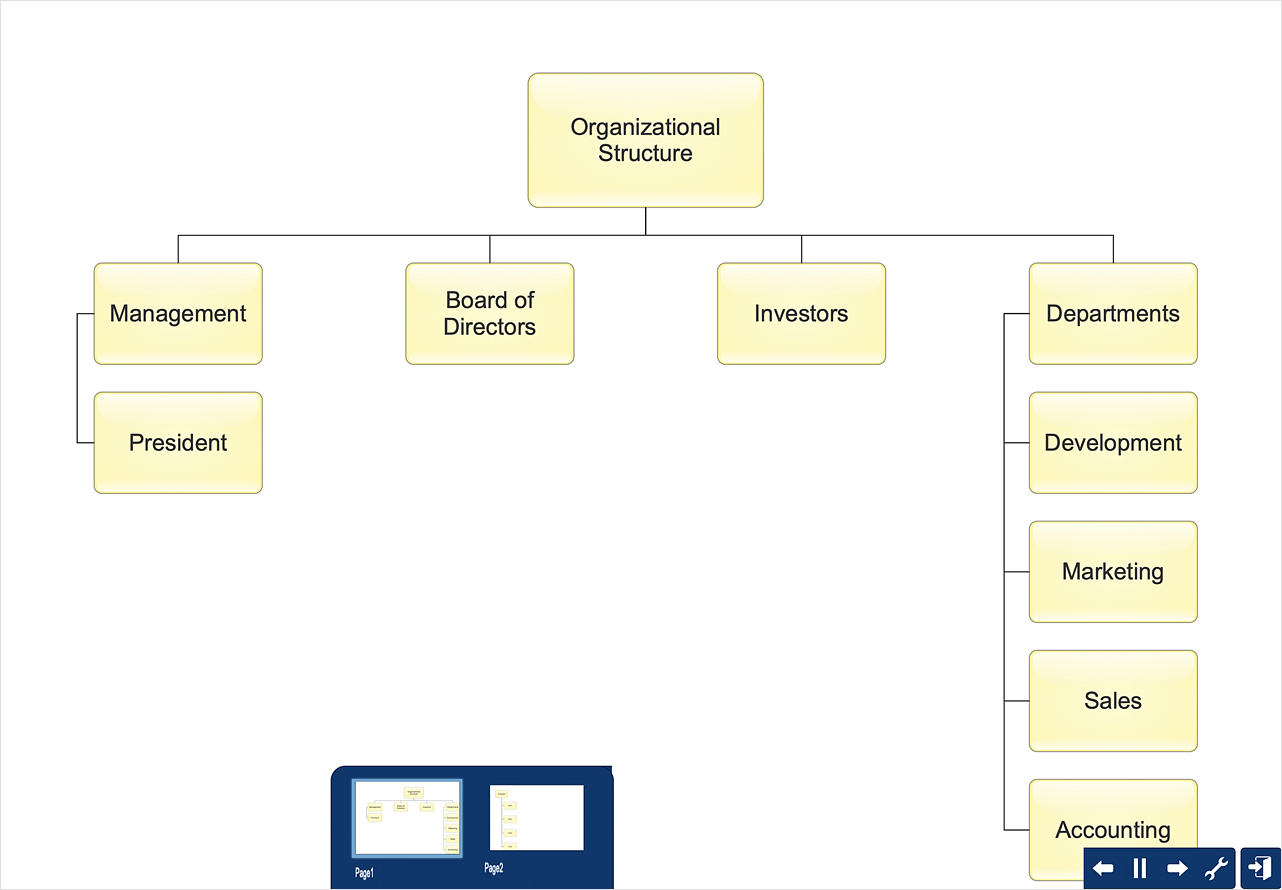
Use ConceptDraw MINDMAP for generating structured data on organization structure and then ConceptDraw DIAGRAM for presenting the results as chart.
 25 Typical Orgcharts
The 25 Typical Orgcharts solution contains powerful organizational structure and organizational management drawing tools, a variety of professionally designed organization chart and matrix organization structure samples, 25 templates based on various orga
 Flowcharts
The Flowcharts solution for ConceptDraw DIAGRAM is a comprehensive set of examples and samples in several varied color themes for professionals that need to represent graphically a process. Solution value is added by the basic flow chart template and shapes' libraries of flowchart notation. ConceptDraw DIAGRAM flow chart creator lets one depict the processes of any complexity and length, as well as design the Flowchart either vertically or horizontally.
HelpDesk
How to Create a Mind Map on PC
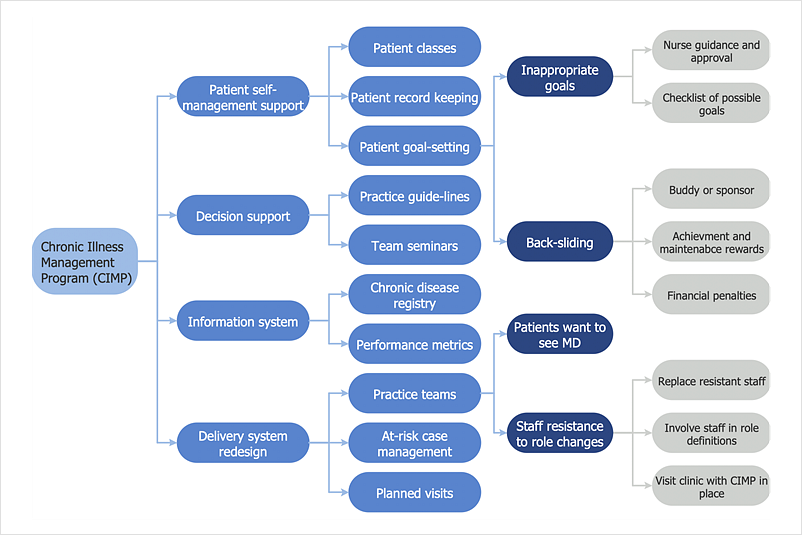
Mind maps are useful forcapturing ideas, organizing and structuring information in a visual form, that is easier to understand, and easier to explain to others. Mind map consists of a general Main Idea surrounded by other related topics and subtopics, which are displayed in a radial hierarchical structure. Read this step-by-step guide on how to create a mind map using ConceptDraw MINDMAP for Windows.HelpDesk
How to Import MS Project File to a Mind Map Using the Project Exchange Solution
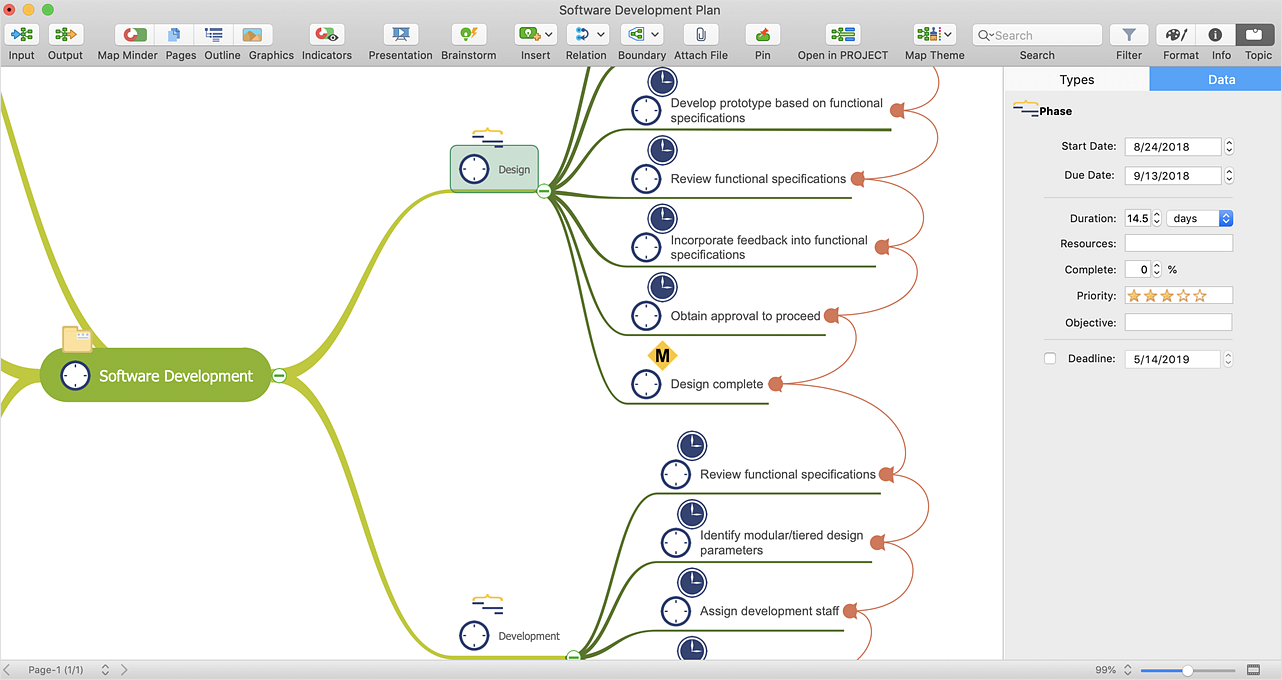
ConceptDraw MINDMAP can export a mind map to MS Project; it can also import a project file from MS Project, making a working visual map of a planned project. ConceptDraw MINDMAP supports inputting external data into a map with one click. Input capabilities are critical because it makes your data visual. When your data is visual, you can manage and communicate it using newly generated documents and/or presentations. Data you can input into your map can come from just about anywhere. Data can come from Microsoft Word, Excel, Outlook, Project, the web, a mind map, and other electronic sources. You can input data as a task list, resource list, Gantt chart, brainstorm or search results.HelpDesk
How to Draw an Organizational Chart
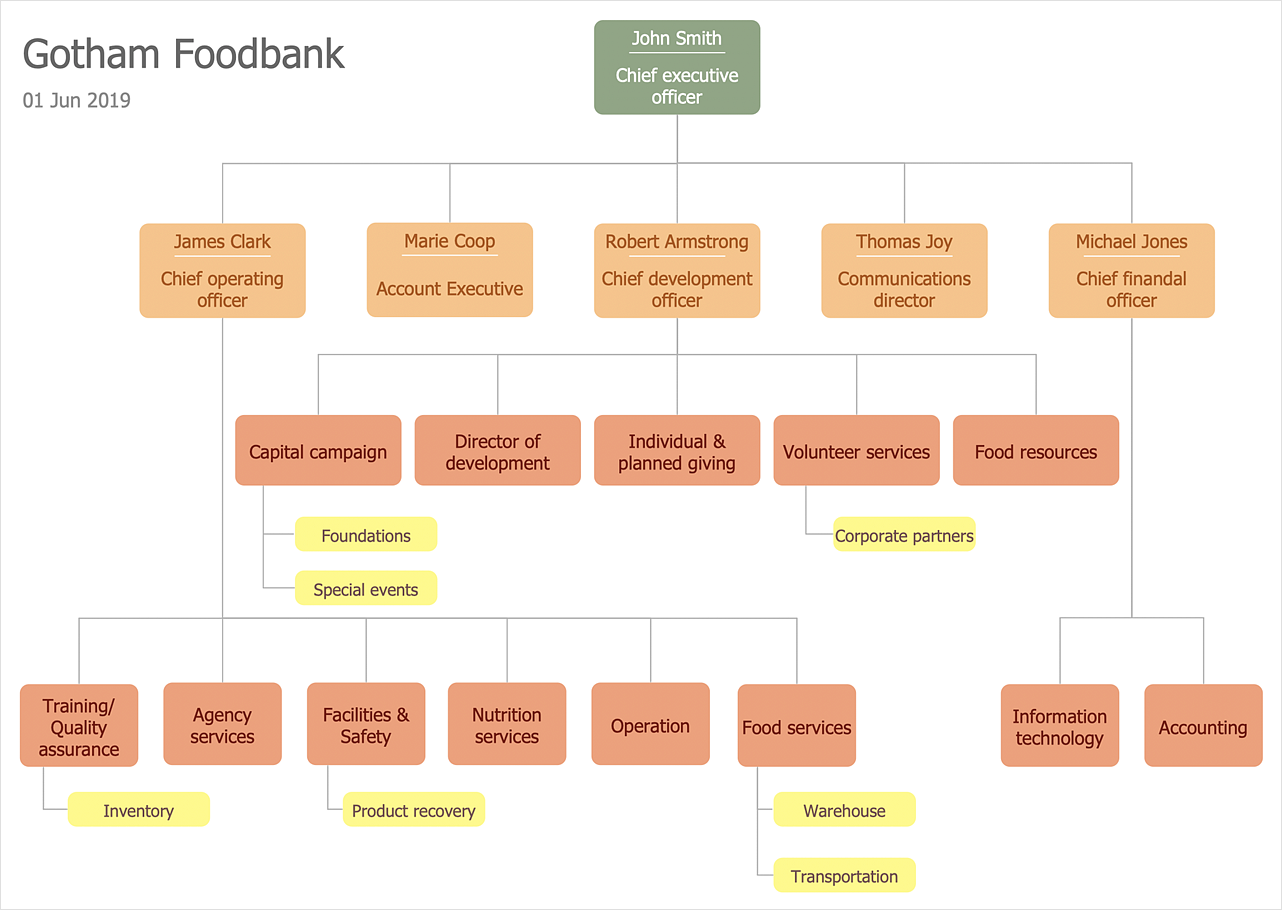
Polish your diagram appearance using the tools provided in the Format panel. The organizational chart software is a valuable tool for modern business. It is important for any business to build a clear organizational structure that determines the responsibilities and relationships between different positions in the organization. The clear structured organization - means the clear structured business workflow, which is the core of success in the business. ConceptDraw DIAGRAM is an org chart software that allows you to draw an organizational structure of your company quickly and easily.HelpDesk
How to Manage Problem Solving Using Seven Management and Planning Tools
Stage by stage gouide on using visual tools to move toward solving the problem.
 Accounting Flowcharts
Accounting Flowcharts solution extends ConceptDraw DIAGRAM software with templates, samples and library of vector stencils for drawing the accounting flow charts.
HelpDesk
How To Make an MS Visio Rack Diagram
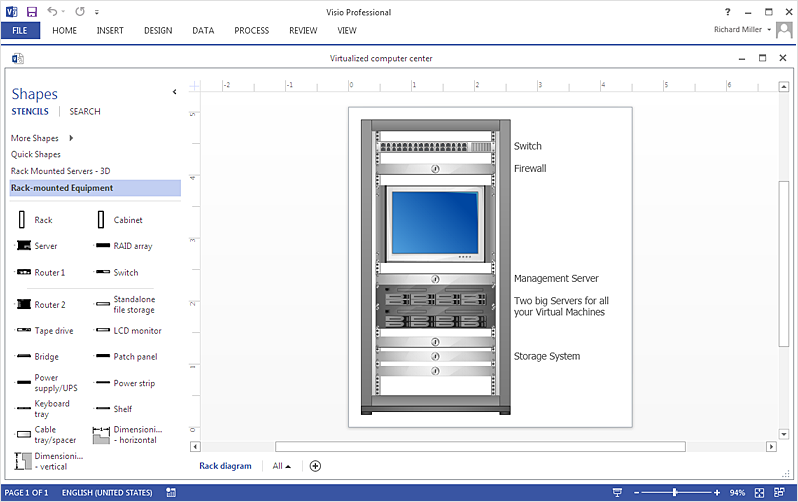
Rack Diagram is a tool of network engineers and administrators. It should depict the structure of equipment installation, and provide the base to support electronic equipment, power, cooling, and cable management. ConceptDraw DIAGRAM allows you to easily create a diagram that will help to detail the type of rack equipment that best fits your needs and then lets you customize your installation. Choosing the right equipment will deliver better results as well as saving you time and money. ConceptDraw DIAGRAM allows you to create rack diagrams and then make an MS Visio file from diagrams in a few short steps.- Explain In Detail With Flow Chart That Flow Of Communication In A
- Basic Flowchart Symbols and Meaning | Flowchart design ...
- Basic Flowchart Symbols and Meaning | Flowchart design ...
- Flow Chart Creator | Trading process diagram - Deployment ...
- Data Flow Diagrams | Process Flowchart | Visio Files and ...
- How to Draw an Organization Chart | Process Flowchart ...
- Work Order Process Flowchart . Business Process Mapping ...
- Basic Flowchart Symbols and Meaning | Flowchart design ...
- How To Draw A Flowchart Of Technology
- Process Flowchart | Basic Flowchart Symbols and Meaning ...
- Process Flowchart | Functional Organizational Structure | Cross ...
- How To Draw Data Flow Diagram
- Process Flowchart | Cross-Functional Flowchart (Swim Lanes) | Best ...
- Process Flowchart | Flowchart design. Flowchart symbols, shapes ...
- Flowchart Process
- Draw And Briefly Explain All The Symbol Of Flowchart
- Flow chart Example. Warehouse Flowchart | Process Flowchart ...
- Trading process diagram - Deployment flowchart | Vertical Cross ...
- Cross-Functional Flowchart (Swim Lanes) | Swim Lane Diagrams ...
- Organizational Structure | Process Flowchart | Flow chart Example ...

