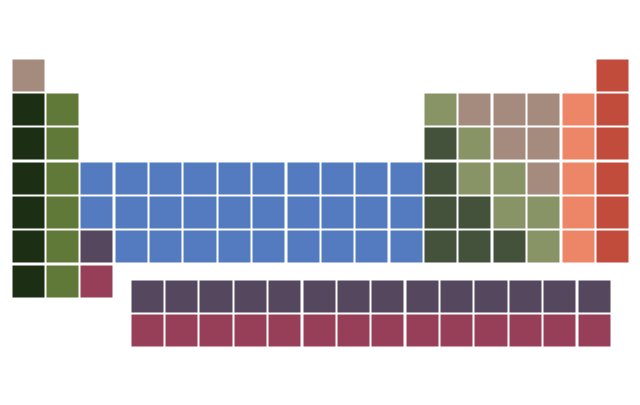
The vector stencils library "Periodic table of chemical elements" contains 119 icon symbols of chemical elements for drawing Mendeleev's periodic table, chemical diagrams, infographics and illustrations.
"A chemical element is a pure chemical substance consisting of a single type of atom distinguished by its atomic number, which is the number of protons in its atomic nucleus. Elements are divided into metals, metalloids, and non-metals. Familiar examples of elements are carbon, nitrogen, oxygen (non-metals), silicon, arsenic (metalloids), aluminium, iron, copper, gold, mercury, and lead (metals).
The lightest chemical elements, including hydrogen, helium and smaller amounts of lithium, beryllium and boron, are thought to have been produced by various cosmic processes during the Big Bang and cosmic-ray spallation. Production of heavier elements, from carbon to the very heaviest elements, proceeded by stellar nucleosynthesis, and these were made available for later solar system and planetary formation by planetary nebulae and supernovae, which blast these elements into space. The high abundance of oxygen, silicon, and iron on Earth reflects their common production in such stars. While most elements are generally stable, a small amount of natural transformation of one element to another also occurs in the decay of radioactive elements as well as other natural nuclear processes." [Chemical element. Wikipedia]
The chemical symbols example "Design elements - Periodic table of chemical elements" was created using the ConceptDraw PRO software extended with the Chemistry solution from the Science and Education area of ConceptDraw Solution Park.
"A chart can take a large variety of forms, however there are common features that provide the chart with its ability to extract meaning from data.
Typically the data in a chart is represented graphically, since humans are generally able to infer meaning from pictures quicker than from text. Text is generally used only to annotate the data.
One of the more important uses of text in a graph is the title. A graph's title usually appears above the main graphic and provides a succinct description of what the data in the graph refers to.
Dimensions in the data are often displayed on axes. If a horizontal and a vertical axis are used, they are usually referred to as the x-axis and y-axis respectively. Each axis will have a scale, denoted by periodic graduations and usually accompanied by numerical or categorical indications. Each axis will typically also have a label displayed outside or beside it, briefly describing the dimension represented. If the scale is numerical, the label will often be suffixed with the unit of that scale in parentheses. ...
Within the graph a grid of lines may appear to aid in the visual alignment of data. The grid can be enhanced by visually emphasizing the lines at regular or significant graduations. The emphasized lines are then called major grid lines and the remainder are minor grid lines.
The data of a chart can appear in all manner of formats, and may include individual textual labels describing the datum associated with the indicated position in the chart. The data may appear as dots or shapes, connected or unconnected, and in any combination of colors and patterns. Inferences or points of interest can be overlaid directly on the graph to further aid information extraction.
When the data appearing in a chart contains multiple variables, the chart may include a legend (also known as a key). A legend contains a list of the variables appearing in the chart and an example of their appearance. This information allows the data from each variable to be identified in the chart." [Chart. Wikipedia]
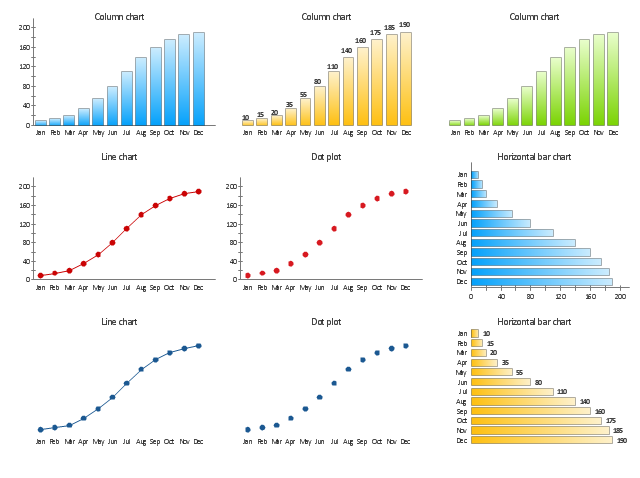
The vector stencils library "Time series charts" contains 10 templates: 3 column charts, 3 bar charts, 2 line graphs and 2 dot plots. All these charts are Live Objects displaying the data from external data source files.
Use these chart templates to design your business performance digital dashboards using the ConceptDraw PRO diagramming and vector drawing software.
The example "Design elements - Time series charts" is included in the Time Series Dashboard solution from the area "What is a Dashboard" of ConceptDraw Solution Park.
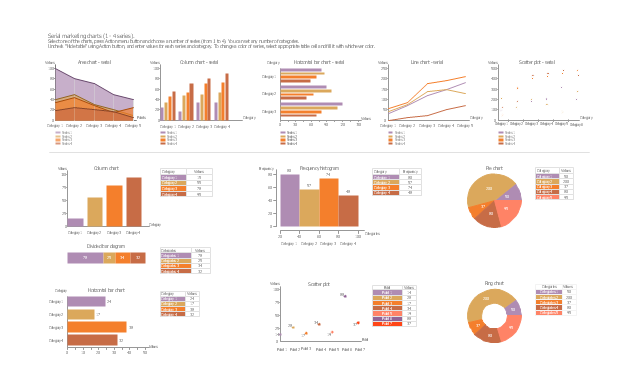
The vector stencils library "Marketing charts" contains 12 graphs and charts: area chart, column chart, divided bar diagram, histogram, horizontal bar graph, line graph, pie chart, ring chart, scatter plot.
Use it to create your marketing infograms.
"A chart can take a large variety of forms, however there are common features that provide the chart with its ability to extract meaning from data.
Typically the data in a chart is represented graphically, since humans are generally able to infer meaning from pictures quicker than from text. Text is generally used only to annotate the data.
One of the more important uses of text in a graph is the title. A graph's title usually appears above the main graphic and provides a succinct description of what the data in the graph refers to.
Dimensions in the data are often displayed on axes. If a horizontal and a vertical axis are used, they are usually referred to as the x-axis and y-axis respectively. Each axis will have a scale, denoted by periodic graduations and usually accompanied by numerical or categorical indications. Each axis will typically also have a label displayed outside or beside it, briefly describing the dimension represented. If the scale is numerical, the label will often be suffixed with the unit of that scale in parentheses. ...
The data of a chart can appear in all manner of formats, and may include individual textual labels describing the datum associated with the indicated position in the chart. The data may appear as dots or shapes, connected or unconnected, and in any combination of colors and patterns. Inferences or points of interest can be overlaid directly on the graph to further aid information extraction.
When the data appearing in a chart contains multiple variables, the chart may include a legend (also known as a key). A legend contains a list of the variables appearing in the chart and an example of their appearance. This information allows the data from each variable to be identified in the chart." [Chart. Wikipedia]
The shapes example "Design elements - Marketing charts" was created using the ConceptDraw PRO diagramming and vector drawing software extended with the Marketing Infographics solition from the area "Business Infographics" in ConceptDraw Solution Park.
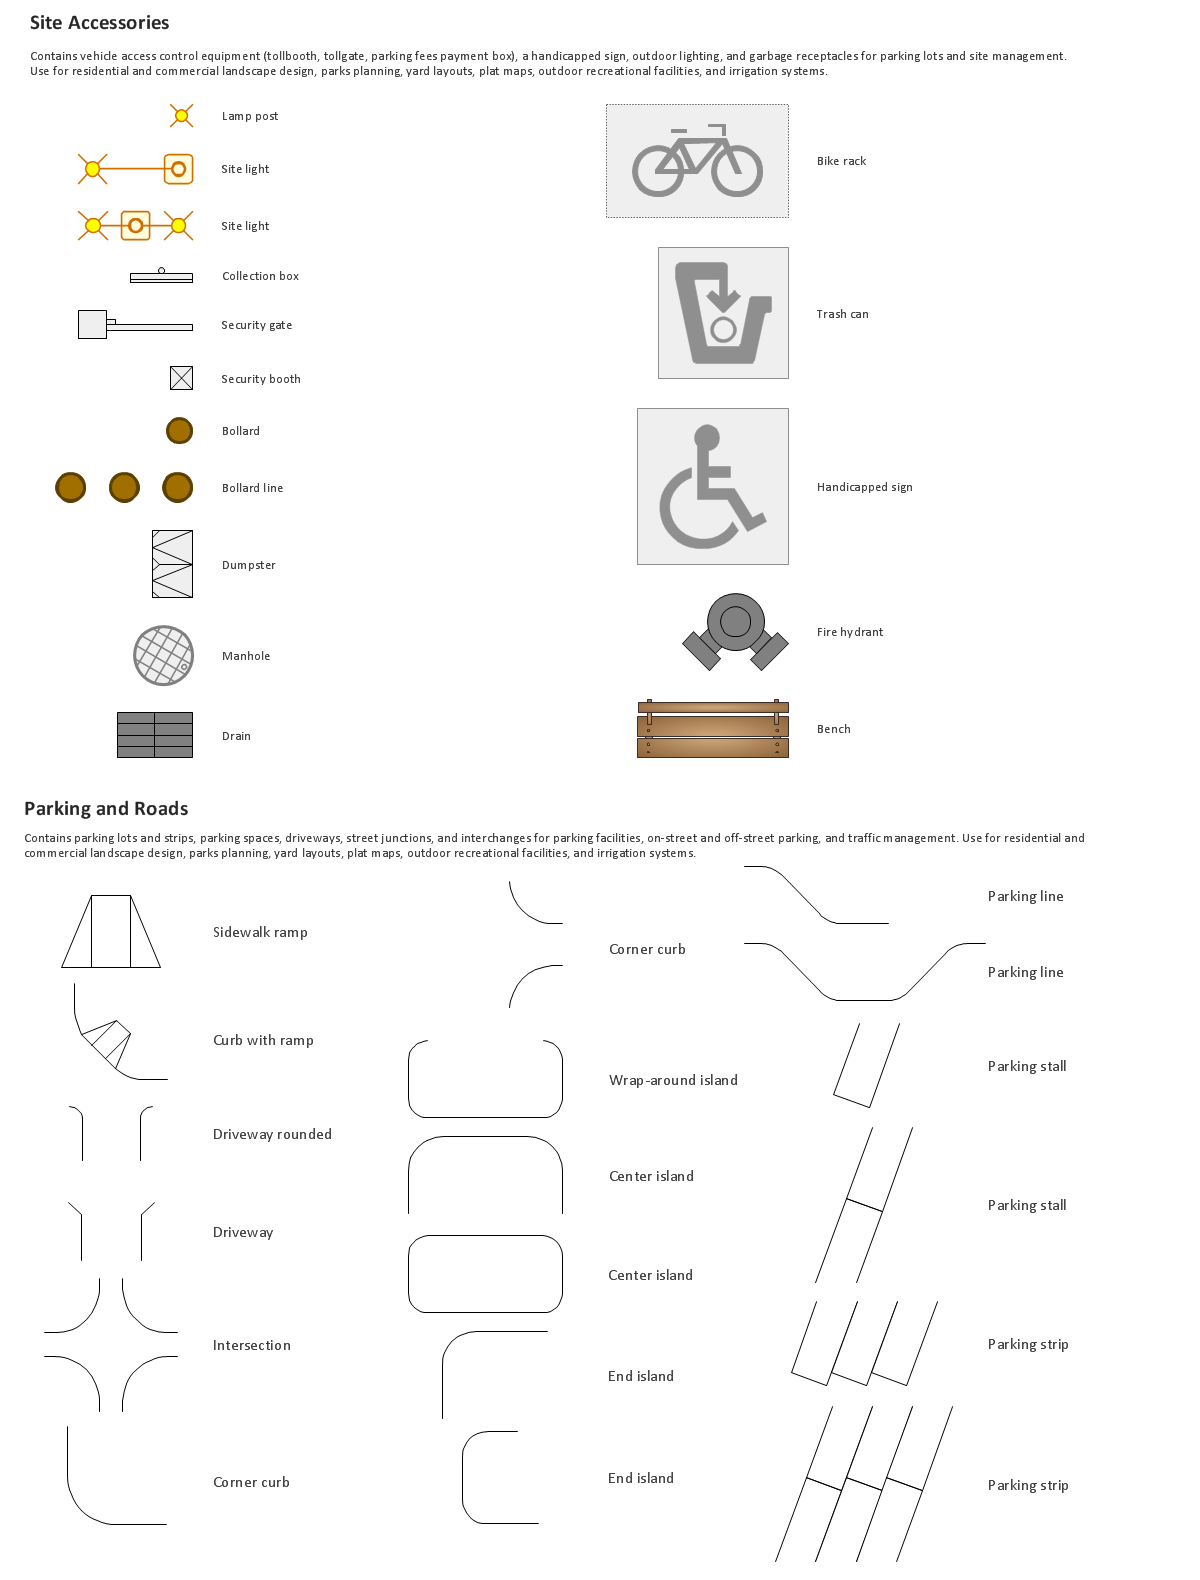
Building Drawing. Design Element Site Plan
Site Plan is a part of a development project. It is a visual graphic representation of the arrangement of buildings, parking for cars and bikes, drives, landscaping, parks, flowerbeds, benches and other structural elements on the plan. Depending on the degree of detailing you can see on the Site plan more or fewer of building constructions and landscape design elements. ConceptDraw DIAGRAM Solution Park includes a specially developed Site Plans solution from the Building Plans area, which offers templates, samples, examples, and a lot of predesigned building drawing design elements for Site plan. The set of design elements contains the exclusive vector shapes of site accessories, parking, roads, trees, plants, etc. So, with confidence we can say that ConceptDraw DIAGRAM software with Site Plans solution is the best help for all in development and drawing your own Residential and Commercial landscape designs, Site plans, Park plans, Yard layouts, Outdoor recreational facilities and Irrigation system plans, and many others.
Chemistry Symbols and Meanings
Chemistry solution offers 5 libraries with large collection of vector chemistry symbols and meanings, chemistry equation symbols, organic chemistry symbols, and chemical clipart: Chemical Elements Library, Chemical Drawings Library, Conformations Library, Laboratory Equipment Library, Periodic Table of Chemical Elements Library.Organic Chemistry Symbols
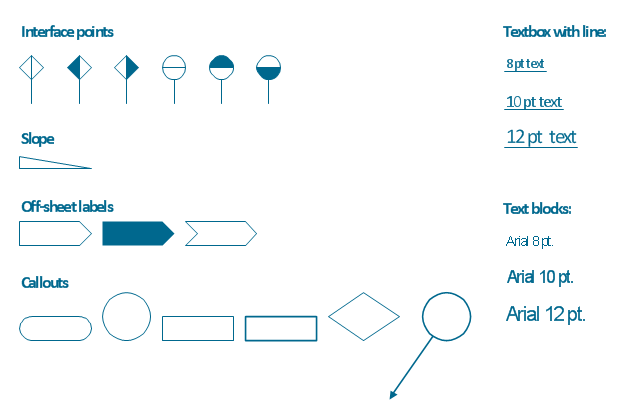
ConceptDraw DIAGRAM diagramming and vector drawing software extended with Chemistry solution from the Science and Education area of ConceptDraw Solution Park is effective for drawing various organic chemistry schemes, diagrams, illustrations thanks to the included collection of predesigned organic chemistry symbols.The vector stencils library "Process annotations" contains 22 symbols of interface points, slope, off-sheet labels, callouts and textboxes.
Use these shapes for setting automatic labels to display a datasheet field for a pipeline shape, labels, captions, outlines, off-sheet labels, text balloons, annotations, outlines, tags, and descriptions.
"In engineering a process is a set of interrelated tasks that, together, transform inputs into outputs. These tasks may be carried out by people, nature, or machines using resources; so an engineering process must be considered in the context of the agents carrying out the tasks, and the resource attributes involved. Systems Engineering normative documents and those related to Maturity Models are typically based on processes. For example, System Engineering processes of the EIA-632 and processes involved in the Capability Maturity Model Integration (CMMI) institutionalization and improvement approach. Constraints imposed on the tasks and resources required to implement them are essential for executing the tasks mentioned.
A chemical process is a series of unit operations used to produce a material in large quantities.
In the chemical industry, chemical engineers will use the following to define or illustrate a process:
Process Flow Diagram (PFD),
Piping and instrumentation diagram
(P&ID),
Simplified process description,
Detailed process description,
Project management,
Process simulation." [Process (engineering). Wikipedia]
The example "Design elements - Process annotations" was created using the ConceptDraw PRO diagramming and vector drawing software extended with the Chemical and Process Engineering solution from the Engineering area of ConceptDraw Solution Park.
Chemical Engineering
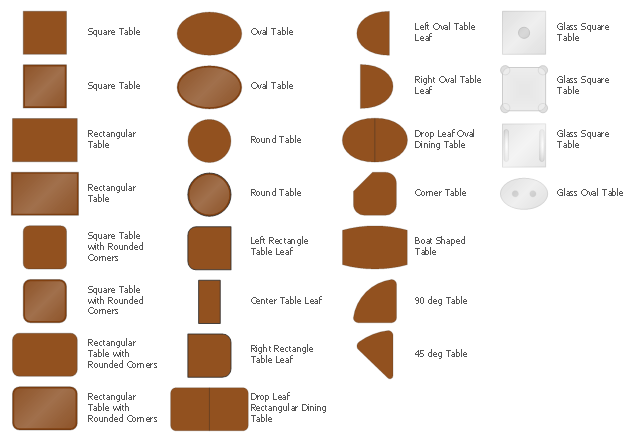
ConceptDraw DIAGRAM is a powerful diagramming and vector drawing software. Extended with Chemical and Process Engineering Solution from the Industrial Engineering Area of ConceptDraw Solution Park, it became the best Chemical Engineering software.The design elements library Tables contains 27 symbols of tables.
Use the vector stencils library Tables to develop house floor plans, home designs, kitchen and dining room design and furniture layout of cafe or restaurant.
"A table is a form of furniture with a flat horizontal upper surface used to support objects of interest, for storage, show, and/ or manipulation. The surface must be held stable; for reasons of simplicity, this is usually done by support from below by either a column, a "base", or at least three columnar "stands". In special situations, table surfaces may be supported from a nearby wall, or suspended from above.
Common design elements include:
top surfaces of various shapes, including rectangular, rounded, or semi-circular;
legs arranged in two or more similar pairs;
several geometries of folding table that can be collapsed into a smaller volume;
heights ranging up and down from the most common 18–30 inches (46–76 cm) range, often reflecting the height of chairs or bar stools used as seating for people making use of a table, as for eating or performing various manipulations of objects resting on a table;
presence or absence of drawers;
expansion of the surface by insertion of leaves or locking hinged drop leaf sections into horizontal position.
Desks are tables specifically intended for information-manipulation tasks, including writing and use of interactive electronics.
Tables of various shapes, heights, and sizes are designed for specific uses:
Dining room tables are designed to be used for formal dining.
Bedside tables, nightstands, or night tables are small tables used in a bedroom. They are often used for convenient placement of a small lamp, alarm clock, glasses, or other personal items.
Gateleg tables have one or two hinged leaves supported by hinged legs.
Coffee tables are low tables designed for use in a living room, in front of a sofa, for convenient placement of drinks, books, or other personal items.
Refectory tables are long tables designed to seat many people for meals.
Drafting tables usually have a top that can be tilted for making a large or technical drawing. They may also have a ruler or similar element integrated.
Workbenches are sturdy tables, often elevated for use with a high stool or while standing, which are used for assembly, repairs, or other precision handwork.
Nested tables are a set of small tables of graduated size that can be stacked together, each fitting within the one immediately larger. They are for occasional use (such as a tea party), hence the stackable design." [Table (furniture). Wikipedia]
The shapes library Tables is provided by the Floor Plans solution from the Building Plans area of ConceptDraw Solution Park.
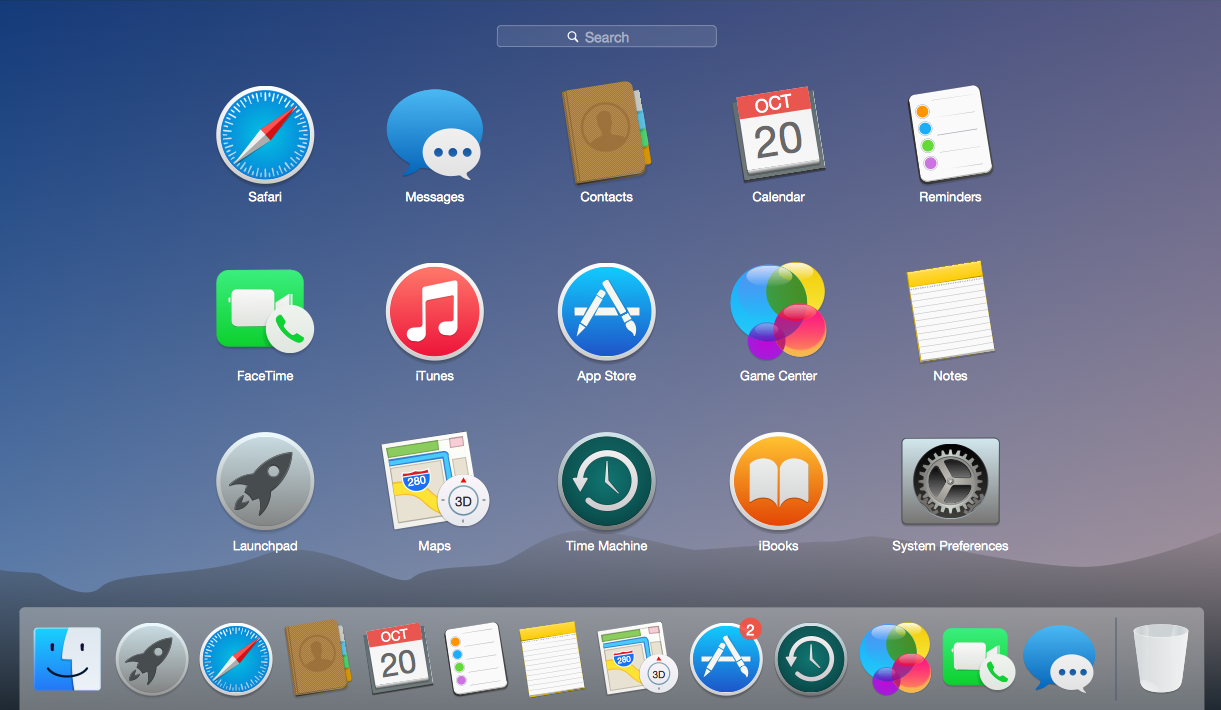
Mac OS User Interface Design Examples
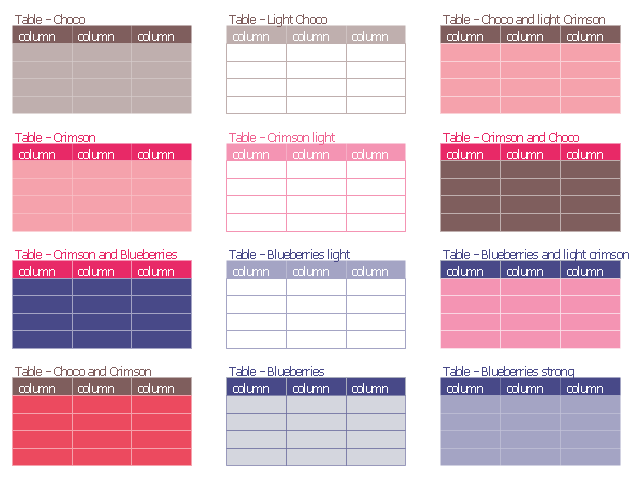
ConceptDraw DIAGRAM is a powerful diagramming and vector drawing GUI software. Extended with Mac OS User Interface solution from the Software Development area, ConceptDraw DIAGRAM is the best software for designing professional looking user interfaces for new OS X 10.10 Yosemite operating system developed for Macintosh computers. Mac OS User Interface solution offers you large quantity of Mac OS templates, samples and user interface design examples.The vector stencils library "Tables" contains 12 table blocks. Use it to add typography elements into your infographics.
"A table is a means of arranging data in rows and columns. The use of tables is pervasive throughout all communication, research and data analysis. Tables appear in print media, handwritten notes, computer software, architectural ornamentation, traffic signs and many other places. The precise conventions and terminology for describing tables varies depending on the context. Further, tables differ significantly in variety, structure, flexibility, notation, representation and use. In books and technical articles, tables are typically presented apart from the main text in numbered and captioned floating blocks." [Table (information). Wikipedia]
The example "Design elements - Tables" was created using the ConceptDraw PRO diagramming and vector drawing software extended with the Typography Infographics solition from the area "What is infographics" in ConceptDraw Solution Park.
 Website Wireframe
The innovative Website Wireframe solution enhances the ConceptDraw DIAGRAM functionality with newest wireframe tools, libraries with variety of predesigned icons, symbols, buttons, graphics, forms, boxes, and many other vector elements, templates and professionally designed samples, which make it the best wireframing software. Website Wireframe solution gives you significant advantages when designing and maintaining websites, creating skeletal and content-free depictions of website structure, making website prototypes and planning the content arrangement before committing to design, also speeds up the processes of sketching, producing and sharing wireframe examples of website style and interface design.
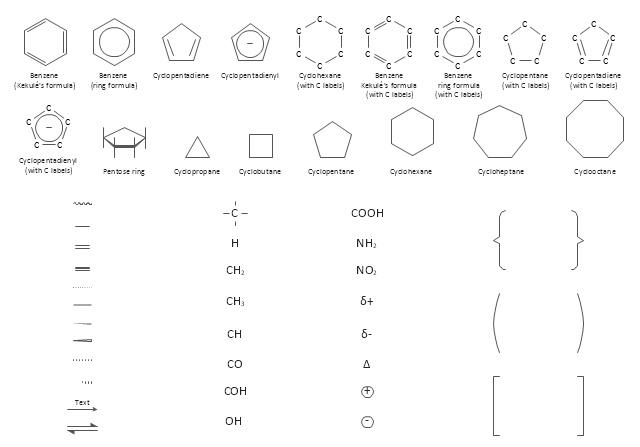
The vector stencils library "Chemical drawings" contains 81 symbols of organic compounds and functional groups for chemical drawing.
Use it to draw structural formulas of organic molecules, schemes of chemical reactions and organic chemistry diagrams.
"Structural drawings.
Organic molecules are described more commonly by drawings or structural formulas, combinations of drawings and chemical symbols. The line-angle formula is simple and unambiguous. In this system, the endpoints and intersections of each line represent one carbon, and hydrogen atoms can either be notated explicitly or assumed to be present as implied by tetravalent carbon. The depiction of organic compounds with drawings is greatly simplified by the fact that carbon in almost all organic compounds has four bonds, nitrogen three, oxygen two, and hydrogen one. ...
Organic reactions.
Organic reactions are chemical reactions involving organic compounds. While pure hydrocarbons undergo certain limited classes of reactions, many more reactions which organic compounds undergo are largely determined by functional groups. The general theory of these reactions involves careful analysis of such properties as the electron affinity of key atoms, bond strengths and steric hindrance. These issues can determine the relative stability of short-lived reactive intermediates, which usually directly determine the path of the reaction.
The basic reaction types are: addition reactions, elimination reactions, substitution reactions, pericyclic reactions, rearrangement reactions and redox reactions. ...
Each reaction has a stepwise reaction mechanism that explains how it happens in sequence - although the detailed description of steps is not always clear from a list of reactants alone.
The stepwise course of any given reaction mechanism can be represented using arrow pushing techniques in which curved arrows are used to track the movement of electrons as starting materials transition through intermediates to final products." [Organic chemistry. Wikipedia]
The chemical symbols example "Design elements - Chemical drawings" was created using the ConceptDraw PRO software extended with the Chemistry solution from the Science and Education area of ConceptDraw Solution Park.
The vector stencils library "Education pictograms" contains 128 education pictograms. Use this flat icon set to design your educational infogram in ConceptDraw PRO diagramming and vector drawing software.
The vector stencils library "Education pictograms" is included in the Education Infographics solution from the Business Infographics area of ConceptDraw Solution Park.
The vector stencils library "Education pictograms" is included in the Education Infographics solution from the Business Infographics area of ConceptDraw Solution Park.
The vector stencils library "Chemical elements" contains 118 icon symbols of chemical elements.
Use these shapes for drawing atoms, structural formulas of inorganic and organic molecules and ions, and schemes of chemical reaction mechanisms in the ConceptDraw PRO diagramming and vector drawing software extended with the Chemistry solution from the Science and Education area of ConceptDraw Solution Park.
www.conceptdraw.com/ solution-park/ science-education-chemistry
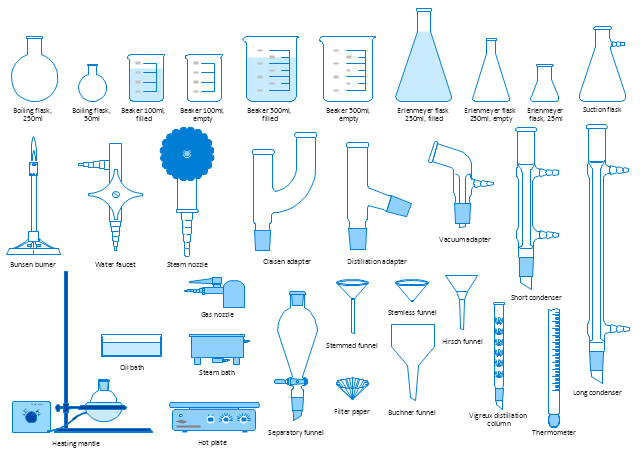
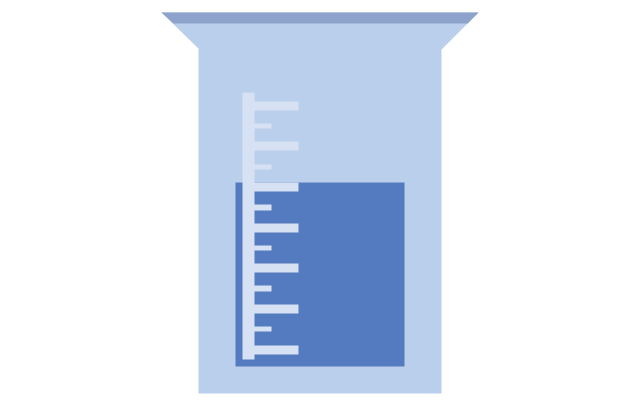
The vector stencils library "Laboratory equipment" contains 31 clipart icons of chemical laboratory equipment and labware for drawing part assembly and mounting schemes of glassware apparatus in chemical experiment diagrams and illustrations.
"Laboratory glassware refers to a variety of equipment, traditionally made of glass, used for scientific experiments and other work in science, especially in chemistry and biology laboratories. ...
Glass use in laboratory applications is not as commonplace as it once was because of cheaper, less breakable, plasticware; however, certain applications still require glassware because glass is relatively inert, transparent, heat-resistant, and easy to customize. The type of glass used is dependent on the application. Borosilicate glass, which is commonly used in reagent bottles, can withstand thermal stress. Quartz glass, which is common in cuvettes, can withstand high temperatures and is transparent in certain parts of the electromagnetic spectrum. Darkened brown or amber (actinic) glass, which is common in dark storage bottles, can block ultraviolet and infrared radiation. Heavy-wall glass, which is common in glass pressure reactors, can withstand pressurized applications." [Laboratory glassware. Wikipedia]
The chemical symbols example "Design elements - Laboratory equipment" was created using the ConceptDraw PRO software extended with the Chemistry solution from the Science and Education area of ConceptDraw Solution Park.
The vector stencils library "Chemical engineering" contains 24 symbols of chemical and process engineering equipment.
Use these shapes for drawing block flow diagrams (BFD), process flow diagrams (PFD), piping and instrumentation diagrams (P&ID), and water flow diagrams.
"Chemical engineering is a branch of engineering that applies the natural (or experimental) sciences (e.g., chemistry and physics) and life sciences (e.g. biology, microbiology and biochemistry) together with mathematics and economics to production, transformation, transportation and proper usage of chemicals, materials and energy. It essentially deals with the engineering of chemicals, energy and the processes that create and/ or convert them. Modern chemical engineers are concerned with processes that convert raw-materials or (cheap)chemicals into more useful or valuable forms. In addition, they are also concerned with pioneering valuable materials and related techniques – which are often essential to related fields such as nanotechnology, fuel cells and bioengineering. Within chemical engineering, two broad subgroups include design, manufacture, and operation of plants and machinery in industrial chemical and related processes ("chemical process engineers") and development of new or adapted substances for products ranging from foods and beverages to cosmetics to cleaners to pharmaceutical ingredients, among many other products ("chemical product engineers")." [Chemical engineering. Wikipedia]
The example "Design elements - Chemical engineering" was created using the ConceptDraw PRO diagramming and vector drawing software extended with the Chemical and Process Engineering solution from the Engineering area of ConceptDraw Solution Park.
The vector stencils library "Education pictograms" contains 128 education pictograms. Use this flat icon set to design your educational infogram in ConceptDraw PRO diagramming and vector drawing software.
The vector stencils library "Education pictograms" is included in the Education Infographics solution from the Business Infographics area of ConceptDraw Solution Park.
The vector stencils library "Education pictograms" is included in the Education Infographics solution from the Business Infographics area of ConceptDraw Solution Park.
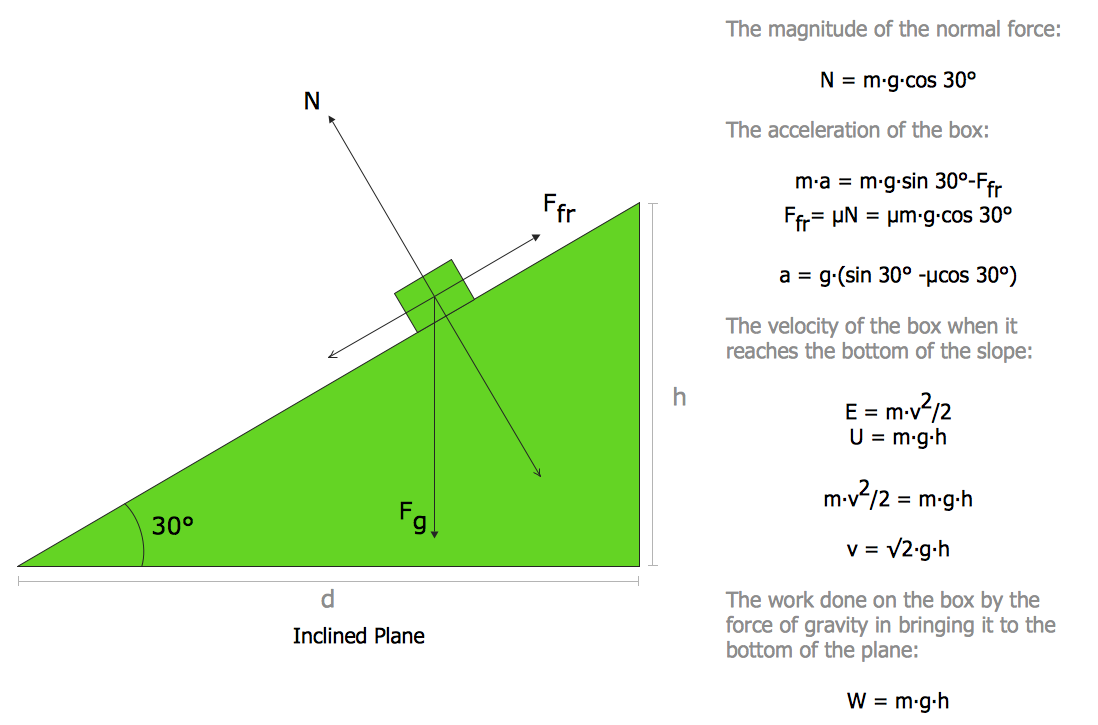
Physics Diagrams
ConceptDraw DIAGRAM diagramming and vector drawing software extended with Physics solution from the Science and Education area is the best for creating: physics diagrams, pictures which describe various physical facts and experiments, illustrations of various electrical, mechanical and optic processes, of any complexity quick and easy.- How to Draw Chemistry Structures | Chemistry | Design elements ...
- Design elements - Periodic table of chemical elements | Chemistry ...
- Periodic Table Drawing On Chart
- Draw A Complete Label Of Periodic Table
- Chemistry Drawings | Modern Periodic Table For Drawing
- Draw A Large Labeled Diagram Of A Periodic Table Of Elements
- Design elements - Periodic table of chemical elements | How to ...
- How to Draw Chemistry Structures | Chemistry | Design elements ...
- Website Wireframe | Draw A Well Labelled Periodic Table
- Draw A Periodic Table And Lebel And Exmple
- Labelled Periodic Table Elements
- Diagram And Label Of The Periodic Table
- A Well Labelled Diagram Of The Periodic Table And Its Full Labelling
- Draw A Well Modren Periodic Table
- Design elements - Periodic table of chemical elements | How To ...
- Periodic Table Draw
- Design elements - Periodic table of chemical elements | How to ...
- Diagram Of A Labeled Periodic Table
- Design elements - Periodic table of chemical elements | Chemistry ...
































































































-chemical-elements---vector-stencils-library.png--diagram-flowchart-example.png)
-chemical-elements---vector-stencils-library.png--diagram-flowchart-example.png)
-chemical-elements---vector-stencils-library.png--diagram-flowchart-example.png)
-chemical-elements---vector-stencils-library.png--diagram-flowchart-example.png)
-chemical-elements---vector-stencils-library.png--diagram-flowchart-example.png)
-chemical-elements---vector-stencils-library.png--diagram-flowchart-example.png)
-chemical-elements---vector-stencils-library.png--diagram-flowchart-example.png)
-chemical-elements---vector-stencils-library.png--diagram-flowchart-example.png)
-chemical-elements---vector-stencils-library.png--diagram-flowchart-example.png)
-chemical-elements---vector-stencils-library.png--diagram-flowchart-example.png)
-chemical-elements---vector-stencils-library.png--diagram-flowchart-example.png)
-chemical-elements---vector-stencils-library.png--diagram-flowchart-example.png)
-chemical-elements---vector-stencils-library.png--diagram-flowchart-example.png)
-chemical-elements---vector-stencils-library.png--diagram-flowchart-example.png)
-chemical-elements---vector-stencils-library.png--diagram-flowchart-example.png)
-chemical-elements---vector-stencils-library.png--diagram-flowchart-example.png)
-chemical-elements---vector-stencils-library.png--diagram-flowchart-example.png)
-chemical-elements---vector-stencils-library.png--diagram-flowchart-example.png)
-chemical-elements---vector-stencils-library.png--diagram-flowchart-example.png)
-chemical-elements---vector-stencils-library.png--diagram-flowchart-example.png)
-chemical-elements---vector-stencils-library.png--diagram-flowchart-example.png)
-chemical-elements---vector-stencils-library.png--diagram-flowchart-example.png)
-chemical-elements---vector-stencils-library.png--diagram-flowchart-example.png)
-chemical-elements---vector-stencils-library.png--diagram-flowchart-example.png)
-chemical-elements---vector-stencils-library.png--diagram-flowchart-example.png)
-chemical-elements---vector-stencils-library.png--diagram-flowchart-example.png)
-chemical-elements---vector-stencils-library.png--diagram-flowchart-example.png)
-chemical-elements---vector-stencils-library.png--diagram-flowchart-example.png)
-chemical-elements---vector-stencils-library.png--diagram-flowchart-example.png)
-chemical-elements---vector-stencils-library.png--diagram-flowchart-example.png)
-chemical-elements---vector-stencils-library.png--diagram-flowchart-example.png)
-chemical-elements---vector-stencils-library.png--diagram-flowchart-example.png)
-chemical-elements---vector-stencils-library.png--diagram-flowchart-example.png)
-chemical-elements---vector-stencils-library.png--diagram-flowchart-example.png)
-chemical-elements---vector-stencils-library.png--diagram-flowchart-example.png)
-chemical-elements---vector-stencils-library.png--diagram-flowchart-example.png)
-chemical-elements---vector-stencils-library.png--diagram-flowchart-example.png)
-chemical-elements---vector-stencils-library.png--diagram-flowchart-example.png)
-chemical-elements---vector-stencils-library.png--diagram-flowchart-example.png)
-chemical-elements---vector-stencils-library.png--diagram-flowchart-example.png)
-chemical-elements---vector-stencils-library.png--diagram-flowchart-example.png)
-chemical-elements---vector-stencils-library.png--diagram-flowchart-example.png)
-chemical-elements---vector-stencils-library.png--diagram-flowchart-example.png)
-chemical-elements---vector-stencils-library.png--diagram-flowchart-example.png)
-chemical-elements---vector-stencils-library.png--diagram-flowchart-example.png)
-chemical-elements---vector-stencils-library.png--diagram-flowchart-example.png)
-chemical-elements---vector-stencils-library.png--diagram-flowchart-example.png)
-chemical-elements---vector-stencils-library.png--diagram-flowchart-example.png)
-chemical-elements---vector-stencils-library.png--diagram-flowchart-example.png)
-chemical-elements---vector-stencils-library.png--diagram-flowchart-example.png)
-chemical-elements---vector-stencils-library.png--diagram-flowchart-example.png)
-chemical-elements---vector-stencils-library.png--diagram-flowchart-example.png)
-chemical-elements---vector-stencils-library.png--diagram-flowchart-example.png)
-chemical-elements---vector-stencils-library.png--diagram-flowchart-example.png)
-chemical-elements---vector-stencils-library.png--diagram-flowchart-example.png)
-chemical-elements---vector-stencils-library.png--diagram-flowchart-example.png)
-chemical-elements---vector-stencils-library.png--diagram-flowchart-example.png)
-chemical-elements---vector-stencils-library.png--diagram-flowchart-example.png)
-chemical-elements---vector-stencils-library.png--diagram-flowchart-example.png)
-chemical-elements---vector-stencils-library.png--diagram-flowchart-example.png)
-chemical-elements---vector-stencils-library.png--diagram-flowchart-example.png)
-chemical-elements---vector-stencils-library.png--diagram-flowchart-example.png)
-chemical-elements---vector-stencils-library.png--diagram-flowchart-example.png)
-chemical-elements---vector-stencils-library.png--diagram-flowchart-example.png)
-chemical-elements---vector-stencils-library.png--diagram-flowchart-example.png)
-chemical-elements---vector-stencils-library.png--diagram-flowchart-example.png)
-chemical-elements---vector-stencils-library.png--diagram-flowchart-example.png)
-chemical-elements---vector-stencils-library.png--diagram-flowchart-example.png)
-chemical-elements---vector-stencils-library.png--diagram-flowchart-example.png)
-chemical-elements---vector-stencils-library.png--diagram-flowchart-example.png)
-chemical-elements---vector-stencils-library.png--diagram-flowchart-example.png)
-chemical-elements---vector-stencils-library.png--diagram-flowchart-example.png)
-chemical-elements---vector-stencils-library.png--diagram-flowchart-example.png)
-chemical-elements---vector-stencils-library.png--diagram-flowchart-example.png)
-chemical-elements---vector-stencils-library.png--diagram-flowchart-example.png)
-chemical-elements---vector-stencils-library.png--diagram-flowchart-example.png)
-chemical-elements---vector-stencils-library.png--diagram-flowchart-example.png)
-chemical-elements---vector-stencils-library.png--diagram-flowchart-example.png)
-chemical-elements---vector-stencils-library.png--diagram-flowchart-example.png)
-chemical-elements---vector-stencils-library.png--diagram-flowchart-example.png)
-chemical-elements---vector-stencils-library.png--diagram-flowchart-example.png)
-chemical-elements---vector-stencils-library.png--diagram-flowchart-example.png)
-chemical-elements---vector-stencils-library.png--diagram-flowchart-example.png)
-chemical-elements---vector-stencils-library.png--diagram-flowchart-example.png)
-chemical-elements---vector-stencils-library.png--diagram-flowchart-example.png)
-chemical-elements---vector-stencils-library.png--diagram-flowchart-example.png)
-chemical-elements---vector-stencils-library.png--diagram-flowchart-example.png)
-chemical-elements---vector-stencils-library.png--diagram-flowchart-example.png)
-chemical-elements---vector-stencils-library.png--diagram-flowchart-example.png)
-chemical-elements---vector-stencils-library.png--diagram-flowchart-example.png)
-chemical-elements---vector-stencils-library.png--diagram-flowchart-example.png)
-chemical-elements---vector-stencils-library.png--diagram-flowchart-example.png)
-chemical-elements---vector-stencils-library.png--diagram-flowchart-example.png)
-chemical-elements---vector-stencils-library.png--diagram-flowchart-example.png)
-chemical-elements---vector-stencils-library.png--diagram-flowchart-example.png)
-chemical-elements---vector-stencils-library.png--diagram-flowchart-example.png)
-chemical-elements---vector-stencils-library.png--diagram-flowchart-example.png)
-chemical-elements---vector-stencils-library.png--diagram-flowchart-example.png)
-chemical-elements---vector-stencils-library.png--diagram-flowchart-example.png)
-chemical-elements---vector-stencils-library.png--diagram-flowchart-example.png)
-chemical-elements---vector-stencils-library.png--diagram-flowchart-example.png)
-chemical-elements---vector-stencils-library.png--diagram-flowchart-example.png)
-chemical-elements---vector-stencils-library.png--diagram-flowchart-example.png)
-chemical-elements---vector-stencils-library.png--diagram-flowchart-example.png)
-chemical-elements---vector-stencils-library.png--diagram-flowchart-example.png)
-chemical-elements---vector-stencils-library.png--diagram-flowchart-example.png)
-chemical-elements---vector-stencils-library.png--diagram-flowchart-example.png)
-chemical-elements---vector-stencils-library.png--diagram-flowchart-example.png)
-chemical-elements---vector-stencils-library.png--diagram-flowchart-example.png)
-chemical-elements---vector-stencils-library.png--diagram-flowchart-example.png)
-chemical-elements---vector-stencils-library.png--diagram-flowchart-example.png)
-chemical-elements---vector-stencils-library.png--diagram-flowchart-example.png)
-chemical-elements---vector-stencils-library.png--diagram-flowchart-example.png)
-chemical-elements---vector-stencils-library.png--diagram-flowchart-example.png)
-chemical-elements---vector-stencils-library.png--diagram-flowchart-example.png)
-chemical-elements---vector-stencils-library.png--diagram-flowchart-example.png)
-chemical-elements---vector-stencils-library.png--diagram-flowchart-example.png)
