Simple Flow Chart
ConceptDraw PRO diagramming and vector drawing software extended with Flowcharts Solution from the 'What is a Diagram' area of ConceptDraw Solution Park is a powerful tool for drawing Flow Charts of any complexity you need. Irrespective of whether you want to draw a Simple Flow Chart or large complex Flow Diagram, you estimate to do it without efforts thanks to the extensive drawing tools of Flowcharts solution, there are professional flowchart symbols and basic flowchart symbols. This sample shows the Gravitational Search Algorithm (GSA) that is the optimization algorithm.HelpDesk
How to Draw Physics Diagrams in ConceptDraw PRO
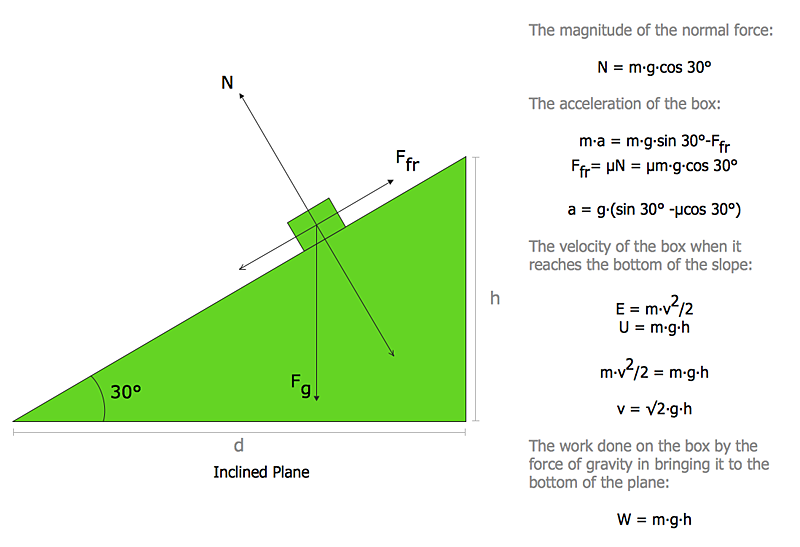
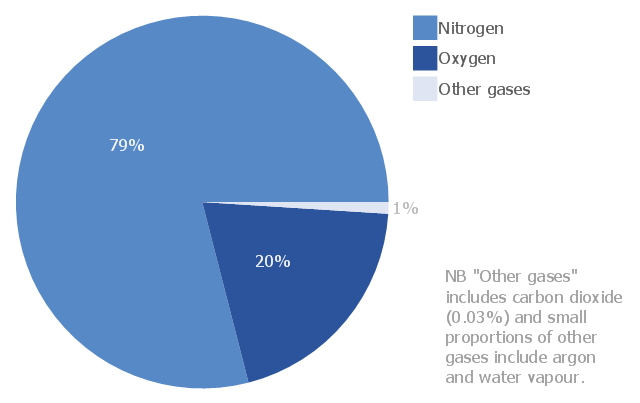
Nothing is more helpful in the study of physics as a visual representation of the physical processes: physics schemes, diagrams and illustrations. Physics charts can be helpful when you learn Physics, perform experiments, or solve any other tasks regarding Physics. ConceptDraw PRO allows you to draw physical diagrams of mechanical, nuclear, optical and electrical processes using the set of vector physics symbols and physics diagram templates.This pie chart sample shows the atmosphere air composition. It was designed on the base of the Wikimedia Commons file: Air composition pie chart.JPG.
[commons.wikimedia.org/ wiki/ File:Air_ composition_ pie_ chart.JPG]
This file is licensed under the Creative Commons Attribution-Share Alike 3.0 Unported license. [creativecommons.org/ licenses/ by-sa/ 3.0/ deed.en]
"The atmosphere of Earth is a layer of gases surrounding the planet Earth that is retained by Earth's gravity. The atmosphere protects life on Earth by absorbing ultraviolet solar radiation, warming the surface through heat retention (greenhouse effect), and reducing temperature extremes between day and night (the diurnal temperature variation).
The common name given to the atmospheric gases used in breathing and photosynthesis is air. By volume, dry air contains 78.09% nitrogen, 20.95% oxygen, 0.93% argon, 0.039% carbon dioxide, and small amounts of other gases. Air also contains a variable amount of water vapor, on average around 1%. Although air content and atmospheric pressure vary at different layers, air suitable for the survival of terrestrial plants and terrestrial animals currently is only known to be found in Earth's troposphere and artificial atmospheres." [Atmosphere of Earth. Wikipedia]
The pie chart example "Atmosphere air composition" was created using the ConceptDraw PRO diagramming and vector drawing software extended with the Pie Charts solution of the Graphs and Charts area in ConceptDraw Solution Park.
 Chemistry
This solution extends ConceptDraw PRO software with samples, template and libraries of vector stencils for drawing the Chemistry Illustrations for science and education.
 Physics
Physics solution extends ConceptDraw PRO software with templates, samples and libraries of vector stencils for drawing the physical illustrations, diagrams and charts.
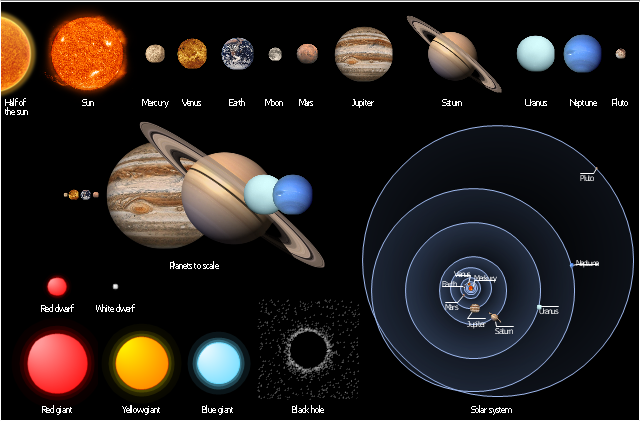
The vector stencils library "Stars and planets" contains 20 clipart images of sun, solar system planets and moon.
"A star is a massive, luminous sphere of plasma held together by its own gravity. The nearest star to Earth is the Sun, which is the source of most of the planet's energy. Some other stars are visible from Earth during the night, appearing as a multitude of fixed luminous points due to their immense distance. Historically, the most prominent stars were grouped into constellations and asterisms, and the brightest stars gained proper names. Extensive catalogues of stars have been assembled by astronomers, which provide standardized star designations." [Star. Wikipedia]
"A planet is an astronomical object orbiting a star or stellar remnant that is massive enough to be rounded by its own gravity, is not massive enough to cause thermonuclear fusion, and has cleared its neighbouring region of planetesimals. ... As scientific knowledge advanced, human perception of the planets changed, incorporating a number of disparate objects. In 2006, the International Astronomical Union (IAU) officially adopted a resolution defining planets within the Solar System. This definition has been both praised and criticized and remains disputed by some scientists because it excludes many objects of planetary mass based on where or what they orbit. Although eight of the planetary bodies discovered before 1950 remain "planets" under the modern definition, some celestial bodies, such as Ceres, Pallas, Juno, Vesta (each an object in the Solar asteroid belt), and Pluto (the first-discovered trans-Neptunian object), that were once considered planets by the scientific community are no longer viewed as such." [Planet. Wikipedia]
The clipart example "Design elements - Stars and planets" was created using the ConceptDraw PRO diagramming and vector drawing software extended with the Astronomy solution from the Science and Education area of ConceptDraw Solution Park.
Physics Diagrams
ConceptDraw PRO diagramming and vector drawing software extended with Physics solution from the Science and Education area is the best for creating: physics diagrams, pictures which describe various physical facts and experiments, illustrations of various electrical, mechanical and optic processes, of any complexity quick and easy.- Diagram Of Gravity
- Simple Flow Chart | Physics Diagrams | Chemistry | Gravity Related ...
- Flow Chart Related To Gravity
- Simple Flow Chart | Chemistry | Physics | Gravity Flow Diagram ...
- Process Flowchart | Gravity filtration of liquids | Drawing Of ...
- Gravity filtration of liquids | Diagram Of Gravity Filtration Techniques
- Gravity filtration of liquids | Circle-Spoke Diagrams | Drawing Of ...
- Gravity Filtration Definition
- What Is Filtration Draw And Label A Diagram Showing Filtration
- Gravity filtration of liquids | Chemistry | Chemistry Symbols and ...
- Gravity filtration of liquids | Chemistry Symbols and Meanings ...
- Chemistry Symbols and Meanings | Chemistry | Chemistry Chart ...
- Atmosphere air composition | Gravity On Different Planets Pie Charts
- Gravity filtration of liquids | Chemistry | Chemistry Symbols and ...
- Gravity filtration of liquids | Laboratory equipment - Vector stencils ...
- Draw The Diagram Of Filtration
- Gravity filtration of liquids | Glassware In Science Labs
- Gravity filtration of liquids | Chemistry Symbols and Meanings ...
- School layout - Vector stencils library | Marketing - Vector stencils ...


