HelpDesk
How to Work with Multiple Licenses in a Cross-Platform Environment

SWOT Analysis

UML Deployment Diagram. Design Elements

Simple Drawing Applications for Mac

The vector stencils library "Management pictograms" contains 72 management pictograms.
Use it to create your management infogram in the ConceptDraw PRO diagramming and vector drawing software.
The flat icons example "Management pictograms - Vector stencils library" is included in the solution "Marketing infographics" from the "Business infographics" area of ConceptDraw Solution Park.
Use it to create your management infogram in the ConceptDraw PRO diagramming and vector drawing software.
The flat icons example "Management pictograms - Vector stencils library" is included in the solution "Marketing infographics" from the "Business infographics" area of ConceptDraw Solution Park.
Accounting management

Activity

Audit management

Board of directors

Budget

Business managemen

Business management tools

Business model

Commanding

Communication

Company

Contract management

Controlling

Coordinating

Core competencies

Corporate strategy

Creativity

Crisis management

Crisis management 2

Decision making

Environmental management

Expenses

External environment

Financial management

Financial management 2

Financial planning

First-level manager

Goal

HR management

Investment management

IT management

Knowledge management

Knowledge management 2

Leadership

Macro environment

Management system

Managerial accounting

Manufacturing management

Market orientation

Marketing management

Marketing strategy

Middle-level manager

Mission

Objectives

Operations management

Organizing

Performance

Performance management

Planning

Policy

PR management

Problem solving

Process management

Product management

Profit

Profit 2

Project management

Quality management

Research and development

Resource management

Resources

Risk management

Sales manegment

Service management

Stakeholder management

Strategic management

Strategic planning

Technology management

Time frame

Time management

Top-level manager

Vision

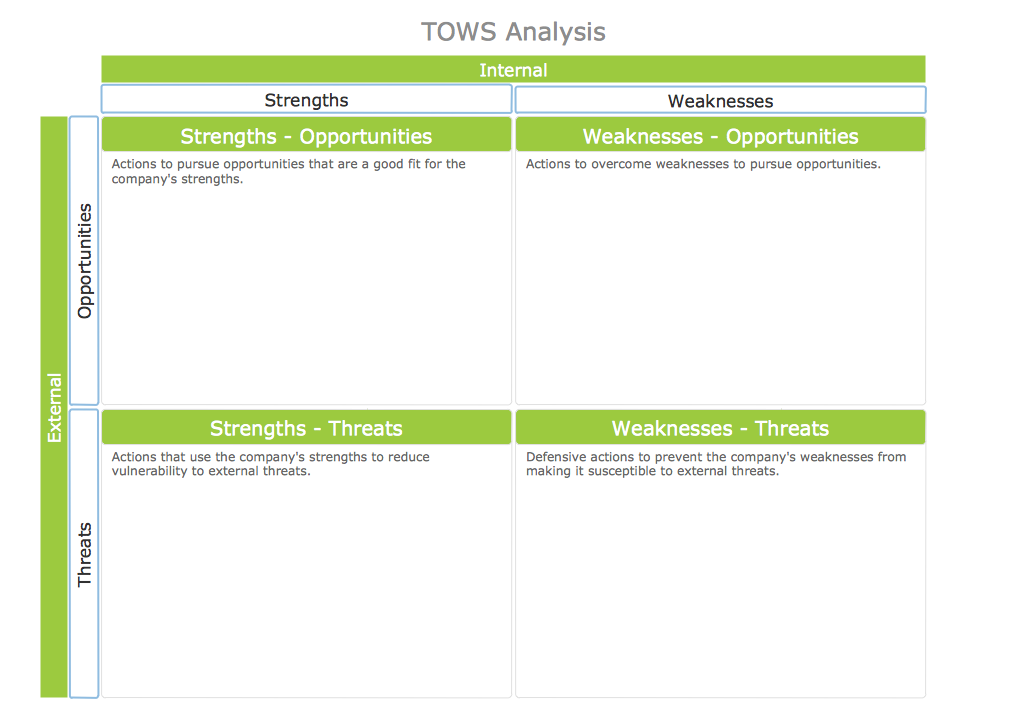
What is SWOT Analysis?

The vector stencils library "Bank UML deployment diagram" contains 10 shapes for drawing UML deployment diagrams.
Use it for object-oriented modeling of your bank information system.
"A deployment diagram in the Unified Modeling Language models the physical deployment of artifacts on nodes. To describe a web site, for example, a deployment diagram would show what hardware components ("nodes") exist (e.g., a web server, an application server, and a database server), what software components ("artifacts") run on each node (e.g., web application, database), and how the different pieces are connected (e.g. JDBC, REST, RMI).
The nodes appear as boxes, and the artifacts allocated to each node appear as rectangles within the boxes. Nodes may have subnodes, which appear as nested boxes. A single node in a deployment diagram may conceptually represent multiple physical nodes, such as a cluster of database servers.
There are two types of Nodes:
1. Device Node.
2. Execution Environment Node.
Device nodes are physical computing resources with processing memory and services to execute software, such as typical computers or mobile phones. An execution environment node (EEN) is a software computing resource that runs within an outer node and which itself provides a service to host and execute other executable software elements." [Deployment diagram. Wikipedia]
This example of UML deployment diagram symbols for the ConceptDraw PRO diagramming and vector drawing software is included in the ATM UML Diagrams solution from the Software Development area of ConceptDraw Solution Park.
UML deployment diagram symbols

TOWS Analysis
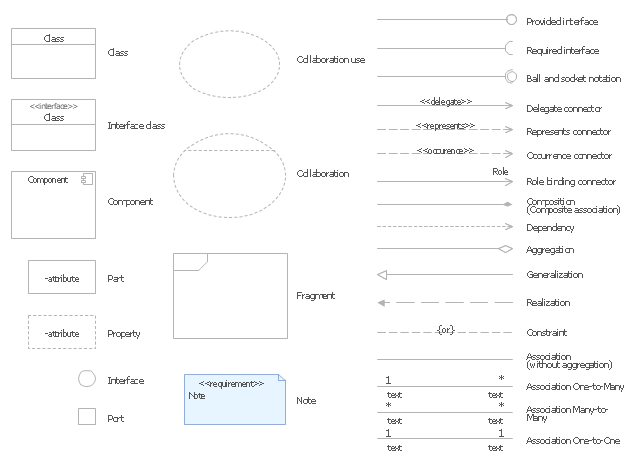
The vector stencils library "UML composite structure diagrams" contains 36 symbols for the ConceptDraw PRO diagramming and vector drawing software.
"The key composite structure entities identified in the UML 2.0 specification are structured classifiers, parts, ports, connectors, and collaborations.
(1) Part : A part represents a role played at runtime by one instance of a classifier or by a collection of instances. The part may only name the role, it may name an abstract superclass, or it may name a specific concrete class. The part can include a multiplicity factor, such as the [0..*] shown for Viewer in the diagram.
(2) Port : A port is an interaction point that can be used to connect structured classifiers with their parts and with the environment. Ports can optionally specify the services they provide and the services they require from other parts of the system. In the diagram, each of the small squares is a port. Each port has a type and is labelled with a name, such as "var", "indVar1", or "view" in the diagram. Ports may contain a multiplicity factor, for example.
Ports can either delegate received requests to internal parts, or they can deliver these directly to the behavior of the structured classifier that the port is contained within. Public ports that are visible in the environment are shown straddling the boundary, while protected ports that are not visible in the environment are shown inside the boundary. All the ports in the diagram are public, except for the view port along the right boundary of FibonacciSystem.
(3) Connector : A connector binds two or more entities together, allowing them to interact at runtime. The connector is shown as a line between some combination of parts, ports and structured classifiers. The diagram shows three connectors between ports, and one connector between a structured classifier and a part.
(4) Collaboration : A collaboration is generally more abstract than a structured classifier. It is shown as a dotted oval containing roles that instances can play in the collaboration.
(5) Structured classifier : A StructuredClassifier represents a class, often an abstract class, whose behavior can be completely or partially described through interactions between parts." [Composite structure diagram. Wikipedia]
The example "Design elements - UML composite structure diagrams" is included in the Rapid UML solution from the Software Development area of ConceptDraw Solution Park.
UML composite structure diagram symbols
"Consumption of energy resources, (e.g. turning on a light) requires resources and has an effect on the environment. Many electric power plants burn coal, oil or natural gas in order to generate electricity for energy needs. While burning these fossil fuels produces a readily available and instantaneous supply of electricity, it also generates air pollutants including carbon dioxide (CO2), sulfur dioxide and trioxide (SOx) and nitrogen oxides (NOx). Carbon dioxide is an important greenhouse gas which is thought to be responsible for some fraction of the rapid increase in global warming seen especially in the temperature records in the 20th century, as compared with tens of thousands of years worth of temperature records which can be read from ice cores taken in Arctic regions. Burning fossil fuels for electricity generation also releases trace metals such as beryllium, cadmium, chromium, copper, manganese, mercury, nickel, and silver into the environment, which also act as pollutants.
The large-scale use of renewable energy technologies would "greatly mitigate or eliminate a wide range of environmental and human health impacts of energy use". Renewable energy technologies include biofuels, solar heating and cooling, hydroelectric power, solar power, and wind power. Energy conservation and the efficient use of energy would also help." [Energy industry. Environmental impact. Wikipedia]
The Energy resources diagram example was created in the ConceptDraw PRO diagramming and vector drawing software using the Manufacturing and Maintenance solution from the Illustration area of ConceptDraw Solution Park.
Infographics

SWOT analysis Software & Template for Macintosh and Windows

Competitor Analysis

Why People Select ConceptDraw MINDMAP

Venn Diagram Examples for Problem Solving. Environmental Social Science. Human Sustainability Confluence

Remote Projects in Corporate Strategy


- Marketing Environment Diagram Chart
- Venn Diagram Examples for Problem Solving. Environmental Social ...
- Business Environment Micro And Macro
- Draw A Chart Of Business Environment
- Competitor Analysis | Diagram Of Business Environment Showing ...
- Macro Micro Environment
- Marketing Environment Diagram
- Marketing Environment Diagrams
- Swot Examples Environment Project
- Venn diagram - Path to sustainable development | Venn Diagram ...
- Marketing Environment Flowchart
- Process Flowchart | Bar Diagram Math | Venn Diagram Examples for ...
- Draw The Diagram Of Market Environment
- Market Environment Charts
- Competitor Analysis | Micro Environment Flow Chart
- Draw The Diagram Of Business Environment
- Diagram Of Micro And Macro Environment
- Marketing Environment Flow Charts
- 5 Forces In The Marketing Environment
- Discuss Market Environment Using Circle Or Matrix Format