Software development with ConceptDraw DIAGRAM
Modern software development requires creation of large amount of graphic documentation, these are the diagrams describing the work of applications in various notations and cuts, also GUI design and documentation on project management. ConceptDraw DIAGRAM technical and business graphics application possesses powerful tools for software development and designing technical documentation for object-oriented projects. Solutions included to the Software Development area of ConceptDraw Solution Park provide the specialists with possibility easily and quickly create graphic documentation. They deliver effective help in drawing thanks to the included package of templates, samples, examples, and libraries with numerous ready-to-use vector objects that allow easily design class hierarchies, object hierarchies, visual object-oriented designs, flowcharts, GUI designs, database designs, visualize the data with use of the most popular notations, including the UML and Booch notations, easy manage the development projects, automate projection and development.Developing Entity Relationship Diagrams
When you need to visually represent the structure of relational database, Entity relationship diagram (ERD) is a type of diagram for that case. Most entity-relationship diagrams can be built with objects from Flowchart solution or ERD Solution which contains inbuilt templates. Follow these steps to create your own custom ERD diagram. Don't be frightened if it looks complex, ConceptDraw DIAGRAM makes it easy to create an ERD, and hundreds of other diagrams, in minutes.Entity Relationship Diagram Examples
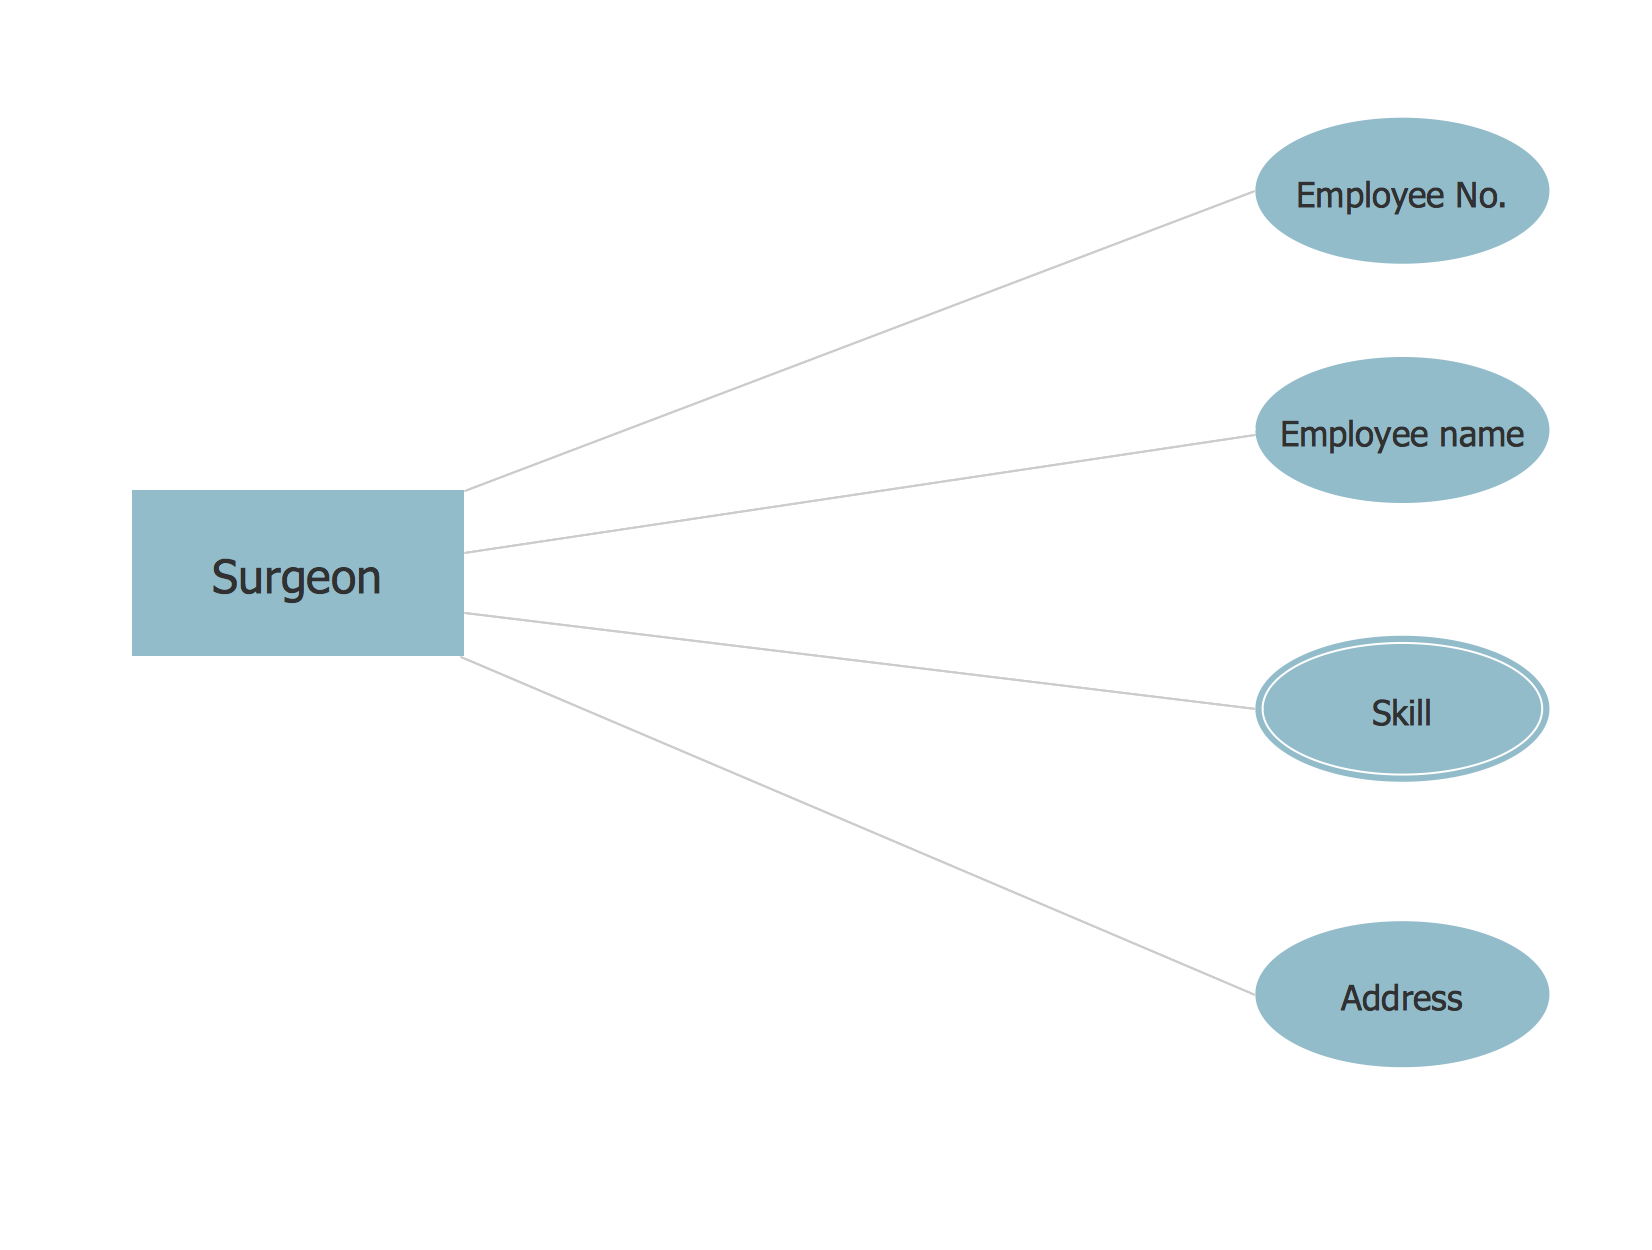
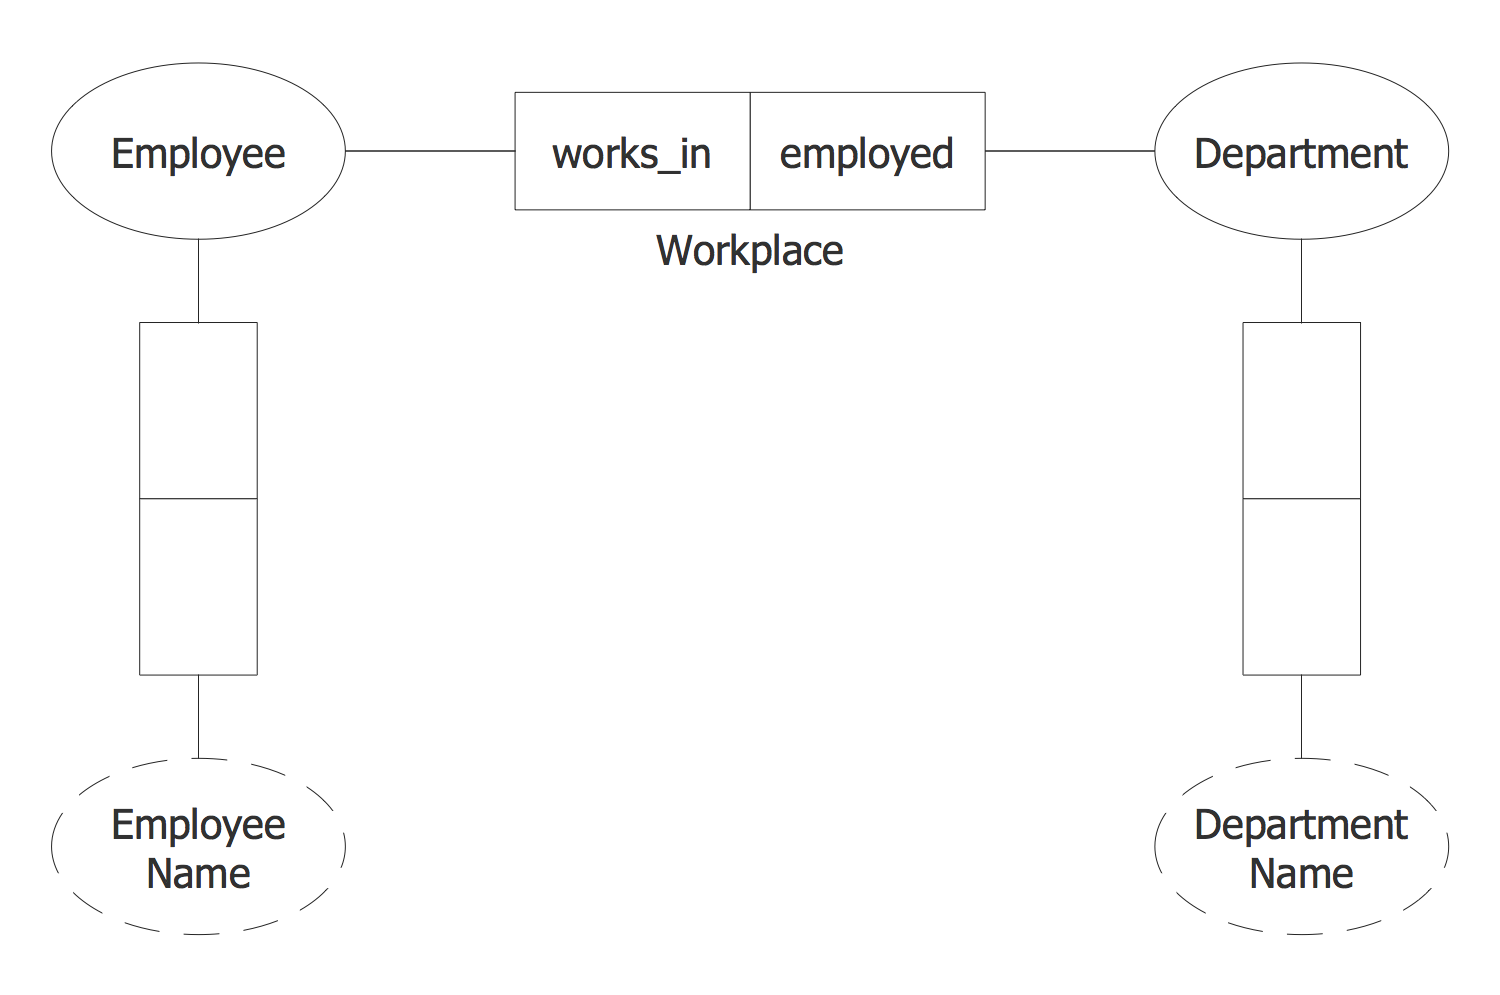
Creation of Entity-Relationship (ER) model is a visual representation the structure of a business database, where data equates to entities or objects, which are linked by defined relationships expressing dependencies and requirements. By the nature, the ER model is an abstract visualization, a first step in design process towards creating a logical and functional database. ConceptDraw DIAGRAM professional software gives the ability to effectively describe a database using the Entity-Relationship model. Included to ConceptDraw Solution Park, the Entity-Relationship Diagram (ERD) solution contains the set of predesigned vector icons advocated by Chen's and Crow’s Foot notations that both can be used for data modeling and describing a database. Entity-Relationship Diagram (ERD) solution includes also helpful templates and incredibly large collection of varied Entity Relationship Diagram examples and samples offered at ConceptDraw STORE. Each of them can be used to develop your own model of a database of arbitrary complexity.
UML Class Diagram Notation
When it comes to system construction, a class diagram is the most widely used diagram. UML Class Diagrams is a type of static structure diagram that is used for general conceptual modeling of the systematics of the application. Such a diagram would illustrate the object-oriented view of a system. The object orientation of a system is indicated by a class diagram. It describes the structure of a system by showing the general issues,classes of a system, attributes, operations, interfaces, inheritance, and the relationships between them.Agile Methodology
Agile methodology is an excellent alternative to waterfall and traditional sequential development. ConceptDraw DIAGRAM software extended with SCRUM Workflow solution is ideal for quick and easy designing various diagrams, charts, mind maps and schematics illustrating software development using Agile methodologies, and in particular Scrum methodology.Software Diagrams
Modern software development begins with designing different software diagrams and also uses a large amount of diagrams in project management and creation graphic documentation. Very popular diagrams that depict a work of applications in various cuts and notations, describe databases and prototype Graphical User Interfaces (GUIs). Software engineering specialists and software designers prefer to use special technical and business graphics tools and applications for easy creation diagrams. One of the most popular is ConceptDraw DIAGRAM diagramming and vector drawing software. ConceptDraw DIAGRAM offers the possibility of drawing with use of wide range of pre-drawn shapes and smart connectors, which allow to focus not on the process of drawing, but on the task's essence. It is a perfect application for design and document development, planning tasks, visualization of data, design the databases, object-oriented design, creation flowcharts of algorithms, modeling business processes, project management, automation of management and development processes, and for many other tasks.DFD Flowchart Symbols
A Data Flow Diagram (DFD) is a graphical technique which allows effectively model and analyze the information processes and systems. The ability to fast and easy create the DFDs is made possible with Data Flow Diagrams solution from the Software Development area of ConceptDraw Solution Park. For designing the Data Flow Diagrams are used simple DFD flowchart symbols which are connected each other by arrows depicting the data flow from one step to another.Data Flow Diagram Model
Data Flow Diagram (DFD) is a technique of graphical structural analysis, describing the sources external to the system, recipients of data, also logical functions, data flows and data stores that are accessed. The DFD's goal is to show how each process converts its inputs into the outputs and to identify relationships between these processes, at this make the system's description clear and understandable at every level of detail. Historically happened that for describing Data Flow Diagrams are used two notations - Yourdon and Gane-Sarson that differ each from other by graphical representation of symbols. The DFD model, like most other structural models is a hierarchical model. Each process can be subjected to decomposition on the structural components, the relationships between which in the same notation can be shown on a separate diagram. Typically, several DFD models are built when modeling the system. ConceptDraw DIAGRAM software enhanced with Data Flow Diagrams solution ideally suits for creation DFD models and professional drawing Data Flow Diagrams.Chen ERD Diagram
The vector stencils library Chen ERD from the solution Entity-Relationship Diagrams (ERD) contains specific symbols of the Chen ERD notation including entity symbols and relationship symbols for ConceptDraw DIAGRAM diagramming and vector drawing software. The Entity-Relationship Diagrams (ERD) solution is contained in the Software Development area of ConceptDraw Solution Park.Mechanical Design Software
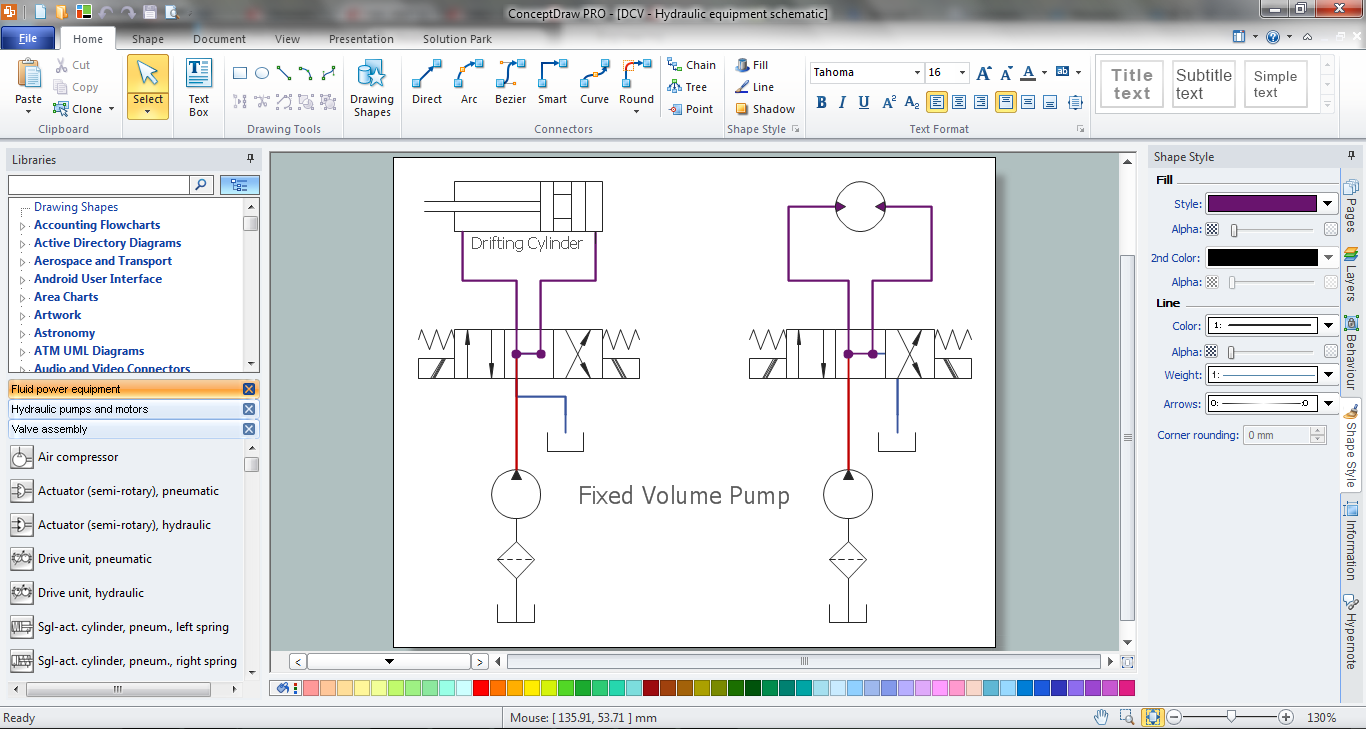
Mechanical design is a labour-intensive process. To facilitate the task of Mechanical Engineering Diagrams creating, ConceptDraw DIAGRAM diagramming and vector drawing software was extended with Mechanical Engineering solution from the Engineering area. Now, ConceptDraw DIAGRAM is a powerful Mechanical Design Software.Workflow Diagram Software Mac
ConceptDraw DIAGRAM software is the best Mac software for drawing workflow diagrams. Its rich set of samples and templates, and specific features to draw diagrams faster make this software as comfortable as possible for drawing workflow diagrams. Use the ConceptDraw DIAGRAM professional Mac OS X software for drawing workflow diagram. The Workflow Diagrams solution with its libraries and templates set make the possibility to identify resources that are required for work goal implementation. The process flow diagram identify flow which occurs as network of process dependencies, organizational decisions and interactions between departments. Usually workflow diagrams show business participants actions that carry product or service to the final destination, the consumer.UML Use Case Diagram Example. Registration System
This sample was created in ConceptDraw DIAGRAM diagramming and vector drawing software using the UML Use Case Diagram library of the Rapid UML Solution from the Software Development area of ConceptDraw Solution Park. This sample shows the types of user’s interactions with the system and is used at the registration and working with the database system.How to Create a Process Flowchart
Use ConceptDraw DIAGRAM diagramming and vector graphics software to visually model your own IT construction processes.System Design
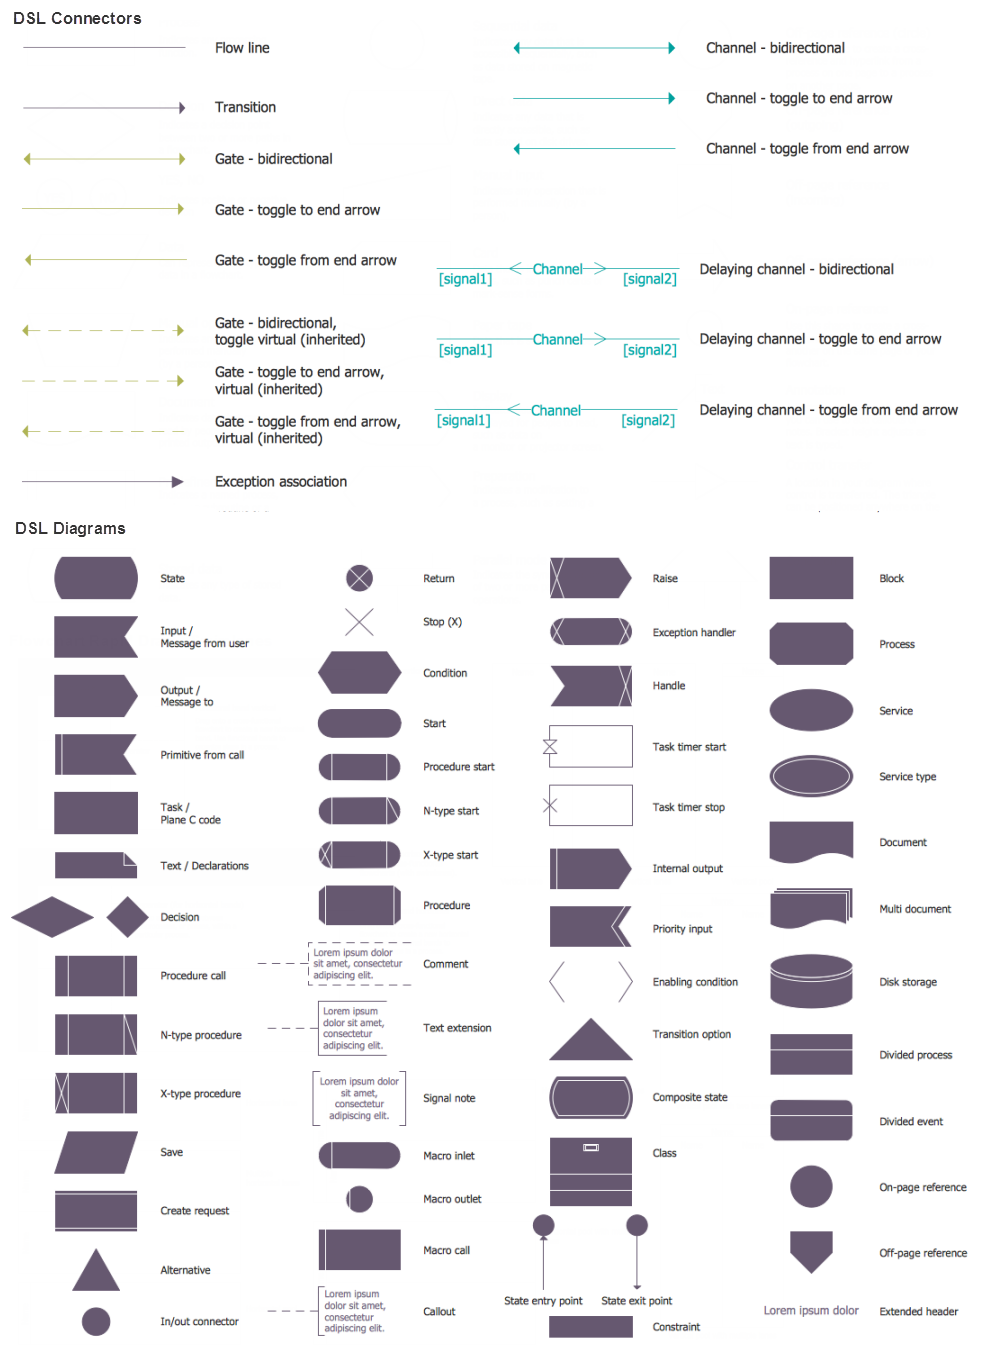
ConceptDraw DIAGRAM diagramming and vector drawing software supplied with Specification and Description Language (SDL) solution from the Engineering area of ConceptDraw Solution Park offers the set of useful tools which make it ideal System Design Software.Software development with ConceptDraw DIAGRAM
Modern software development requires creation of large amount of graphic documentation, these are the diagrams describing the work of applications in various notations and cuts, also GUI design and documentation on project management. ConceptDraw DIAGRAM technical and business graphics application possesses powerful tools for software development and designing technical documentation for object-oriented projects. Solutions included to the Software Development area of ConceptDraw Solution Park provide the specialists with possibility easily and quickly create graphic documentation. They deliver effective help in drawing thanks to the included package of templates, samples, examples, and libraries with numerous ready-to-use vector objects that allow easily design class hierarchies, object hierarchies, visual object-oriented designs, flowcharts, GUI designs, database designs, visualize the data with use of the most popular notations, including the UML and Booch notations, easy manage the development projects, automate projection and development.UML Deployment Diagram
UML Deployment Diagram depicts the physical deployment of artifacts on nodes (nodes are the existing hardware components, artifacts are the software components running on each node); and how the different pieces are connected. Use ConceptDraw DIAGRAM with UML deployment diagram templates, samples and stencil library from Rapid UML solution to model the physical deployment of artifacts on nodes of your software system.
ConceptDraw DIAGRAM The best Business Drawing Software
ConceptDraw DIAGRAM is new software for business and technical drawing. Powerful business drawing tools, extensive libraries with pre-drawn shapes, free samples of business drawings, technical drawings and flowcharts, support of many graphic formats enable users to visually develop their business drawings charts and diagrams in any combination of drawings, diagrams and flow charts.Venn Diagram Examples for Problem Solving
Venn diagrams are illustrations used in the branch of mathematics known as set theory. They show the mathematical or logical relationship between different groups of things (sets). A Venn diagram shows all the possible logical relations between the sets.UML Diagram of Parking
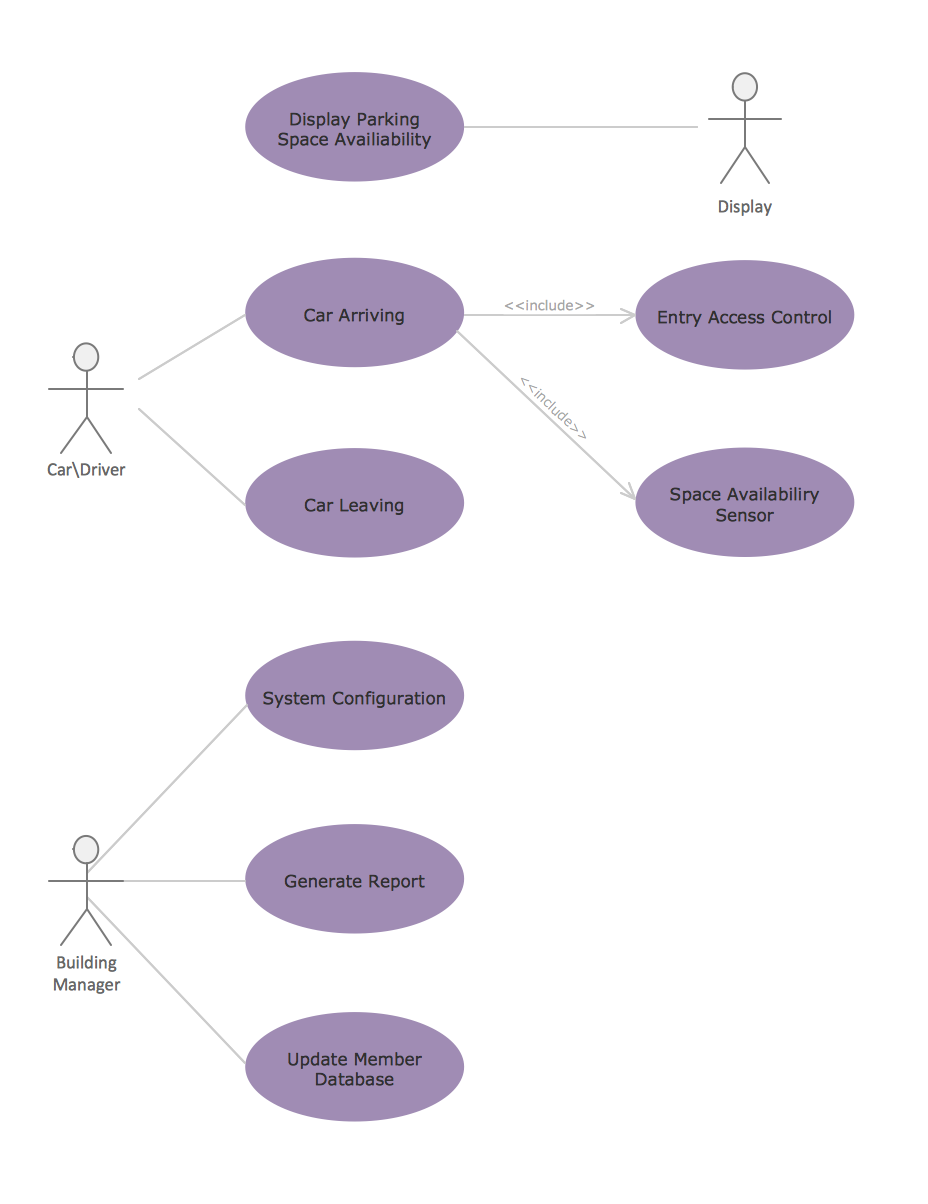
This sample shows the Use Case Diagram of parking lot control system. On this sample you can see use cases represented as ovals and three actors represented as figures of persons that employ these use cases. Associations between actors and use cases are shown as lines. UML Diagram of Parking - This diagram can be used for understanding the process of working the car parking, at the projection and construction the parking by building companies and for automation the existing parkings.ORM
In case some ORM drawing has to be created, such as an ORM diagram, it can become possible once the ConceptDraw DIAGRAM diagramming and drawing software is downloaded from this site being used with another product of CSO — the ConceptDraw STORE. Having the last-mentioned application, you can choose to install the Object-Role Modeling (ORM) solution in order to make any needed ORM diagram by using the pre-made templates of such drawings as well as the vector stencil libraries from the mentioned solution.- Dfd For Online Task Management System
- Entity Relationship Diagram For Product Sales Management
- Erd Of Project Management System
- Entity-Relationship Diagram ( ERD ) | Entities Of Teachers ...
- Er Diagram For Sales Management System
- Erd Project
- Entity-Relationship Diagram ( ERD ) | Audio, Video, Media | PM ...
- Collaboration Diagram For Task Management System
- Online Task Management Data Flow Diagram
- Construct An Er Diagram For An Event Management System
- Dfd Diagram Of The Task Management System
- UML Class Diagram Example for Transport System | Entity ...
- Entity Relationship Diagram Symbols
- What Is Er Diagram Sample Project Management System
- Martin ERD Diagram | ERD Symbols and Meanings | UML Class ...
- Er For Project Management System
- Er Diagram For Human Resource Management System Pdf
- Entity Relationships Diagram For Project Of Disaster Management
- Entity Relationship Diagram Warehouse Management System


