Pyramid Diagram and Pyramid Chart
Pyramid Diagram, Triangle Chart or Triangular Diagram is a convenient and useful type of diagrams, which lets represent the data hierarchical structure and to illustrate the foundation-based relationships between the hierarchy levels. Pyramid Diagrams are used to visualize effectively the hierarchical, as well as proportional and foundation-based relationships, the process steps, the interconnections of organizational layers or topics. ConceptDraw DIAGRAM software enhanced with Pyramid Diagrams solution from Marketing area of ConceptDraw Solution Park is a powerful business charting software, that includes all required tools for designing the multilevel Pyramid Diagrams as quickly as possible. The build-in vector stencils and templates are the great aid for designers, a variety of examples and samples is a good base and source of inspiration. Use attractive and vivid 2D and 3D Pyramid Diagrams and Triangle Charts designed in ConceptDraw DIAGRAM to illustrate your documents, presentations, infographics, articles, reports, websites, etc.Circular Flow Diagram Template
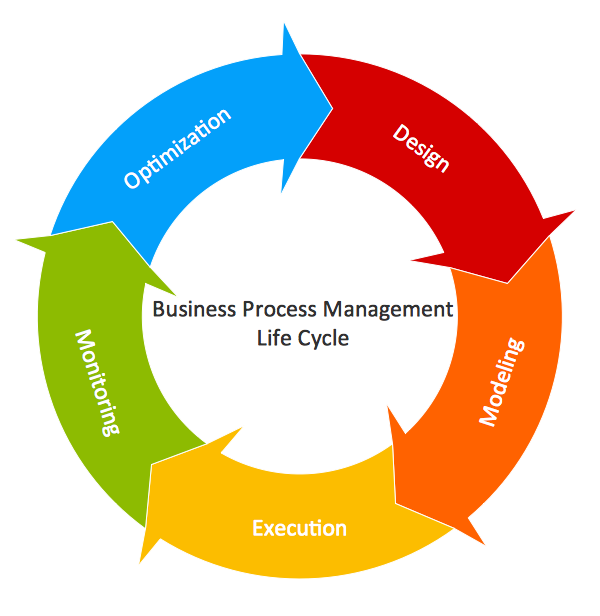
You need to draw the Circular Arrows Diagram, Segmented Diagram or Circular Flow Diagram? Any of these diagrams can be fast and easy designed in ConceptDraw DIAGRAM.ConceptDraw DIAGRAM diagramming and vector drawing software offers the Circular Arrows Diagrams Solution from the "Diagrams" Area with extensive drawing tools, predesigned samples and circular flow diagram template. Use of ready template is the easiest way of drawing.HelpDesk
How to Draw a Pie Chart
A pie chart represents data, in a clear and easy to read around (pie) form. A circular pie chart is divided into sections (slice). Each "slice" depicts the It reflects the proportion of each component in the whole "pie". This type of chart is most often used for the visualization of statistical data. That is why pie charts are widely used in marketing. As the pie charts show proportional parts of a whole, they are good for various visual comparisons. For example, it is difficult to imagine a more intuitive way to show segmentation and market share. ConceptDraw DIAGRAM allows you to draw a simple and clear Pie Chart using the Pie Charts solution.Circular Arrows
The Circular Arrows Diagrams are very popular in management and marketing. They are the useful way to visualize a sequence of steps, tasks, or events as a circular flow. But how design the Circular Arrows Diagram quick and easy? You will need a powerful software. ConceptDraw DIAGRAM diagramming and vector drawing software is exactly what you need. Extended with Circular Arrows Diagrams solution from the "Diagrams" Area, ConceptDraw DIAGRAM is the best for drawing the Circular Arrows Diagrams.DFD Library — Design elements
Data Flow Diagrams (DFD) solution from the Software Development area of ConceptDraw Solution Park provides plenty of predesigned templates, samples and DFD vector design elements proposed by three DFD libraries. These DFD library objects are designed to help you effectively model the data flows and functional requirements for the business processes or systems, to design the Process-oriented models or Data-oriented models, Data flowcharts and Data process diagrams, Structured analysis diagrams and Information flow diagrams. There are two different notations used to draw the Data Flow Diagrams (Yourdon & Coad and Gane & Sarson). These notations define the different visual representations for the processes, data stores, data flows, and external entities. ConceptDraw DIAGRAM software provides you with possibility of designing professional-looking Data Flow Diagrams, DFD Models, Data Flow Process Diagrams using any of these notations. Simply drag the predesigned DFD flowchart symbols from the appropriate library and connect by arrows depicting the data flow from one step to another.Pyramid Charts
ConceptDraw DIAGRAM extended with Pyramid Diagrams Solution from the Marketing Area of ConceptDraw Solution Park is a powerful Pyramid Charts making software. A Pyramid Chart has the form of triangle and hierarchically structures, organizes and help to analyze the information, data or ideas. Triangle is divided on the sections that usually have different widths. The width indicates the level of hierarchy among the topics.
 Circular Arrows Diagrams
Circular Arrows Diagrams solution extends ConceptDraw DIAGRAM with extensive drawing tools, predesigned samples, Circular flow diagram template for quick start, and a library of ready circular arrow vector stencils for drawing Circular Arrow Diagrams, Segmented Cycle Diagrams, and Circular Flow Diagrams. The elements in this solution help managers, analysts, business advisers, marketing experts, scientists, lecturers, and other knowledge workers in their daily work.
Circular Arrow
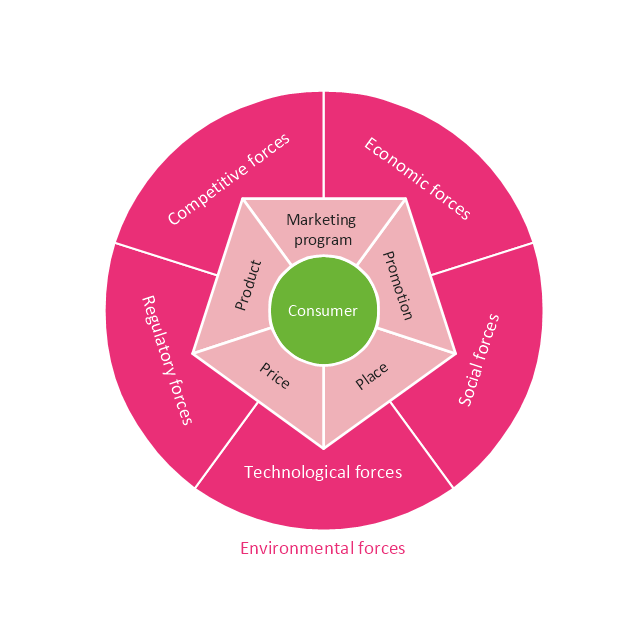
ConceptDraw DIAGRAM diagramming and vector drawing software extended with Circular Arrows Diagrams solution from the "Diagrams" Area is a powerful software that will help you design professional looking Circular Arrow Diagrams.This circular diagram sample was created on the base of the figure from the Florence-Darlington Technical College website. [bus.fdtc.edu/ sbed/ core/ core7.html]
"A marketing plan may be part of an overall business plan. Solid marketing strategy is the foundation of a well-written marketing plan. While a marketing plan contains a list of actions, a marketing plan without a sound strategic foundation is of little use. ...
A marketing plan for a small business typically includes Small Business Administration Description of competitors, including the level of demand for the product or service and the strengths and weaknesses of competitors:
(1) Description of the product or service, including special features.
(2) Marketing budget, including the advertising and promotional plan.
(3) Description of the business location, including advantages and disadvantages for marketing.
(4) Pricing strategy.
(5) Market Segmentation." [Marketing plan. Wikipedia]
The circular diagram example "Marketing plan" was created using the ConceptDraw PRO diagramming and vector drawing software extended with the Target and Circular Diagrams solution from the Marketing area of ConceptDraw Solution Park.
www.conceptdraw.com/ solution-park/ marketing-target-and-circular-diagrams
The vector stencils library "Marketing" contains 30 marketing icons.
Use it to design your business and finance illustrations and infographics with ConceptDraw PRO diagramming and vector drawing software.
The vector stencils library "Marketing" is included in the Business and Finance solution from the Illustration area of ConceptDraw Solution Park.
Use it to design your business and finance illustrations and infographics with ConceptDraw PRO diagramming and vector drawing software.
The vector stencils library "Marketing" is included in the Business and Finance solution from the Illustration area of ConceptDraw Solution Park.
 Graphic User Interface
Graphic User Interface solution extends ConceptDraw DIAGRAM software with templates, samples and libraries of vector stencils for design of the GUI prototypes and diagrams for Windows, Mac OS and iOS software.
- Marketing Diagrams | Marketing | Six Markets Model Chart | Marketing
- Step Area Graph | Basic Diagramming | Draw Flowcharts with ...
- Circular Arrows Diagrams | Drawing Illustration | BPR Diagram ...
- Sample Lifecycle Diagram In Visio
- Circular Arrows Diagrams | Create Response Charts | Gant Chart in ...
- Matrices | Ansoff's product / market matrix | SWOT matrix template ...
- The Sreps Involved In Product Cycle With Block Diagram In Cim
- Competitive strategy matrix - Template | SWOT Analysis Solution ...
- Target and Circular Diagrams | How to Draw a Circular Arrows ...
- Product life cycle process - Flowchart | Draw Flowcharts with ...
- Product life cycle process - Flowchart | Sales Process Flowchart ...
- Create Product Life Cycle Word
- Product life cycle process - Flowchart
- Circular Arrows Diagrams | How to Draw a Circular Arrows Diagram ...
- Draw Flowcharts with ConceptDraw | Circular Arrows Diagrams ...
- Draw Flowcharts with ConceptDraw | Basic Diagramming | Use the ...
- Draw Flowcharts with ConceptDraw | Marketing Diagrams | Flow ...
- Draw Flowcharts with ConceptDraw | Product life cycle process ...
- Sales Process Flowchart. Flowchart Examples | Sales Process ...
- Online Software To Draw Segmented Cycle Diagram


