"Causes in the diagram are often categorized, such as to the 6 M's ...
The 6 Ms (used in manufacturing industry):
(1) Machine (technology);
(2) Method (process);
(3) Material (Includes Raw Material, Consumables and Information.);
(4) Man Power (physical work)/ Mind Power (brain work): Kaizens, Suggestions;
(5) Measurement (Inspection);
(6) Milieu/ Mother Nature (Environment).
The original 6Ms used by the Toyota Production System have been expanded by some to include the following and are referred to as the 8Ms. However, this is not globally recognized. It has been suggested to return to the roots of the tools and to keep the teaching simple while recognizing the original intent; most programs do not address the 8Ms.
(7) Management/ Money Power;
(8) Maintenance." [Ishikawa diagram. Wikipedia]
This 8Ms Ishikawa diagram (manufacturing cause and effect diagram) template is included in the Fishbone Diagram solution from the Management area of ConceptDraw Solution Park.
"Process Decision Program Chart (PDPC).
A useful way of planning is to break down tasks into a hierarchy, using a tree diagram. The PDPC extends the tree diagram a couple of levels to identify risks and countermeasures for the bottom level tasks. Different shaped boxes are used to highlight risks and identify possible countermeasures (often shown as 'clouds' to indicate their uncertain nature). The PDPC is similar to the Failure Modes and Effects Analysis (FMEA) in that both identify risks, consequences of failure, and contingency actions; the FMEA also rates relative risk levels for each potential failure point." [Seven Management and Planning Tools. Wikipedia]
The Risk diagram (process decision program chart, PDPC) determines the risks when corrective action is not performed correctly. Also, it helps develop descriptions for preventive actions at the level of execution.
The Risk diagram (PDPC) template for the ConceptDraw PRO diagramming and vector drawing software is included in the solution "Seven Management and Planning Tools" from the Management area of ConceptDraw Solution Park.
HelpDesk
How to Create a Sales Dashboard Using ConceptDraw PRO
Visual dashboard is a valuable tool for any sales team. Sales dashboard allows you to view and monitor sales indicators that are important for manager and sales staff . It helps to use the timely and reliable information to improve the quality of sales performance and increase sales revenues. ConceptDraw Sales Dashboard solution is a tool for both: sales manager and sales team. It provides the visualization of key performance indicators that are critical to the entire sales organization. The custom sales dashboard displays the real-time information on sales performance KPIs with the help of intuitive and easy-to-understand diagrams and charts.
HelpDesk
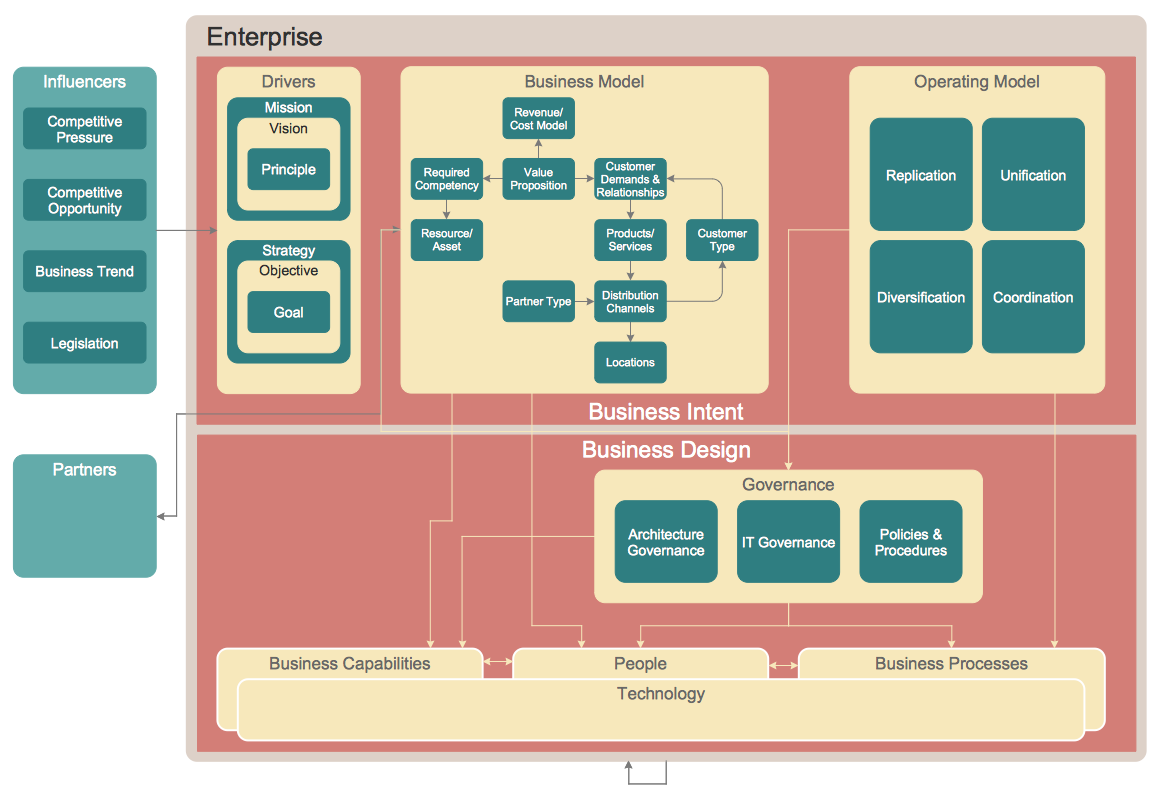
How to Create an Enterprise Architecture Diagram in ConceptDraw PRO
An Enterprise Architecture (EA) diagram is used to display the structure and operations of an organization.It is used to analyze and document an organization and its business functions, along with the applications and systems on which they are implemented. The aim of an enterprise architecture diagram is to determine how an organization can effectively achieve its current and future objectives. The Enterprise Architecture often uses diagrams to support the decision-making process. ConceptDraw PRO allows you to design Enterprise Architecture diagrams of any complexity.HelpDesk
How to Input Data from MS Excel Into a Mind Map
Many people apply Excel documents to store data in the form of hierarchical lists. With ConceptDraw MINDMAP you can easily turn the linear structure of an Excel table in a radial structure of mind map ConceptDraw MINDMAP will create a mind map file (CDMZ) from your Excel (XLS) file. If you keep your information in the Microsoft Excel files, you can import them into ConceptDraw MINDMAP, converting the columns and rows to a hierarchical structured mind map. If you have multiple individual sheets in your Excel workbook, ConceptDraw MINDMAP will turn them into a single multi-page mind map. ConceptDraw MINDMAP lets you import an entire Microsoft® Excel file as well as insert data from the selected cells.HelpDesk
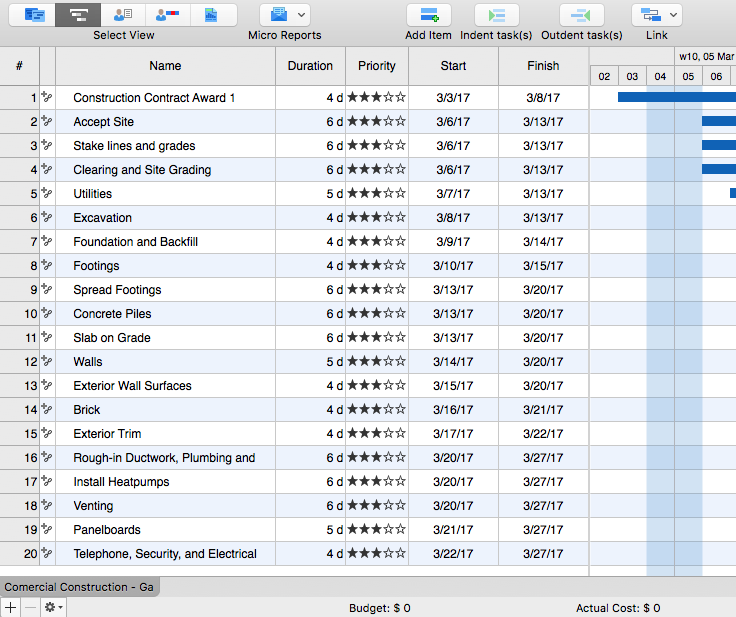
How to Import Project Data From MS Excel File
You can import information into the project from MS Excel workbook using the entered fields - fields in which you can enter or edit information as opposed to calculated fields.- Decision Tree Templates Excel
- Excel Chart Templates
- Value Chain Template Excel
- Manufacturing 8 Ms fishbone diagram - Template | Cause and Effect ...
- Excel Product Comparison Template
- Project Chart Template Excel
- Competitor Analysis | SWOT analysis matrix diagram templates ...
- Marketing Blocking Chart Template Excel
- Excel Fishbone Diagram Template Free
- Context Diagram Template | Fault Tree Analysis Diagrams ...
- Aon Diagram Excel Template
- Driver Diagram Templates Excel
- Context Diagram Template | Process Flowchart | Purchase Process ...
- Comparison Chart Template Excel
- Workflow Diagram Template | Create Workflow Diagram | Cross ...
- Context Diagram Template | Risk diagram (PDPC) - Template ...
- Decision Tree Template Excel
- Rack Diagram Template Excel
- Parking Lot Diagram Excel Template

---template.png--diagram-flowchart-example.png)


