HelpDesk
ConceptDraw PROJECT: Filter Tasks and Resources on Mac
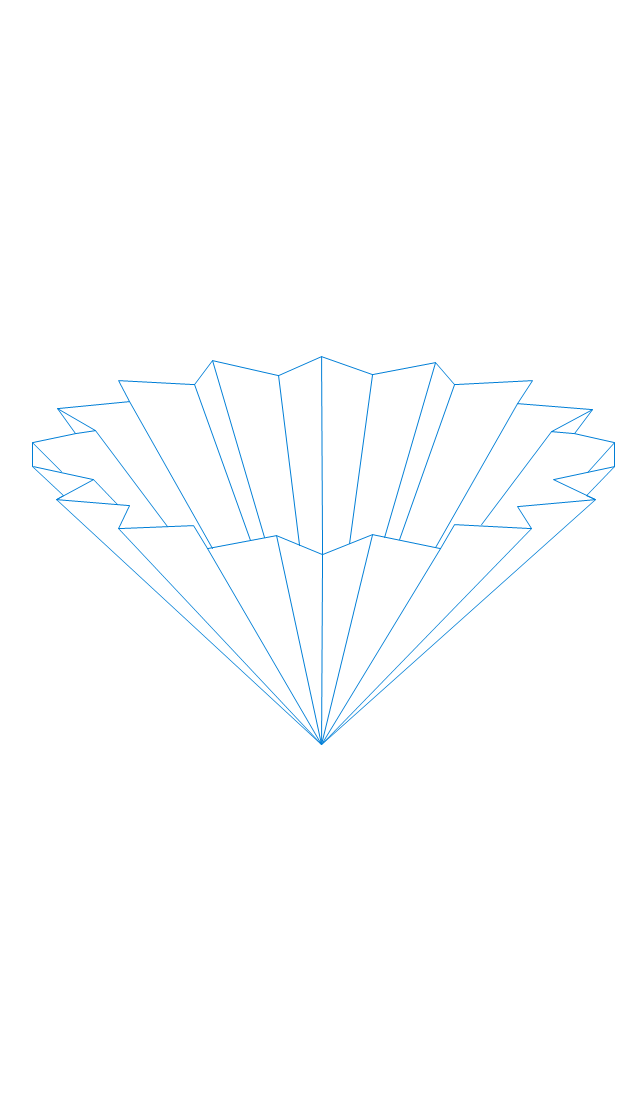
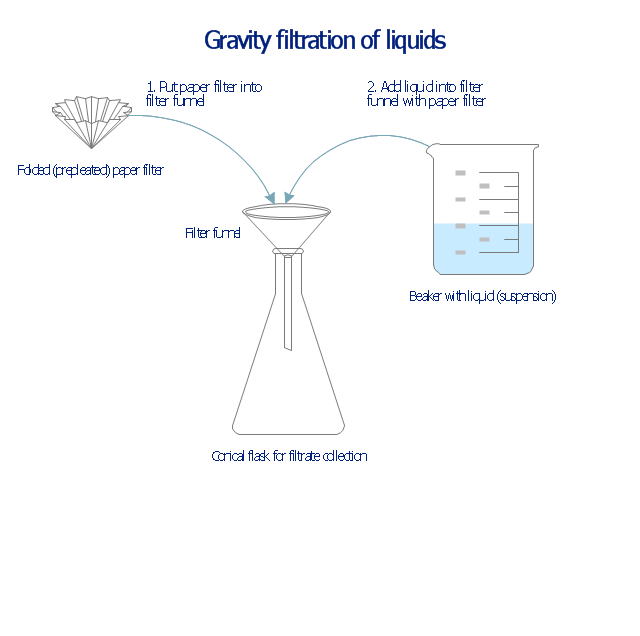
Filtering project data offers two important possibilities: to find out a required task quickly and to group tasks by various parameters to aid gathering information regarding the project status. Filtering allows you to focus on working with specific tasks, projects or resources. With ConceptDraw Project, you can filter project data on Mac OS X so that you only see the information that’s most important to you.This chemical laboratory technique drawing depict gravity filtration of liquid through prepleated paper filter step-by-step.
1. Put folded filter paper cone into glass filter funnel inserted into neck of conical (Erlenmeyer) flask.
2. Add liquid suspension from the glass beaker with a spout into the funnel with paper filter.
3. Collect filtrate in the conical flask and solid on the paper filter in the funnel.
"Filtration is commonly the mechanical or physical operation which is used for the separation of solids from fluids (liquids or gases) by interposing a medium through which only the fluid can pass. The fluid that pass through is called a filtrate. Oversize solids in the fluid are retained, but the separation is not complete; solids will be contaminated with some fluid and filtrate will contain fine particles (depending on the pore size and filter thickness)." [Filtration. Wikipedia]
"Filter paper is a semi-permeable paper barrier placed perpendicular to a liquid or air flow. It is used to separate fine solids from liquids or air." [Filter paper. Wikipedia]
The chemical lab drawing example "Gravity filtration of liquids" was created using the ConceptDraw PRO diagramming and vector drawing software extended with the Chemistry solution from the Science and Education area of ConceptDraw Solution Park.
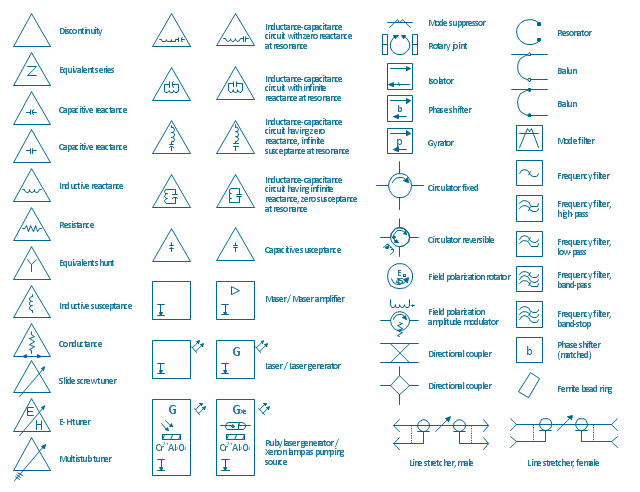
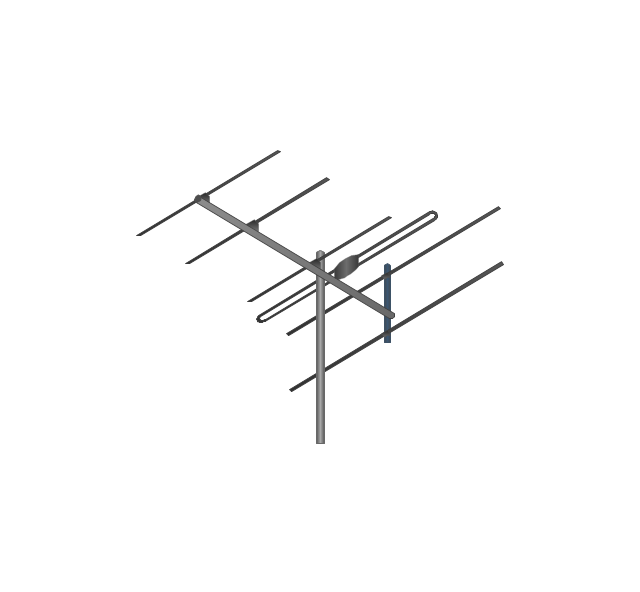
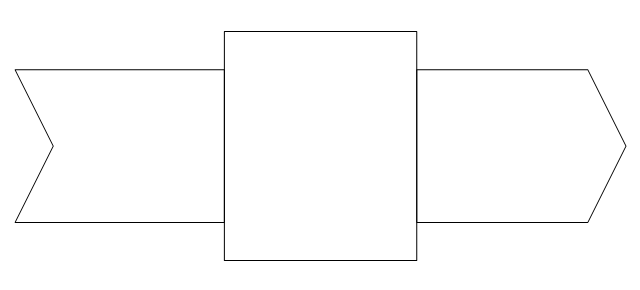
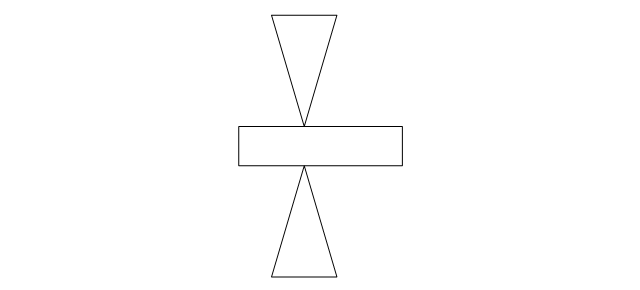
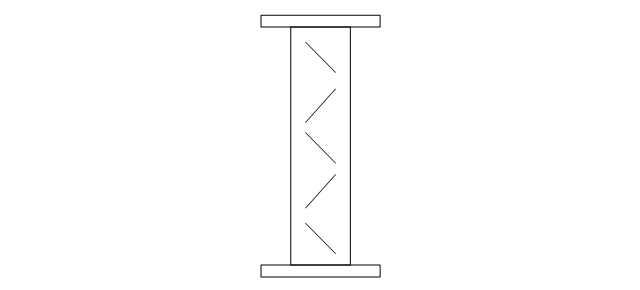
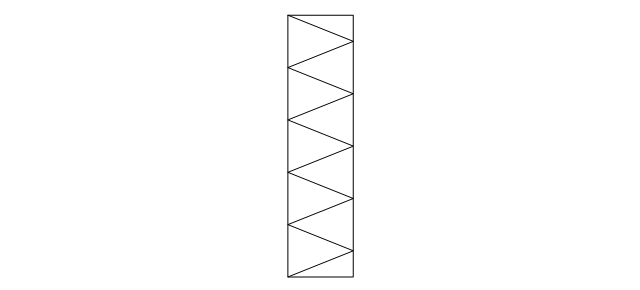
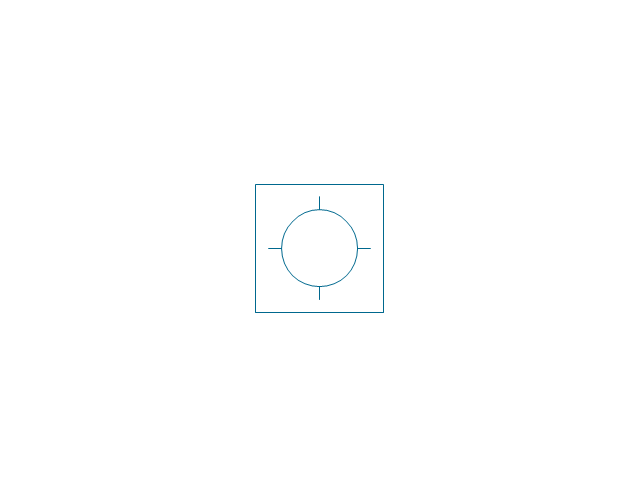
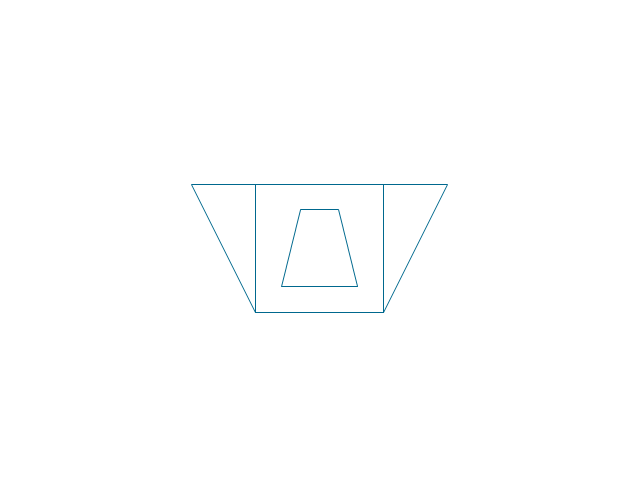
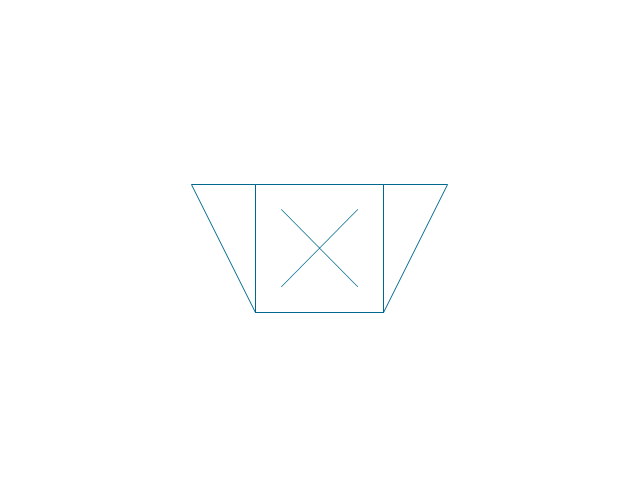
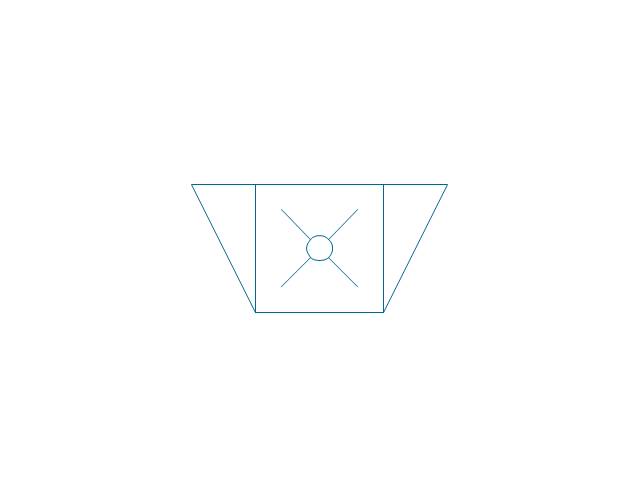
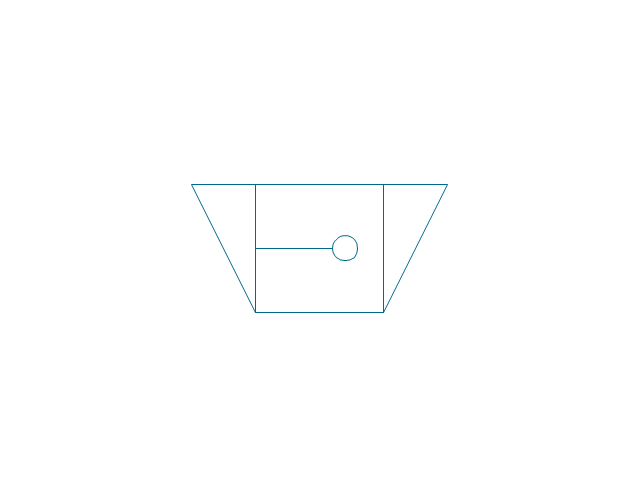
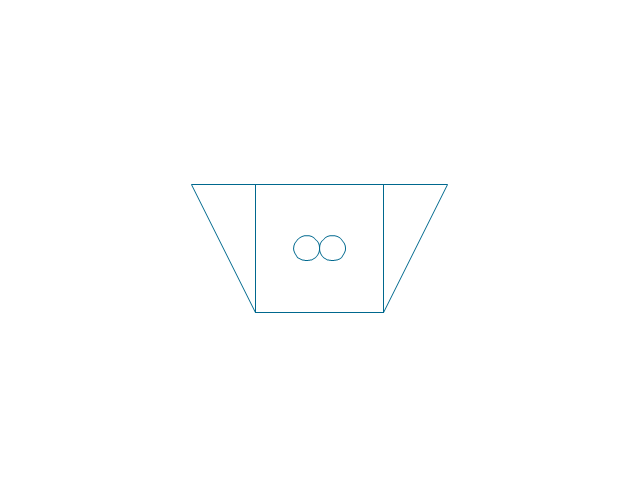
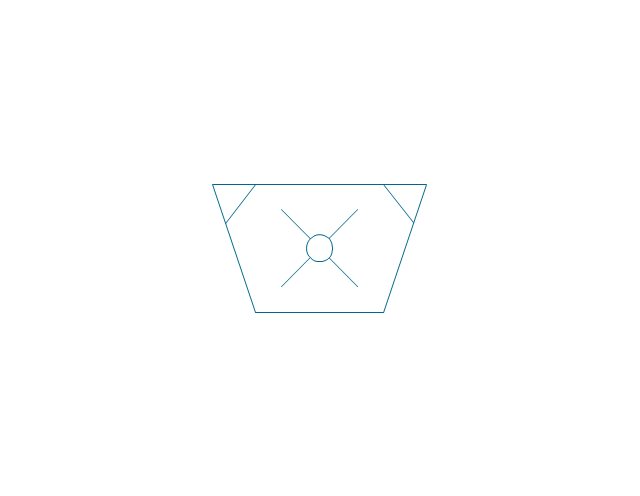
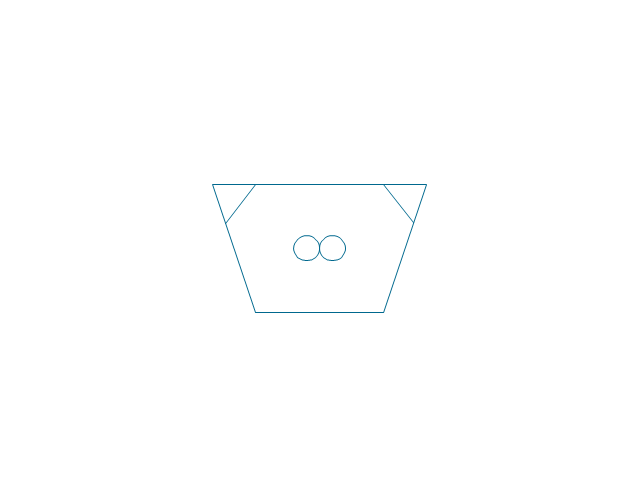
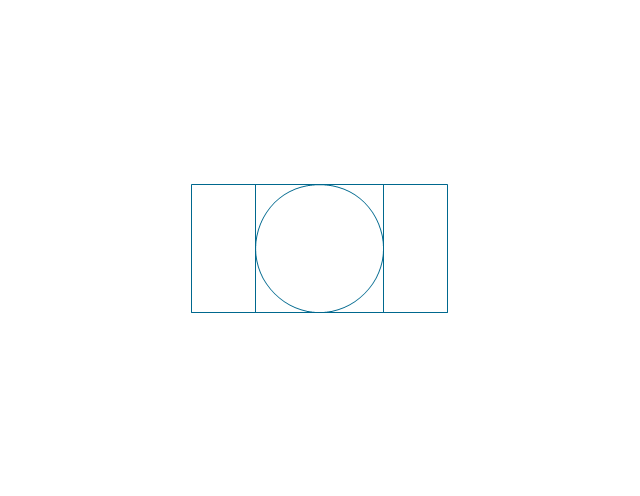
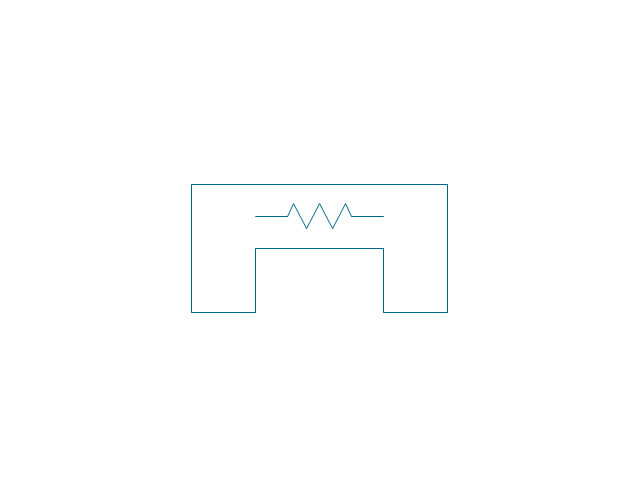
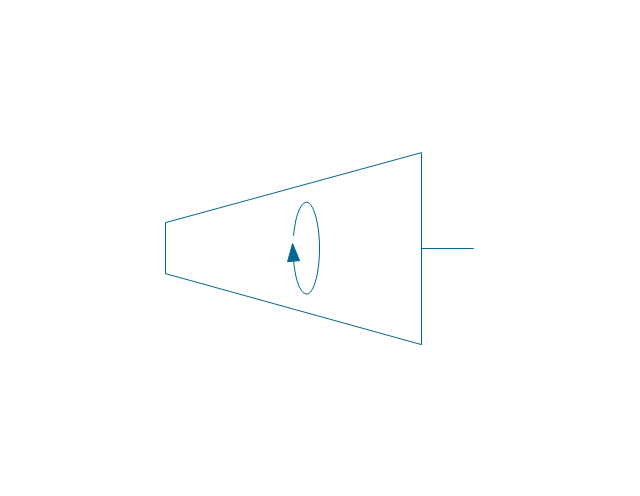
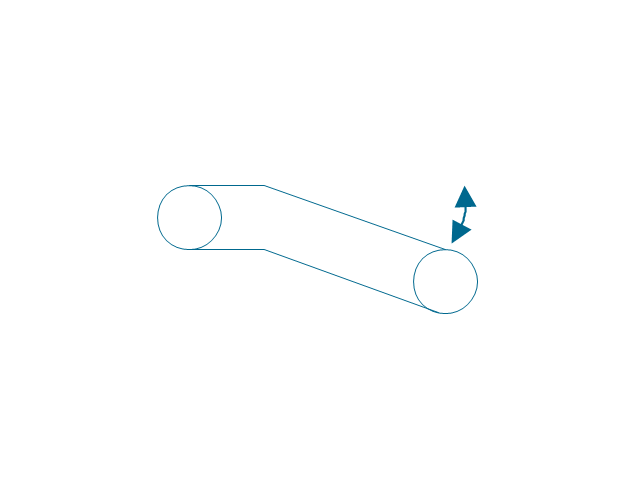
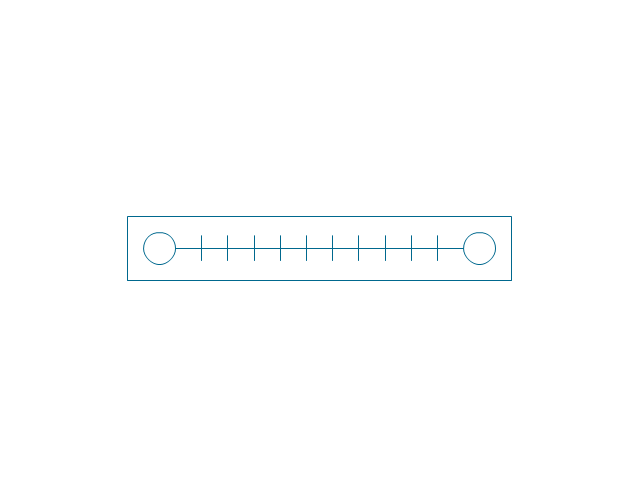
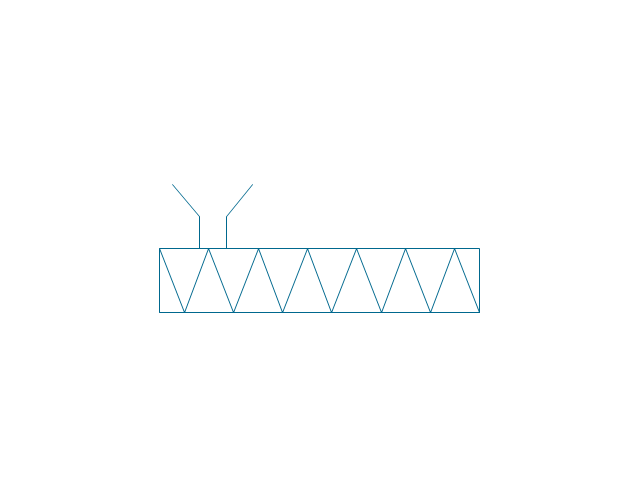
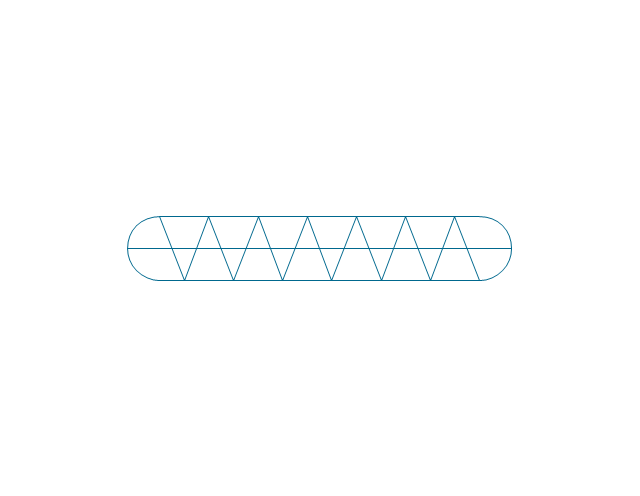
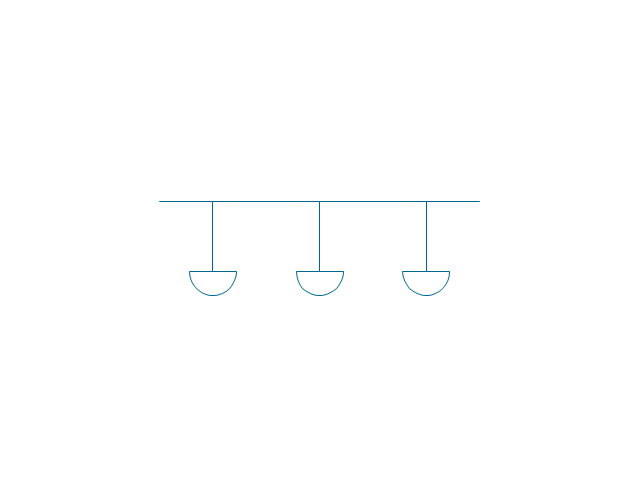
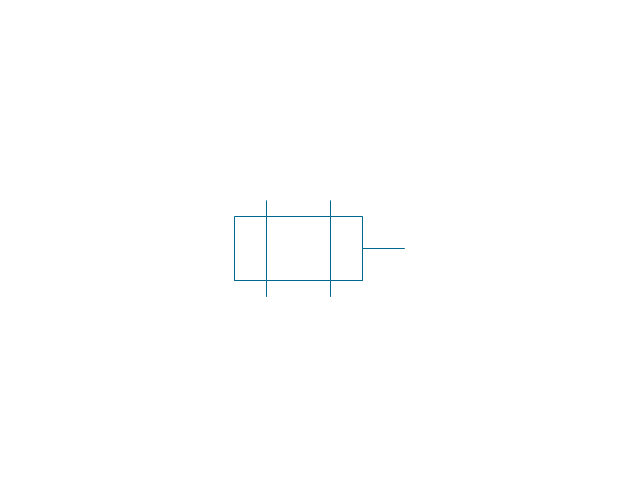
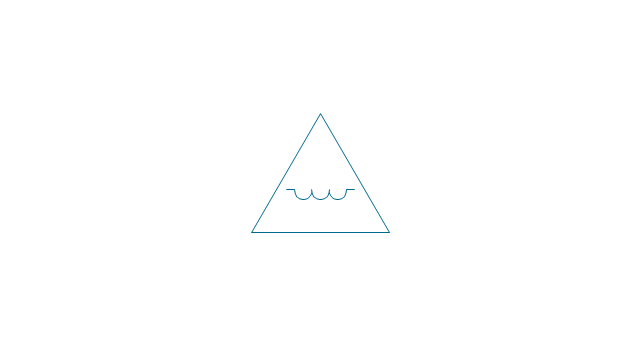
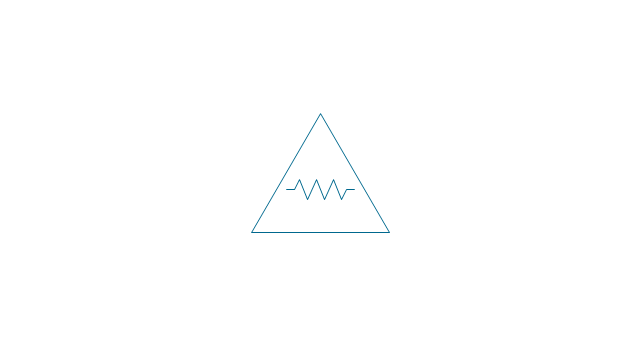
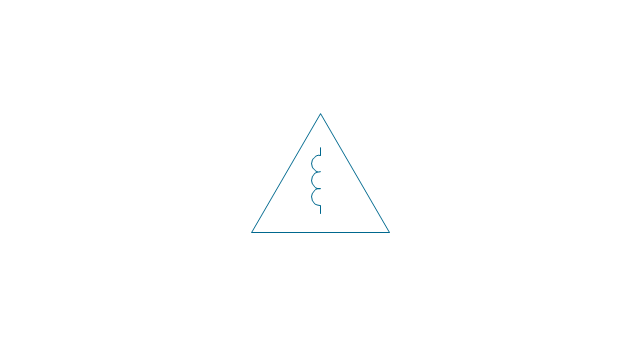
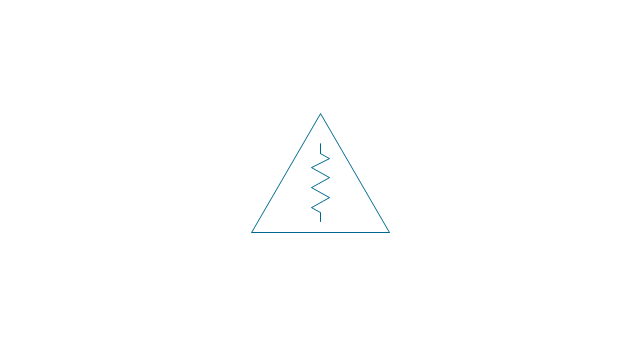
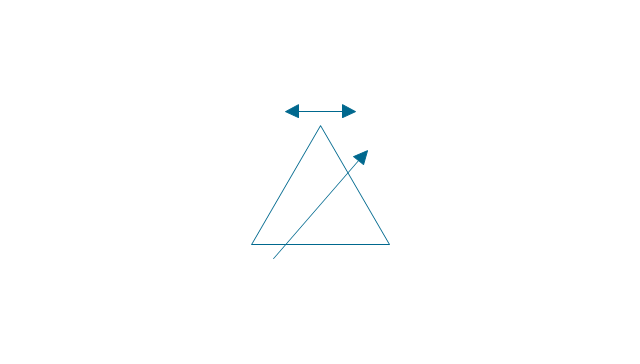
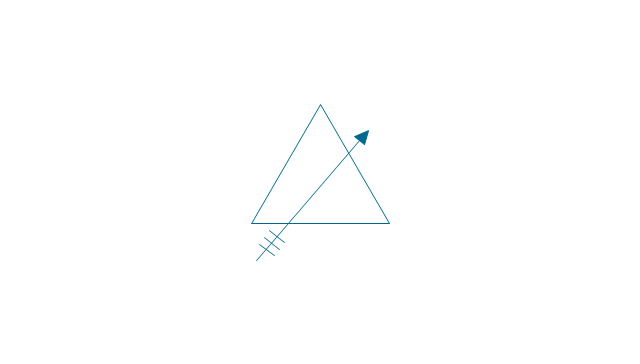
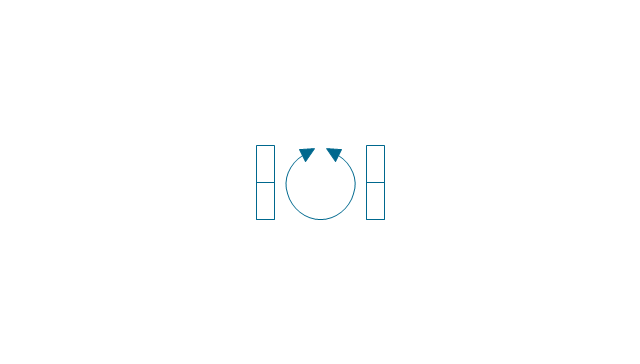
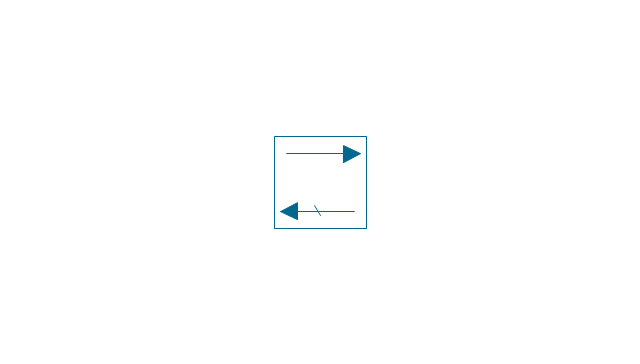
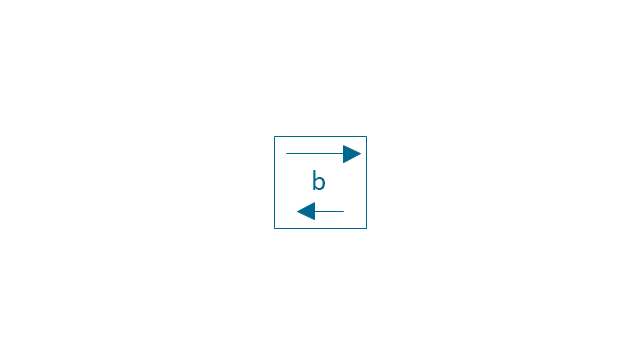
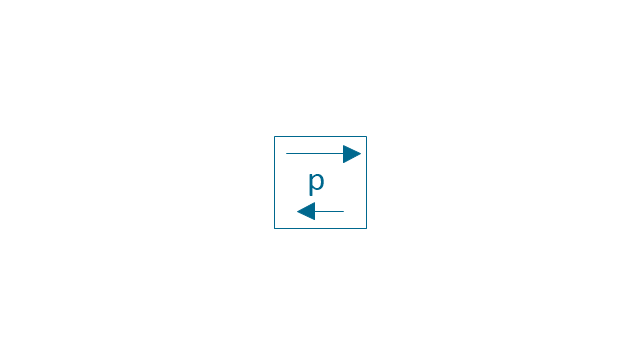
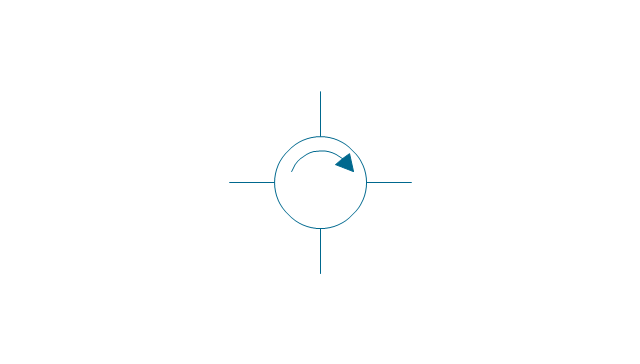
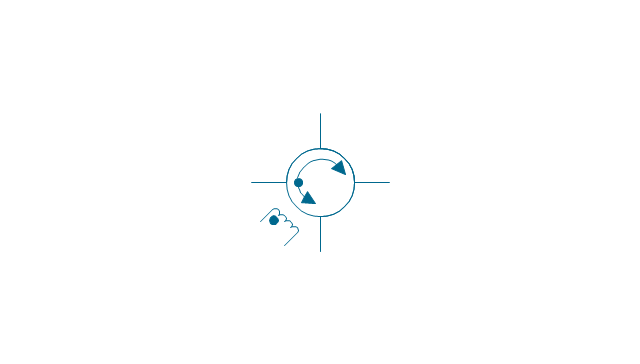
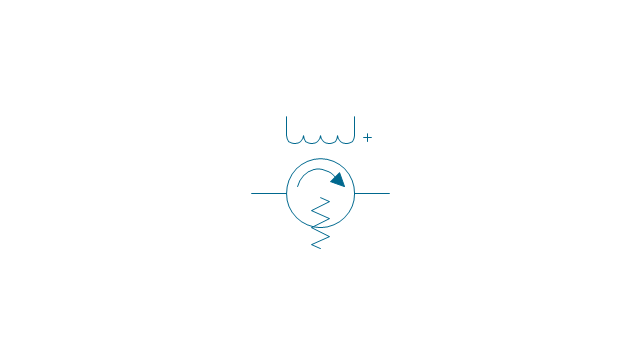
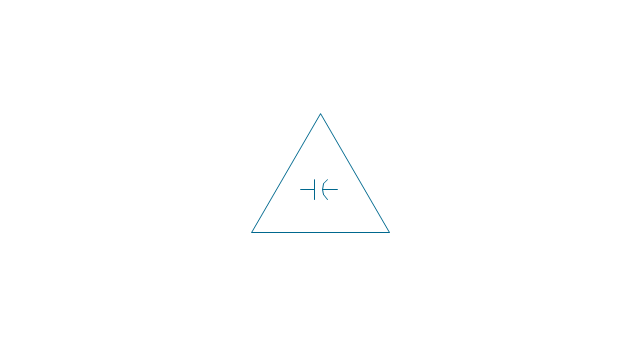
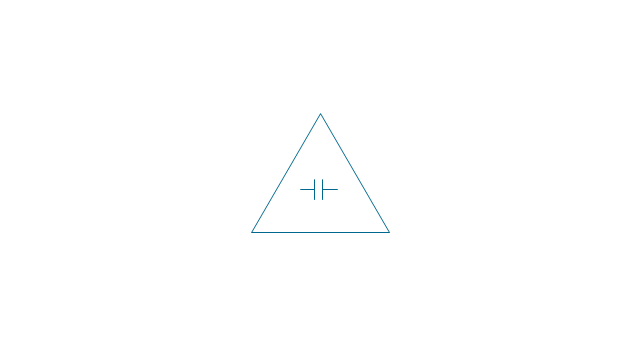
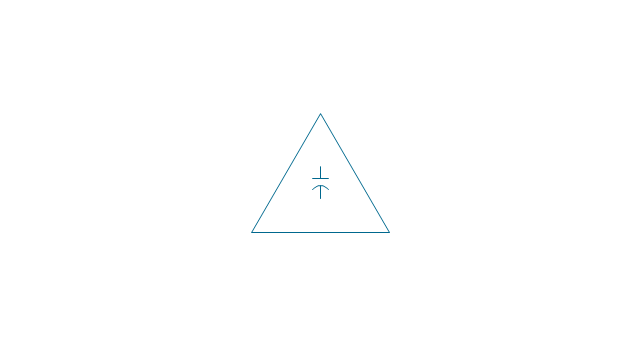
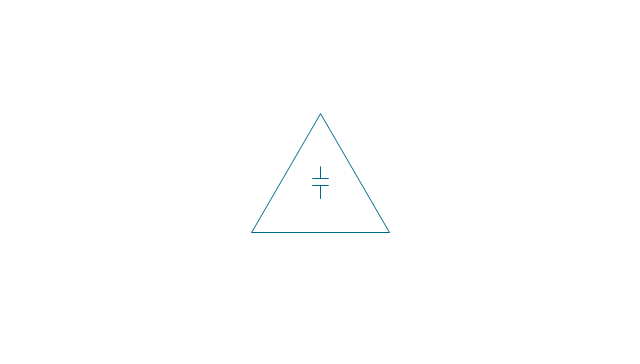
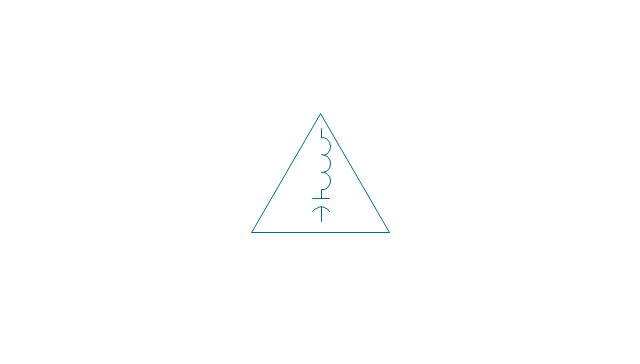
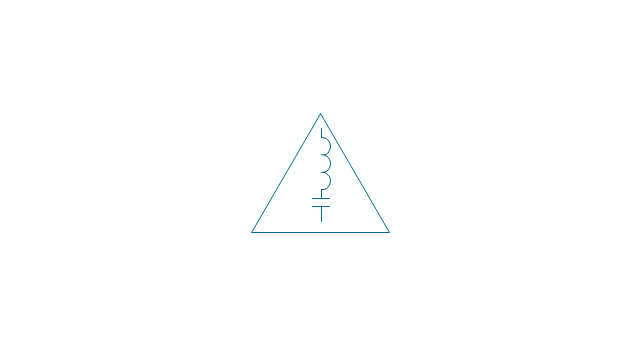
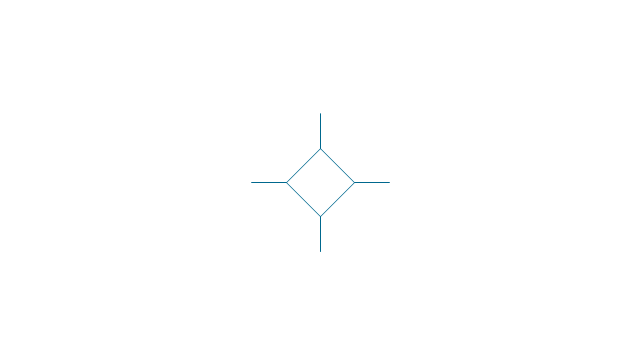
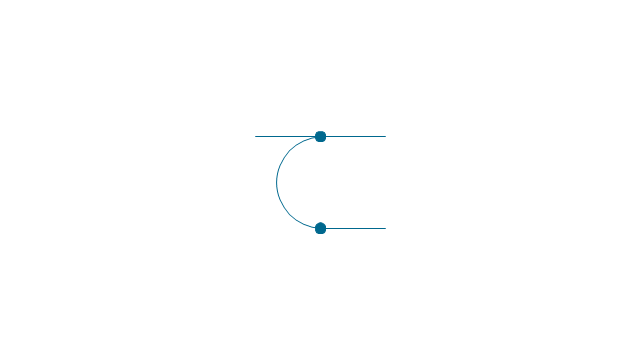
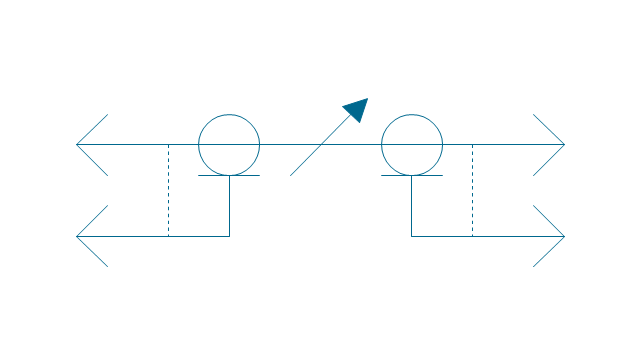
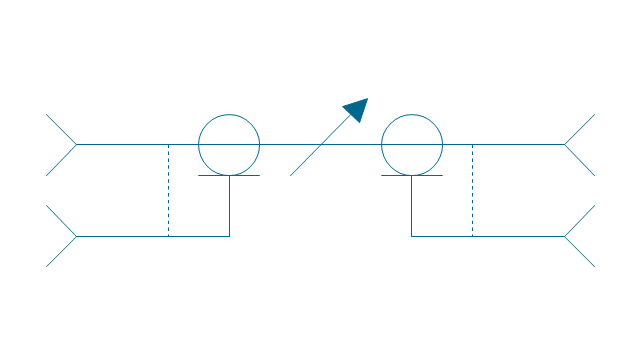
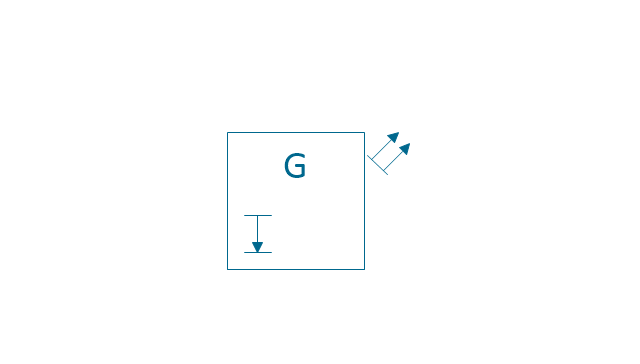
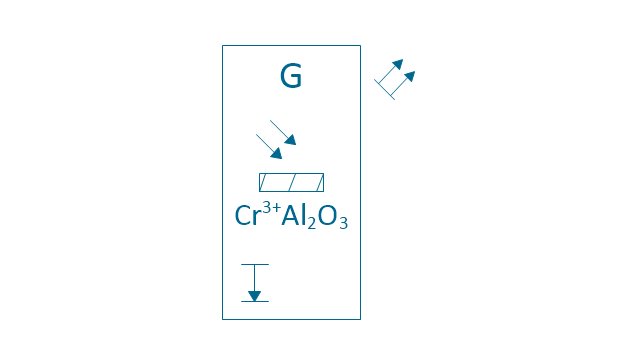
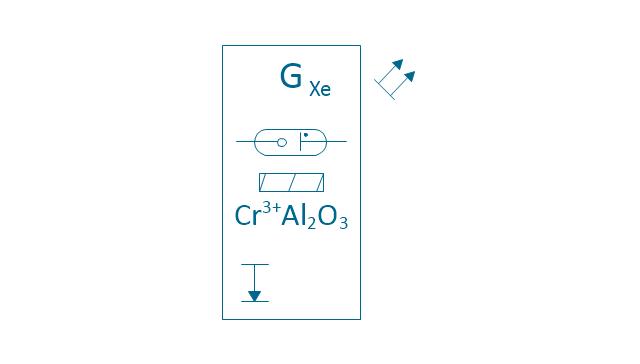
The vector stencils library "VHF UHF SHF" contains 52 symbols for VHF, UHF, and SHF circuit design, including capacitance measurers, nonreciprocal devices, modulators, phase shifters, field polarization devices, and filters.
Use these shapes for drawing VHF, UHF and SHF diagrams in the ConceptDraw PRO diagramming and vector drawing software extended with the Electrical Engineering solution from the Engineering area of ConceptDraw Solution Park.
www.conceptdraw.com/ solution-park/ engineering-electrical
Use these shapes for drawing VHF, UHF and SHF diagrams in the ConceptDraw PRO diagramming and vector drawing software extended with the Electrical Engineering solution from the Engineering area of ConceptDraw Solution Park.
www.conceptdraw.com/ solution-park/ engineering-electrical
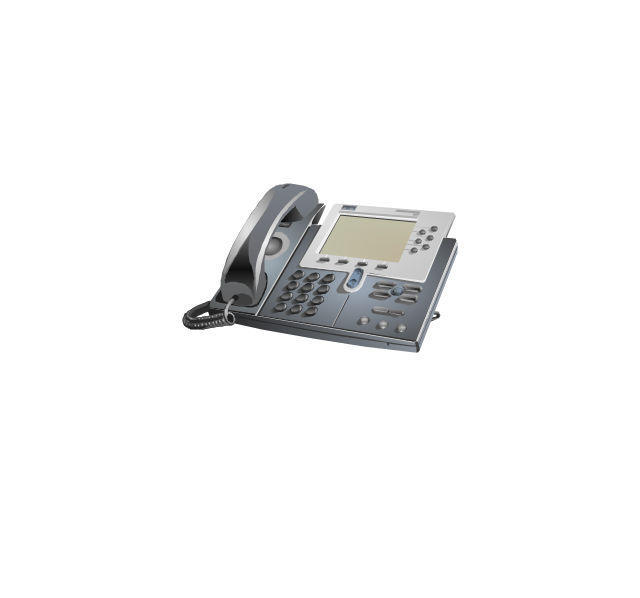
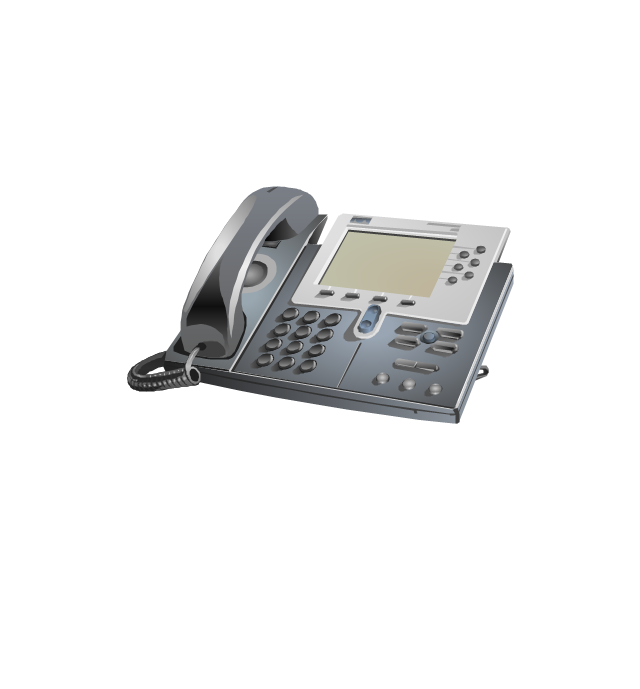
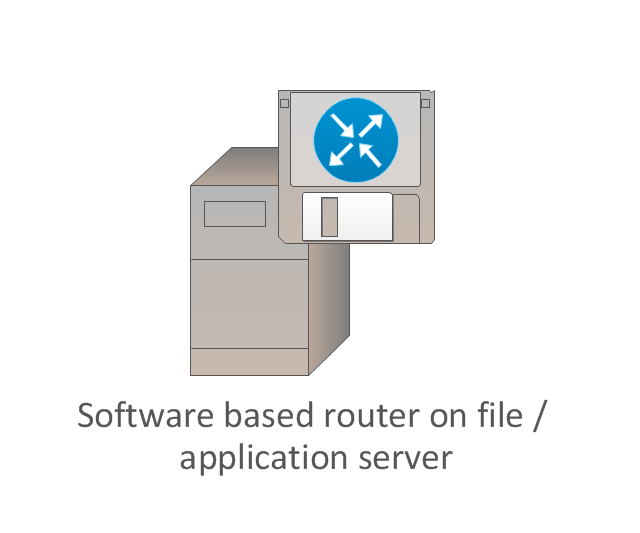
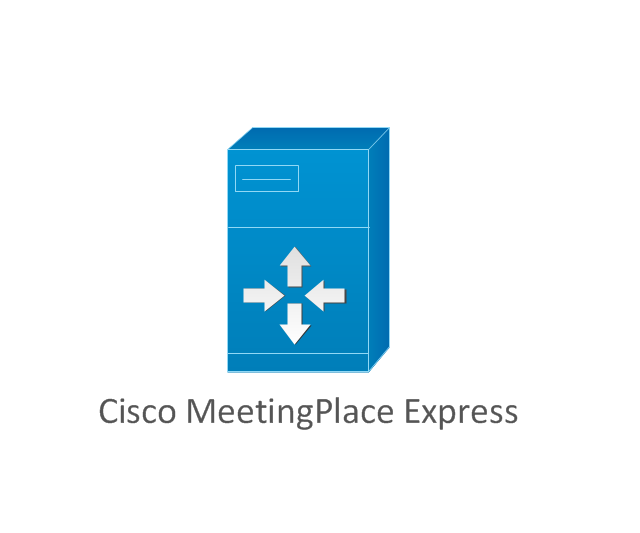
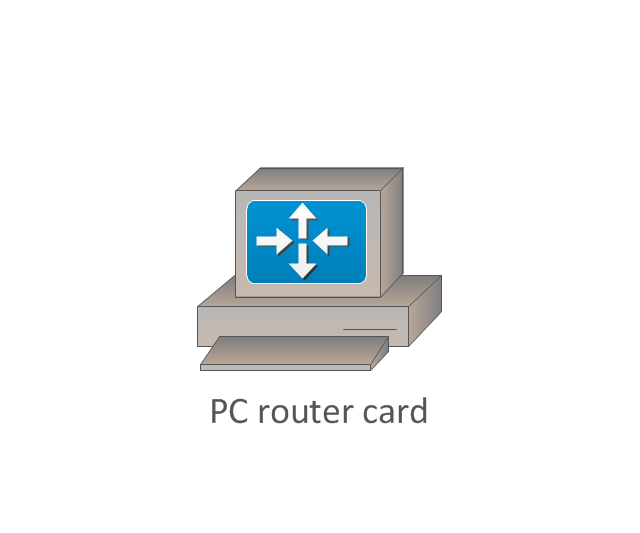
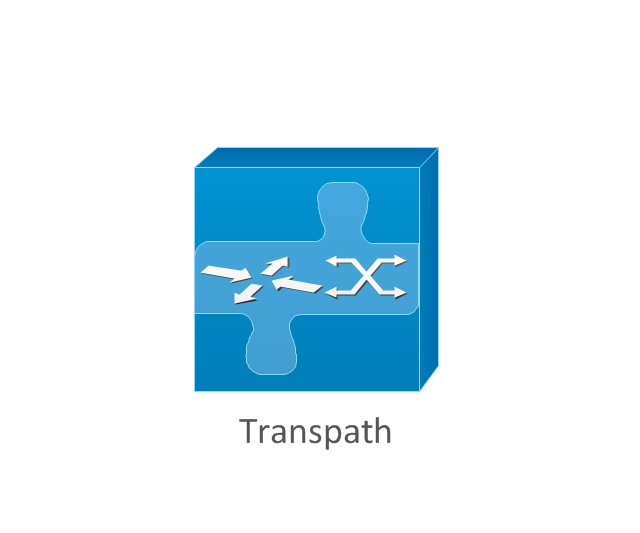
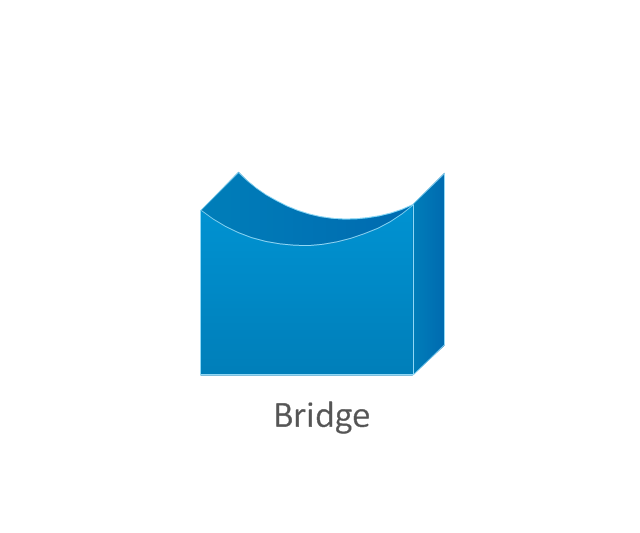
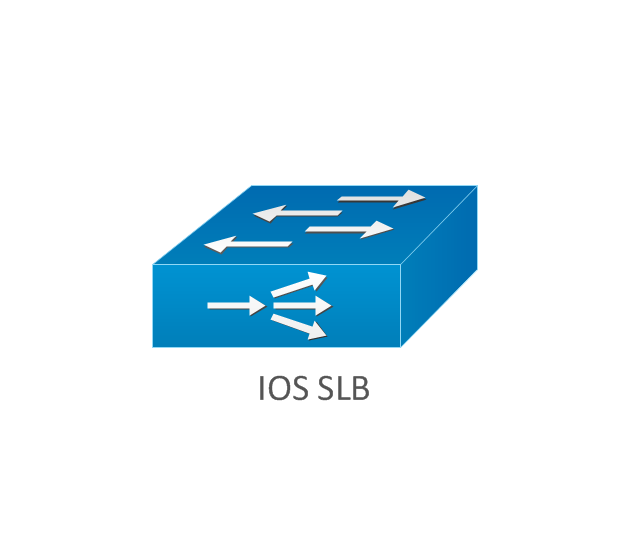
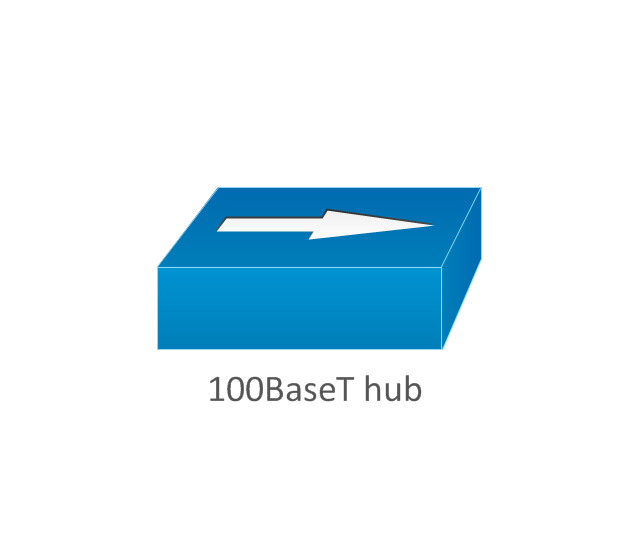
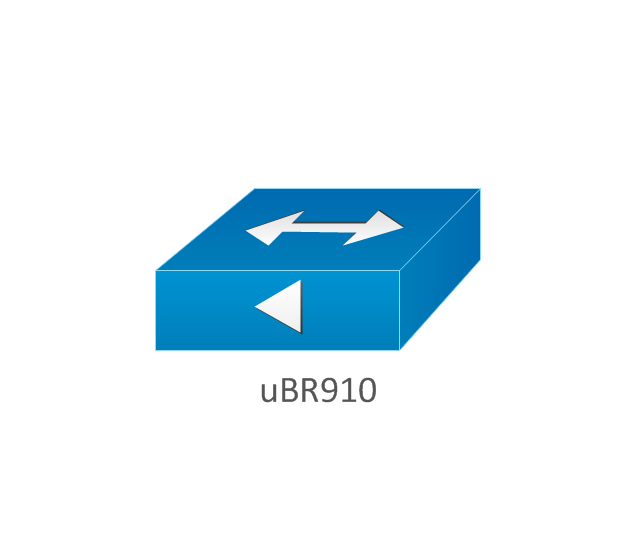
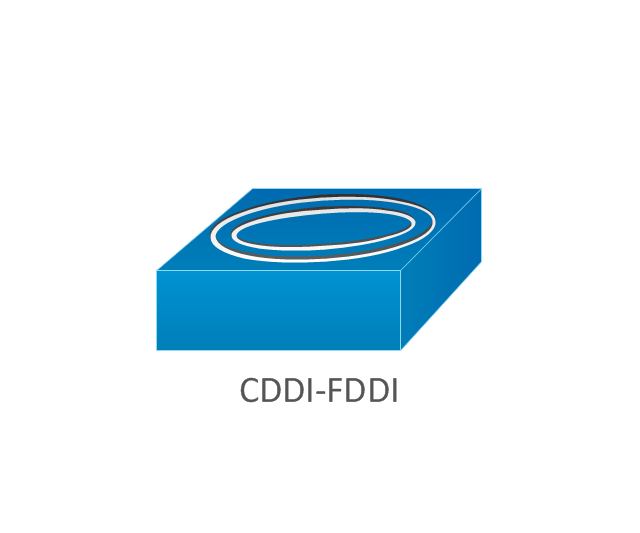
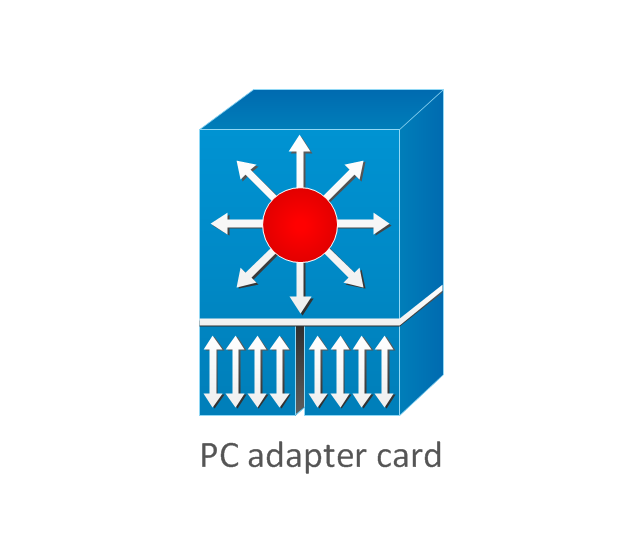
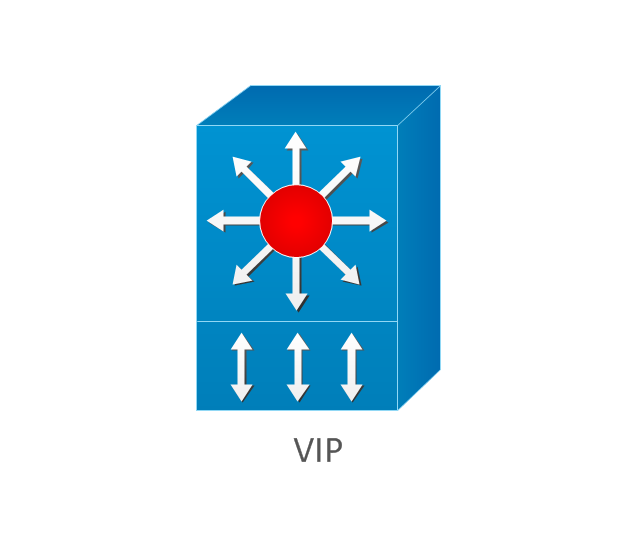
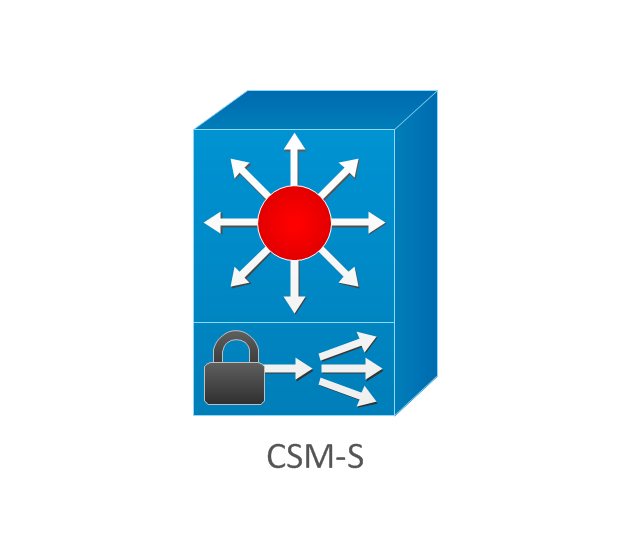
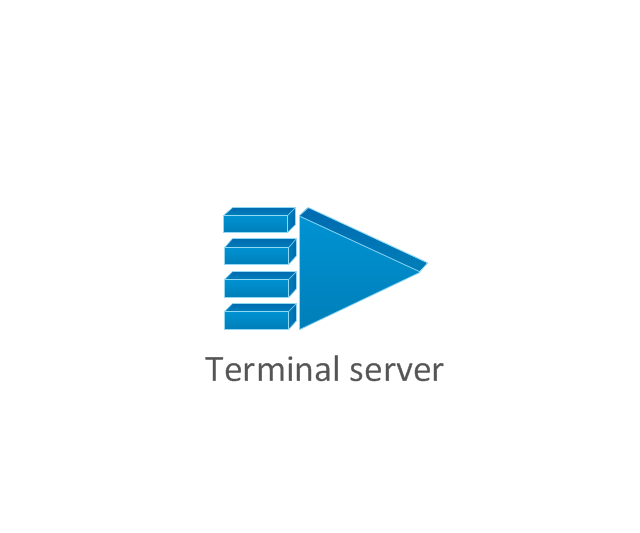
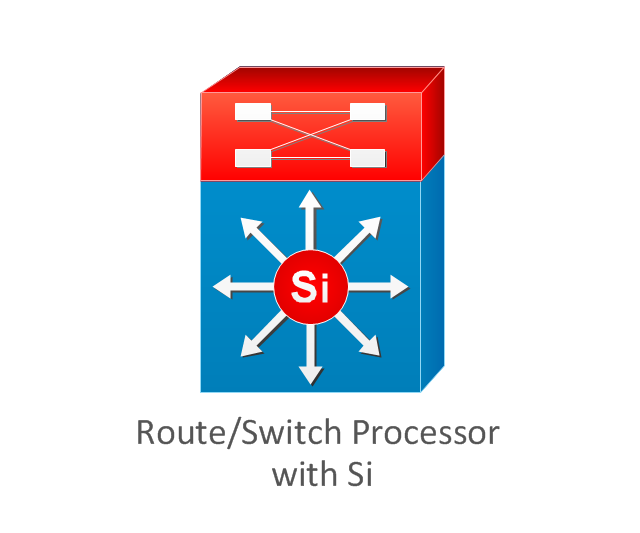
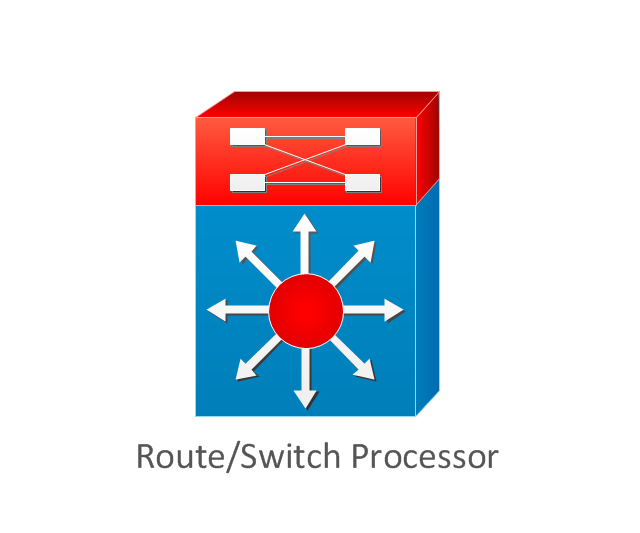
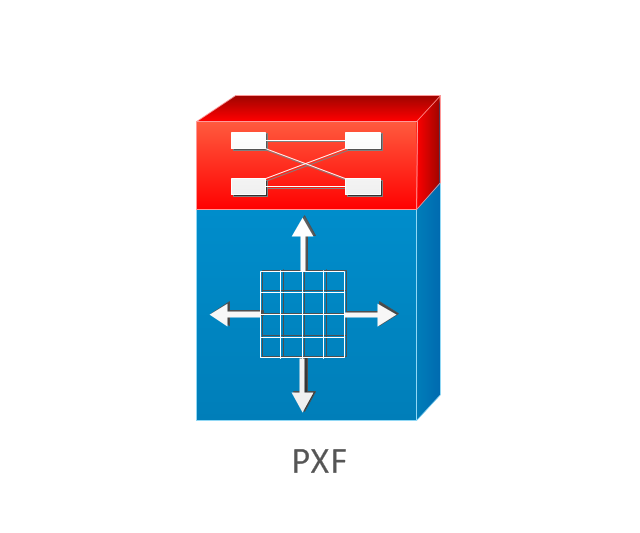
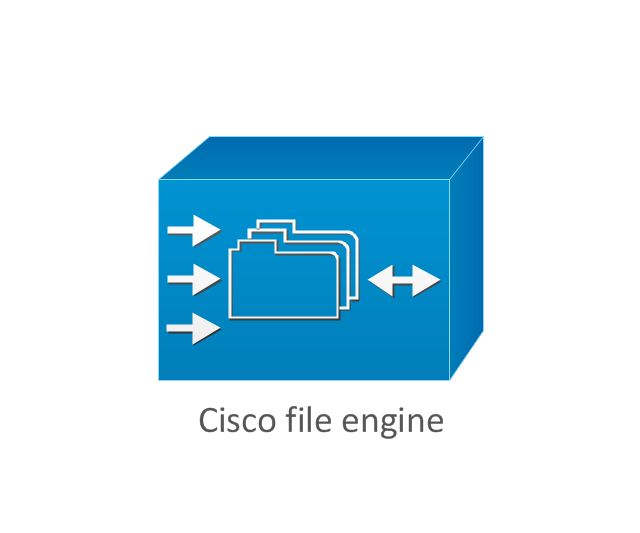
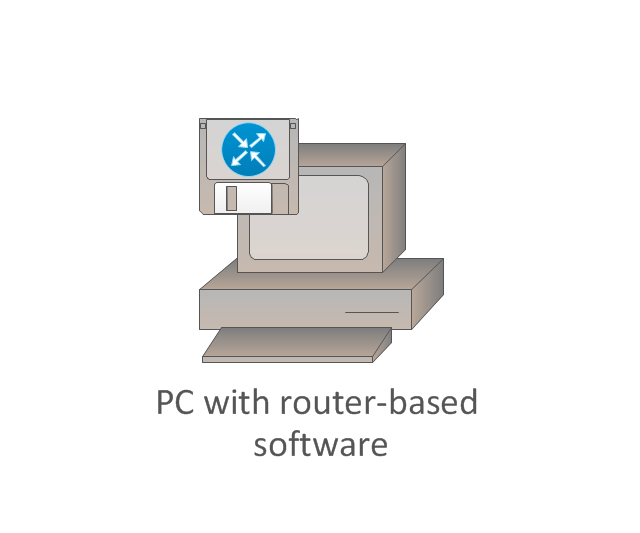
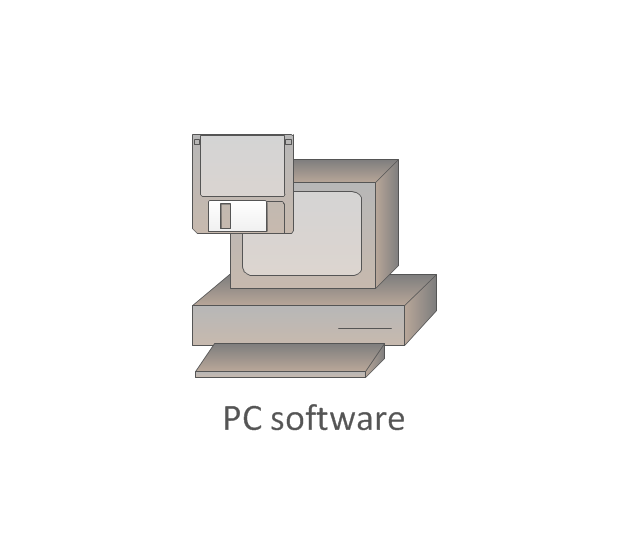
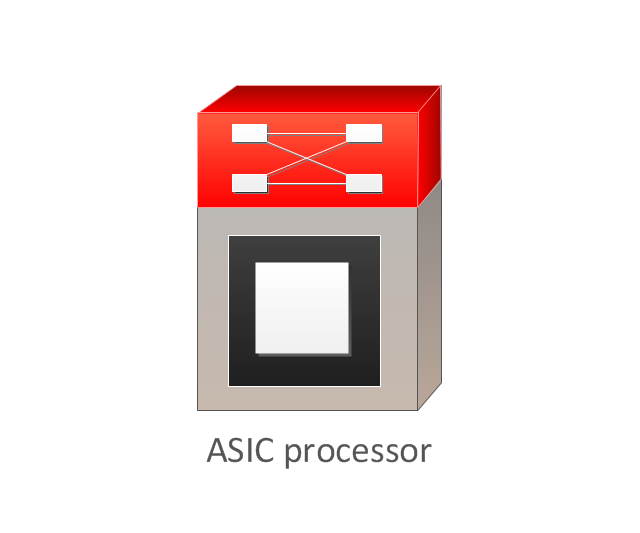
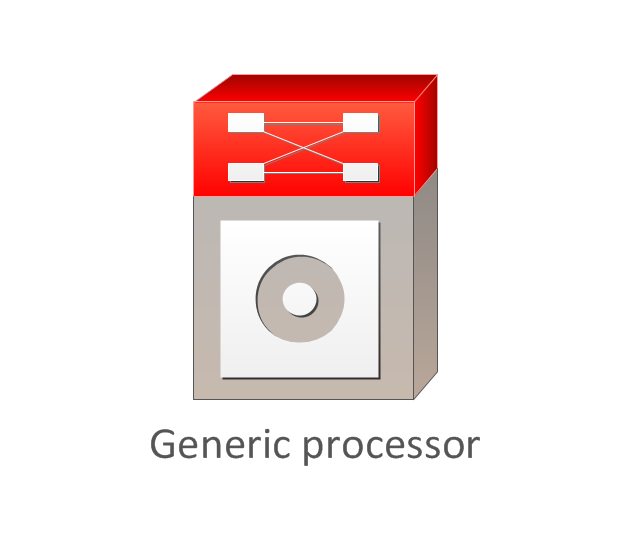
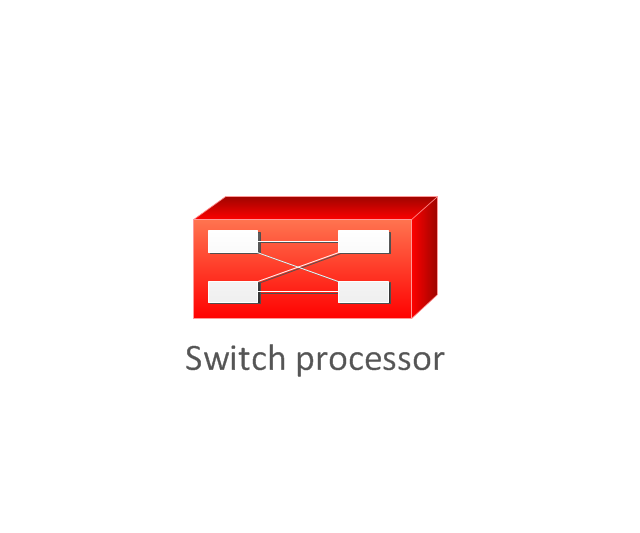
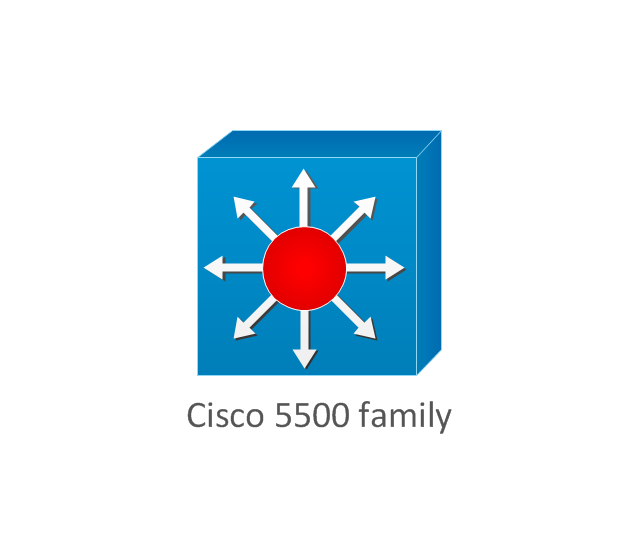
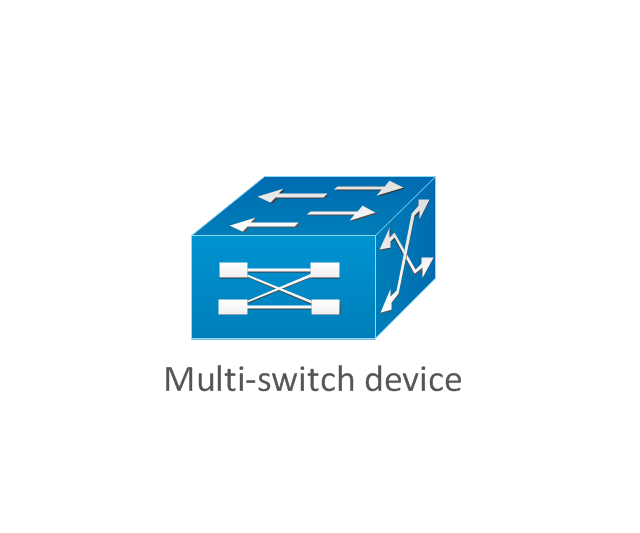
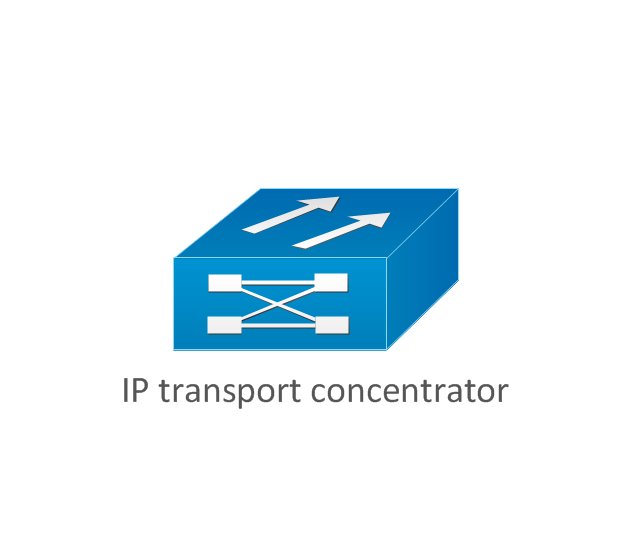
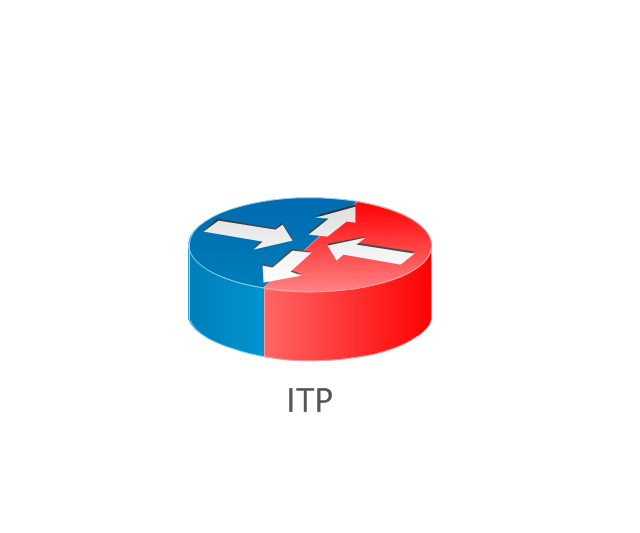
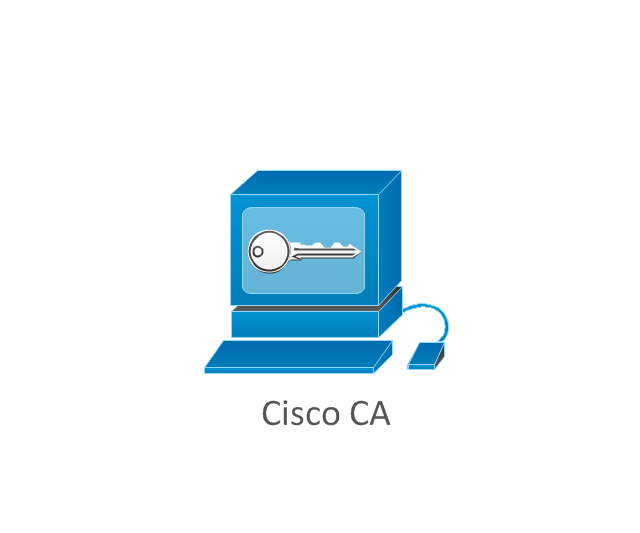
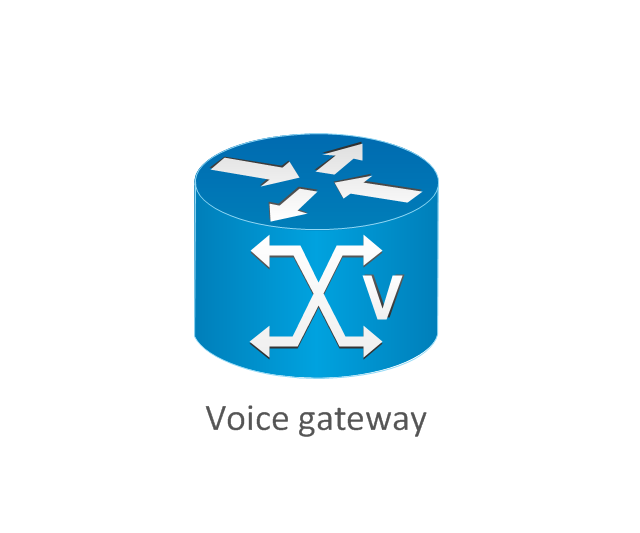
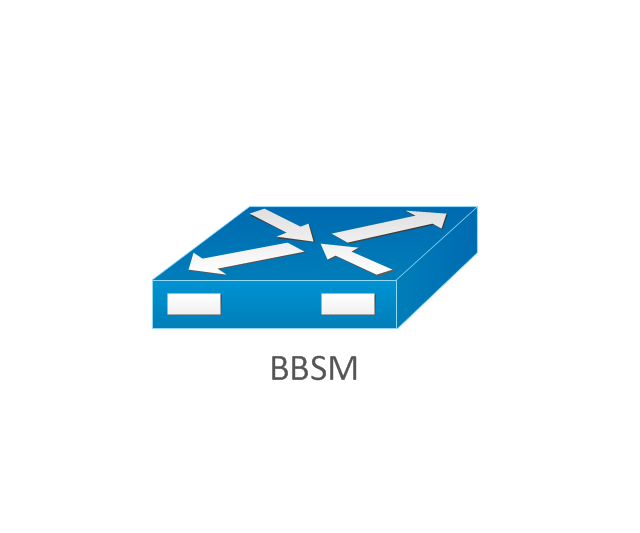
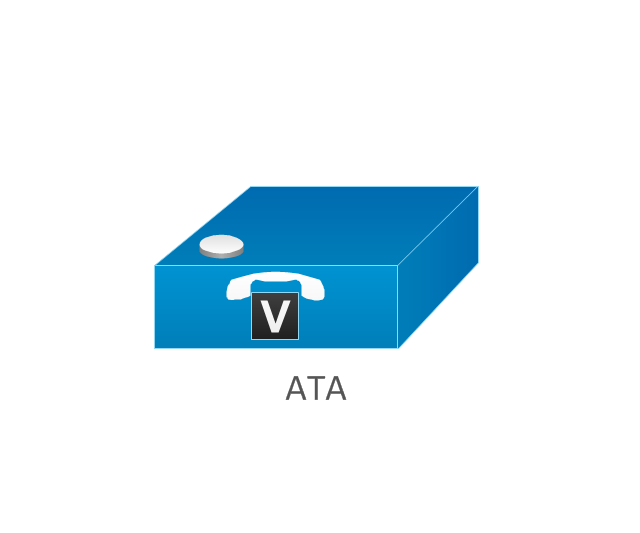
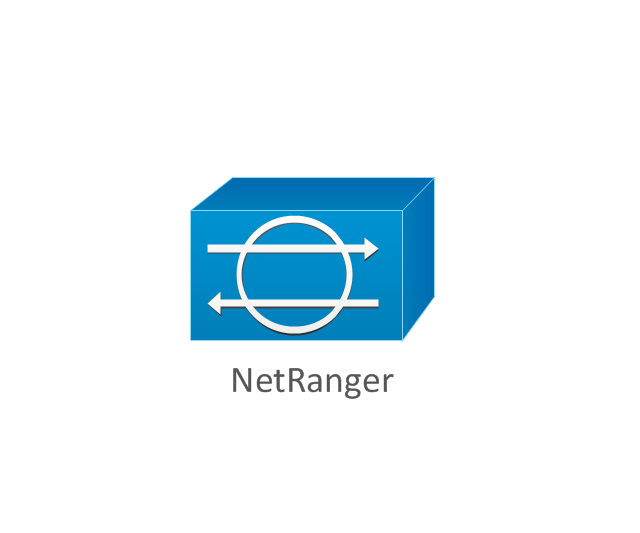
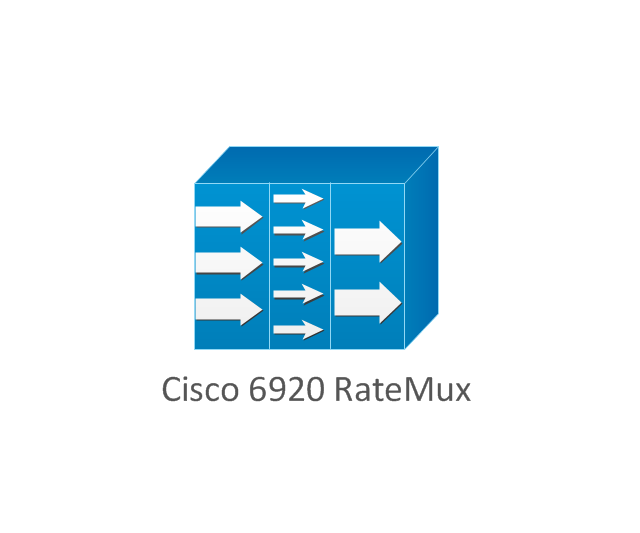
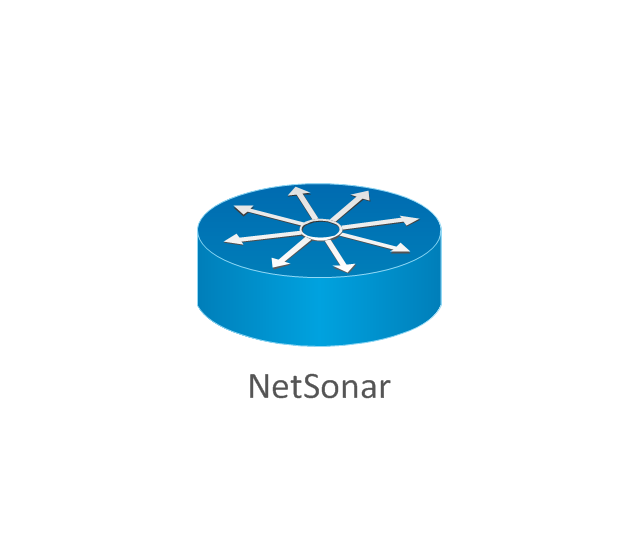
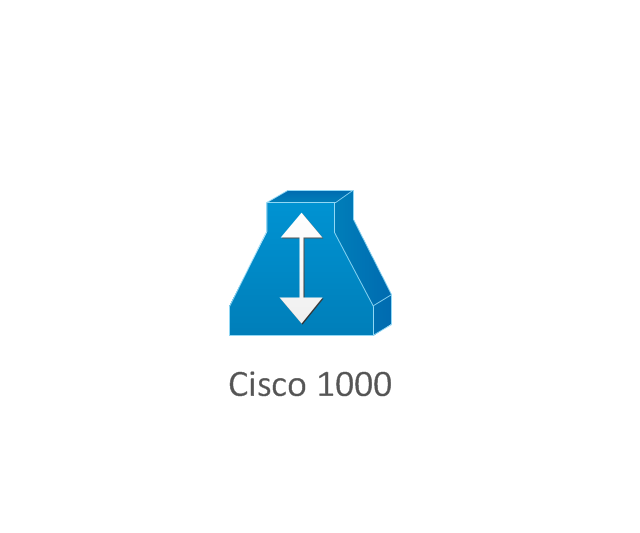
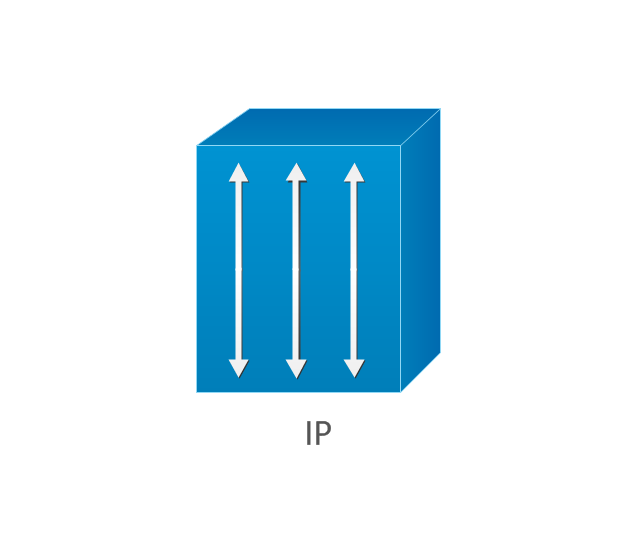
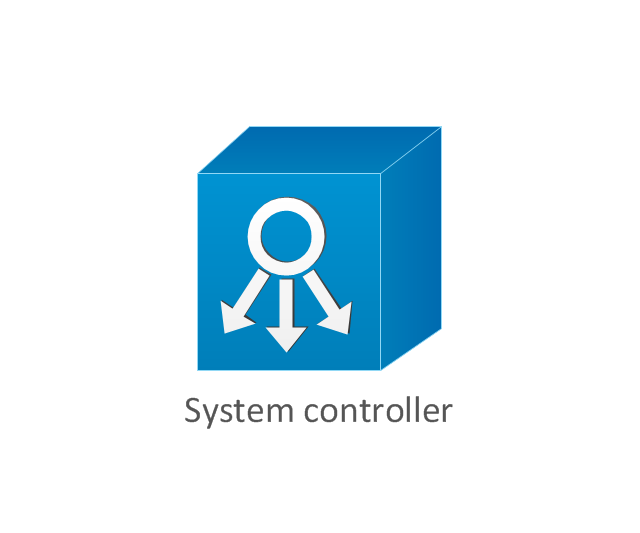
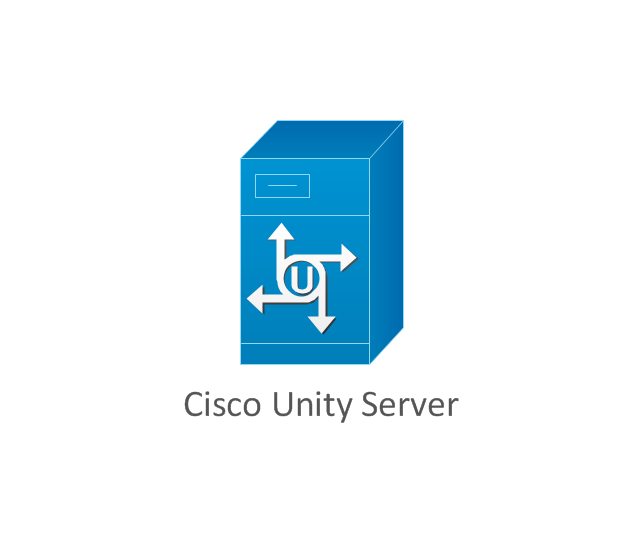
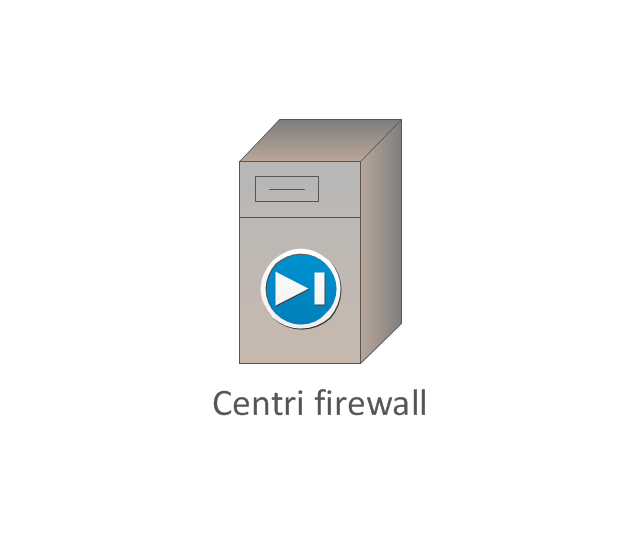
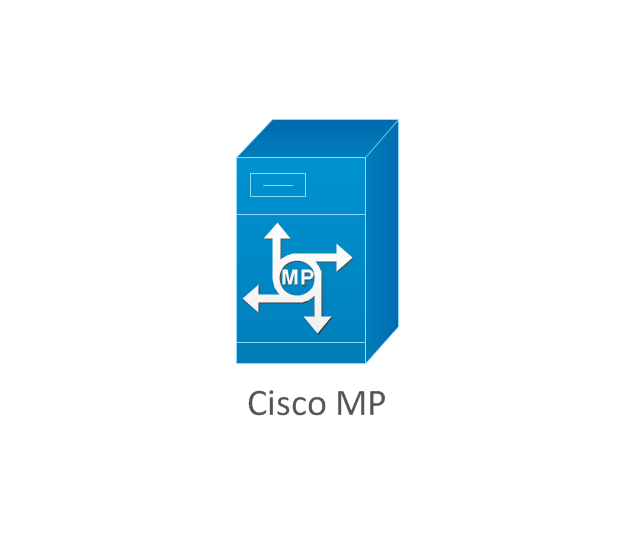
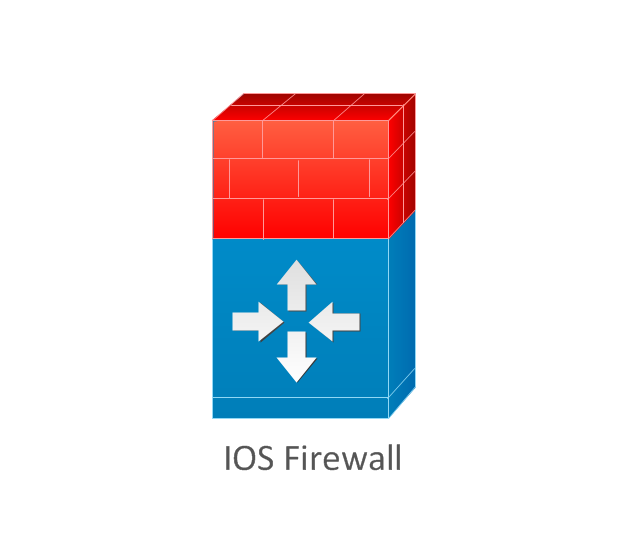
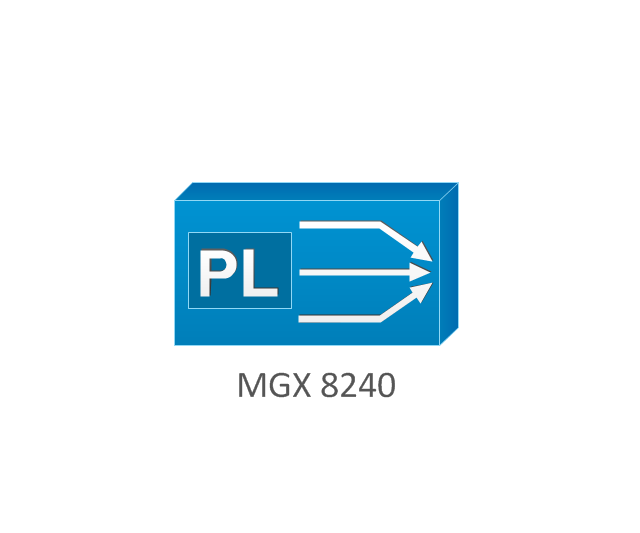
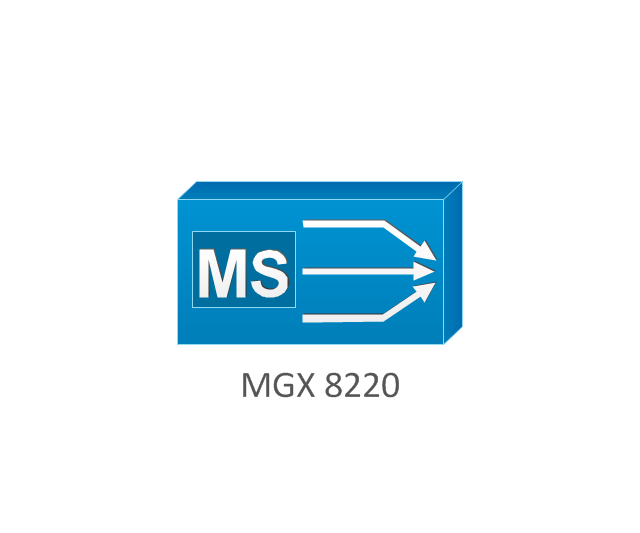
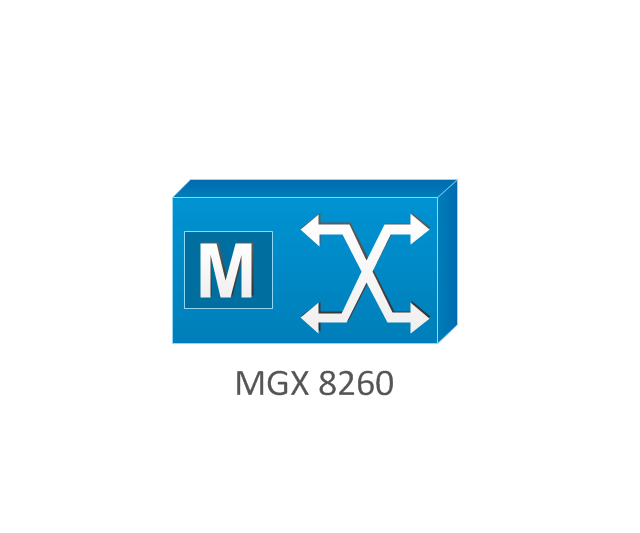
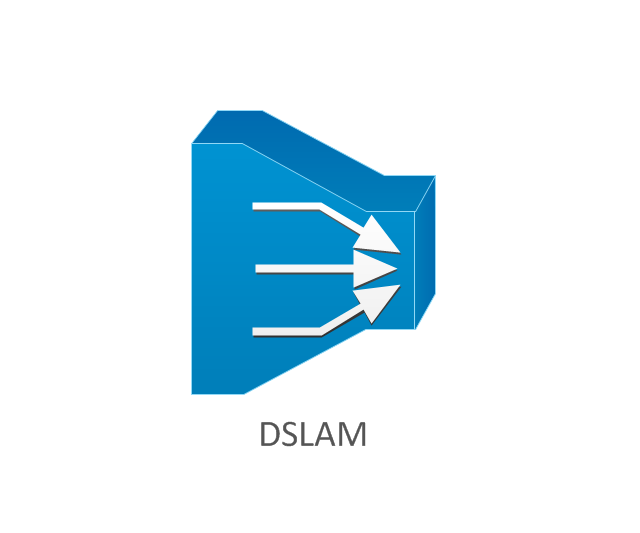
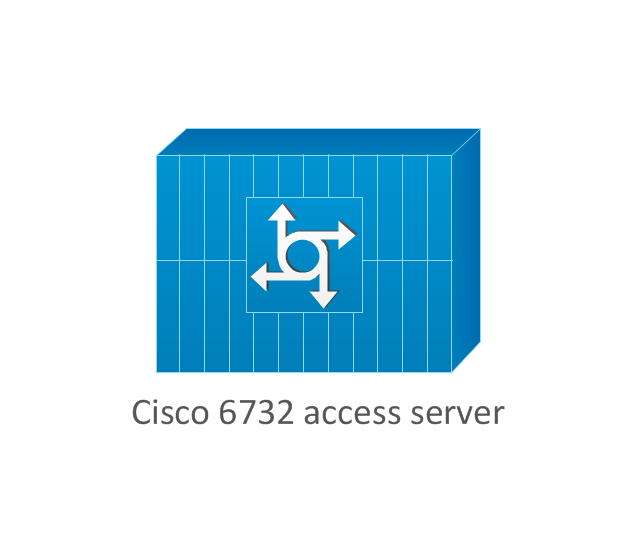
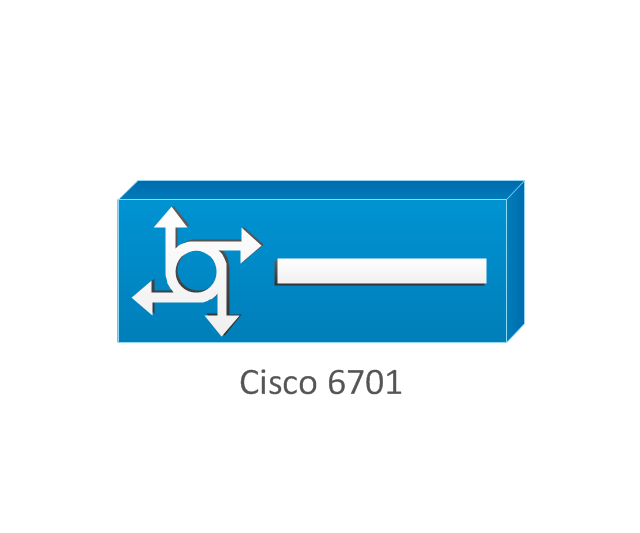
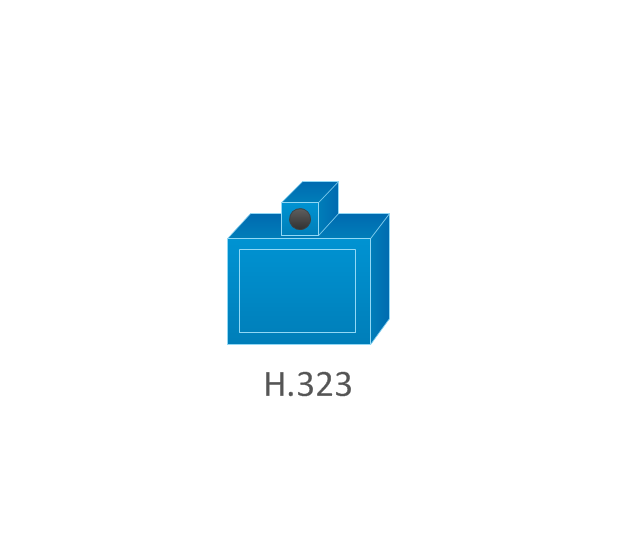
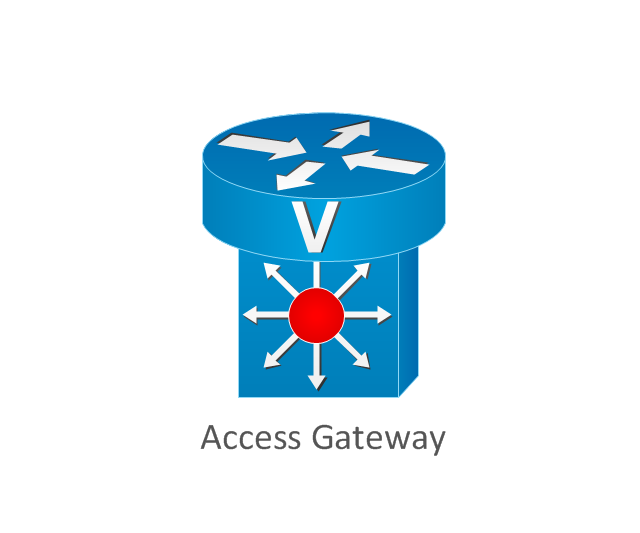
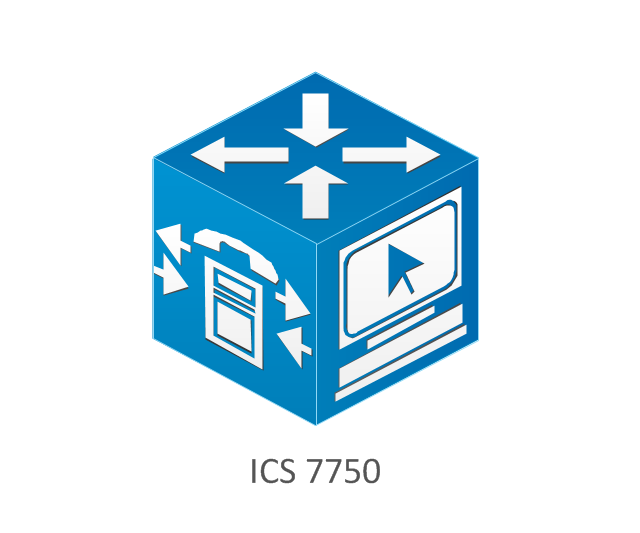
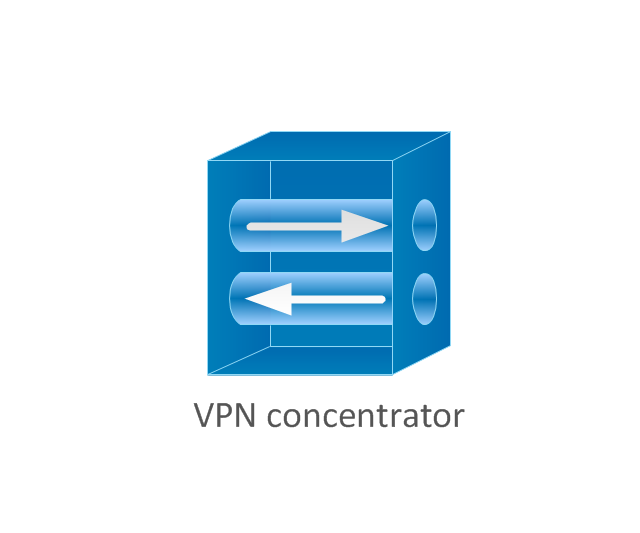
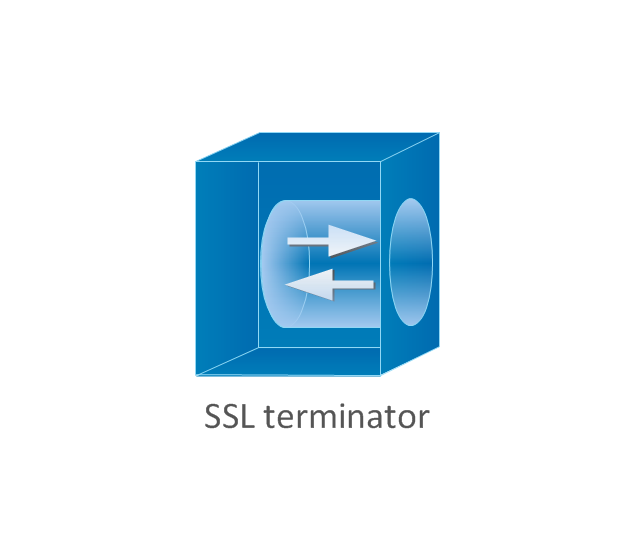
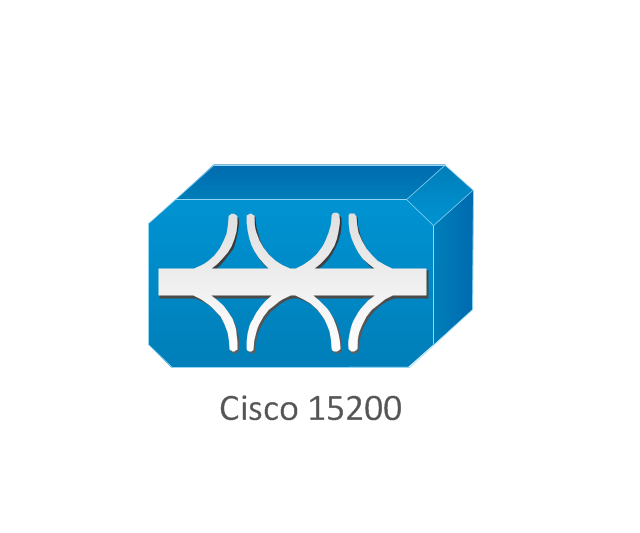
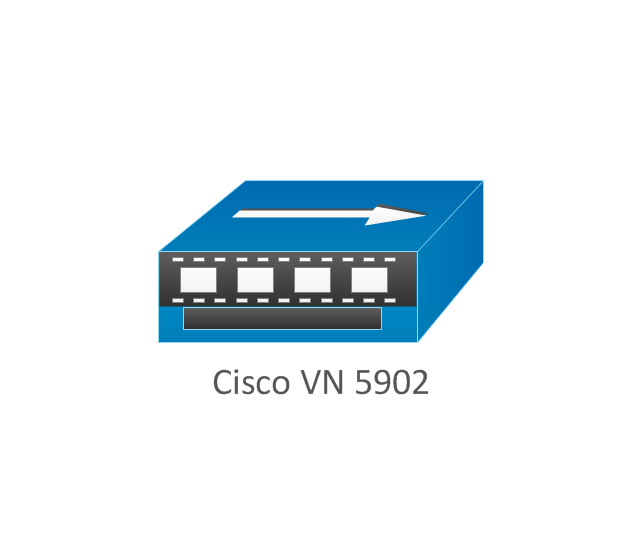
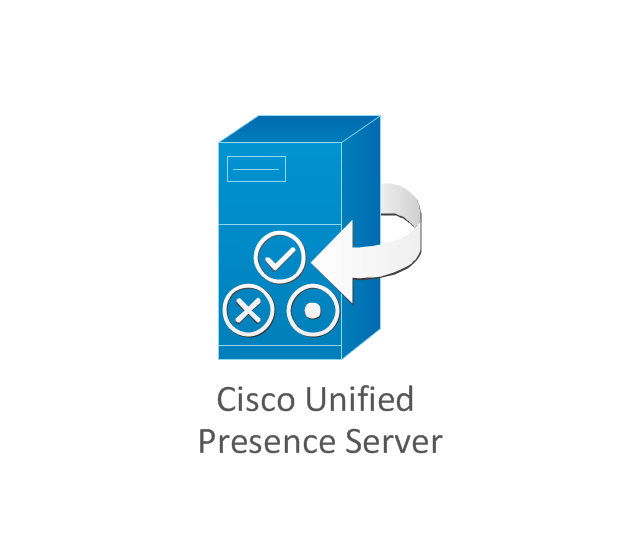
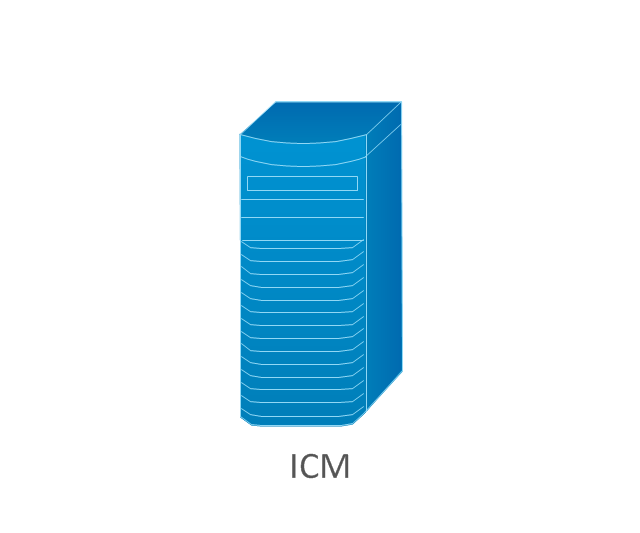
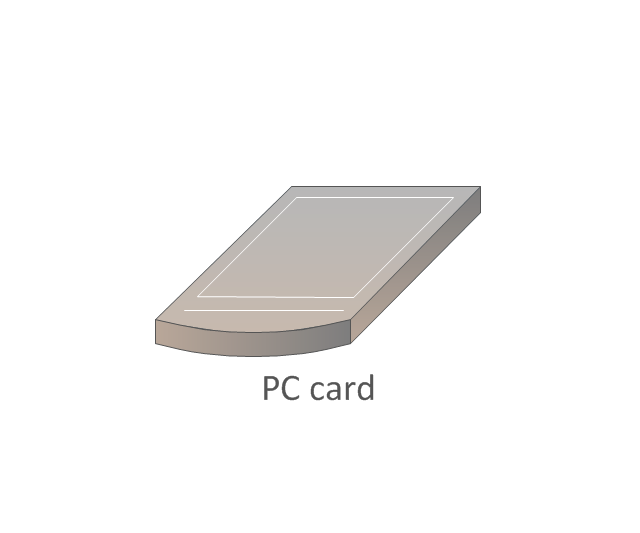
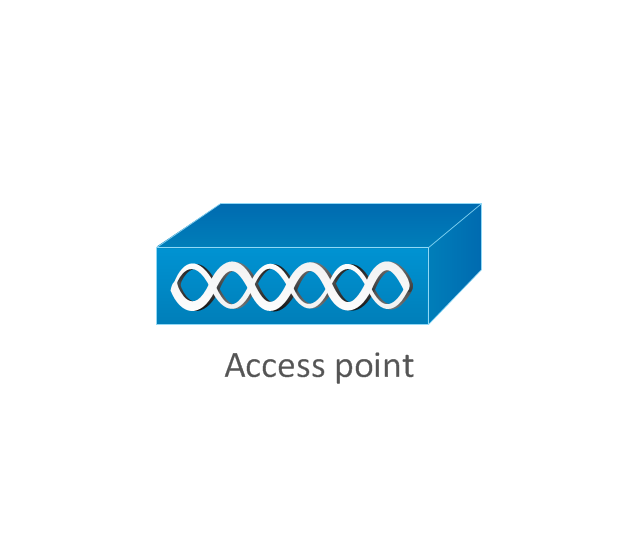
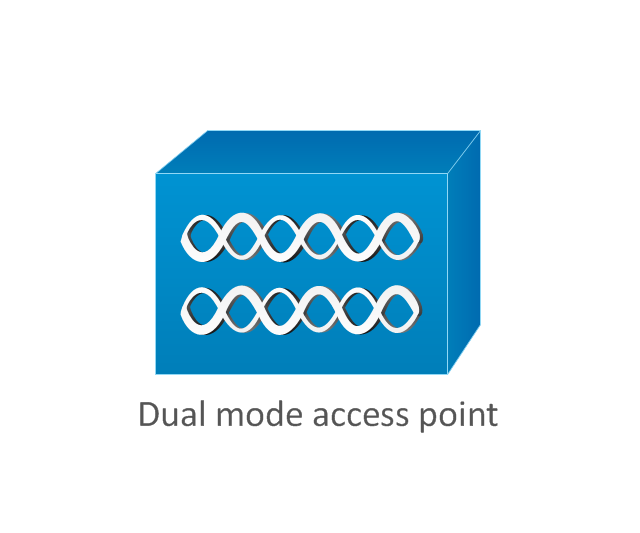
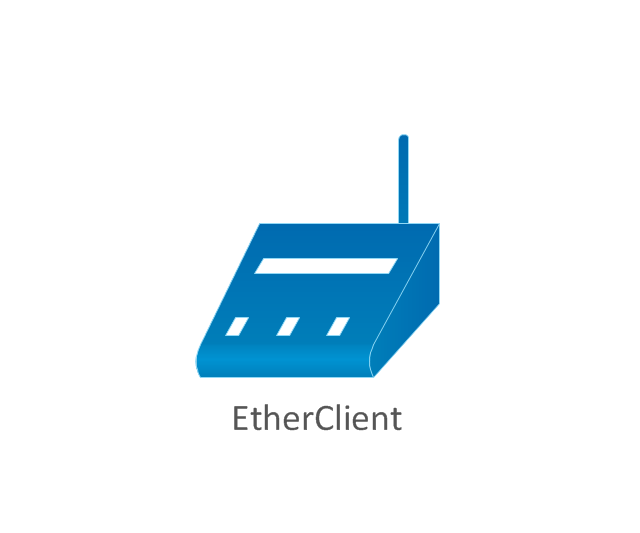
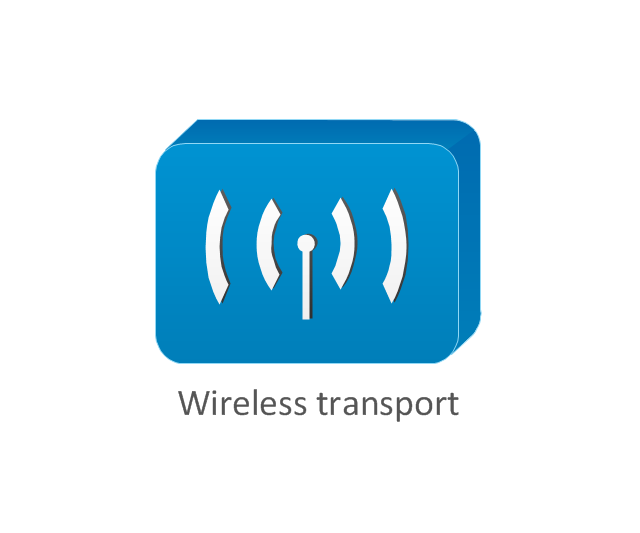
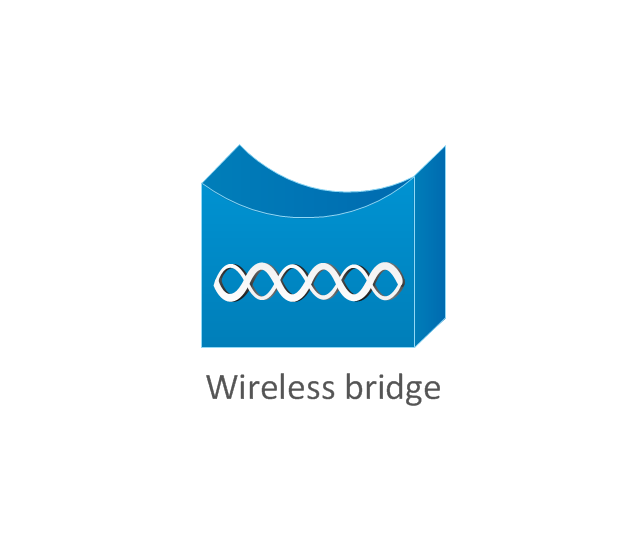
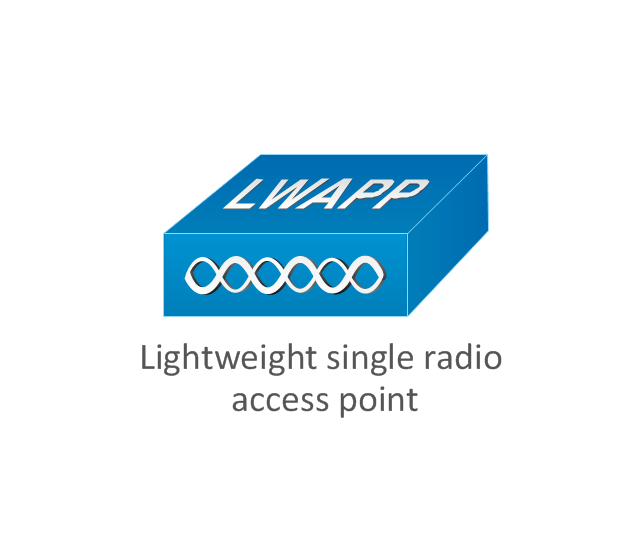
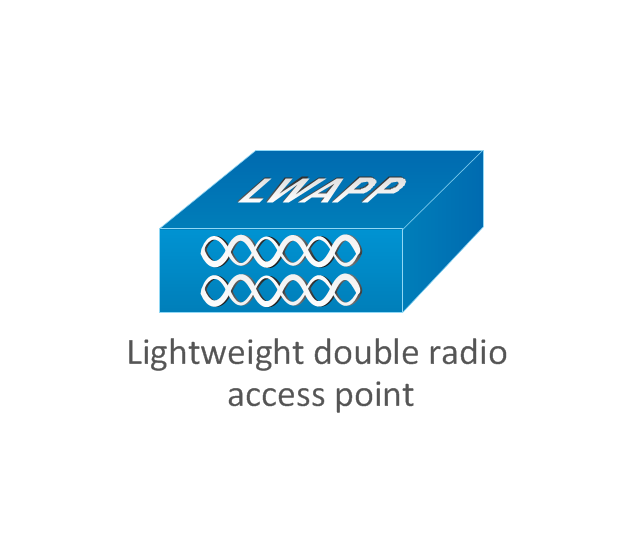
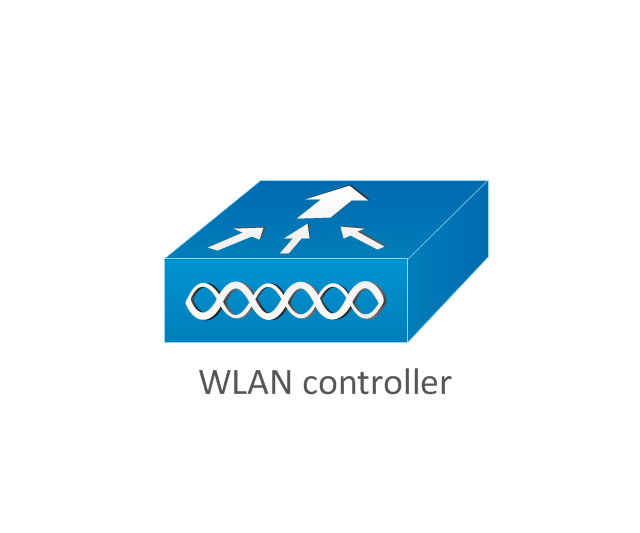
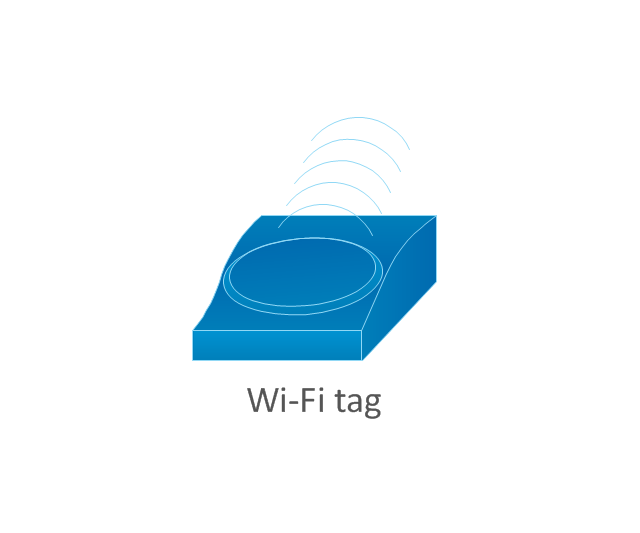
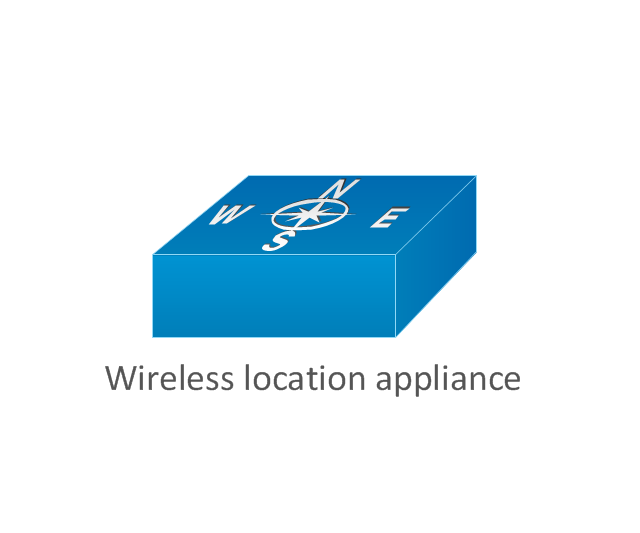
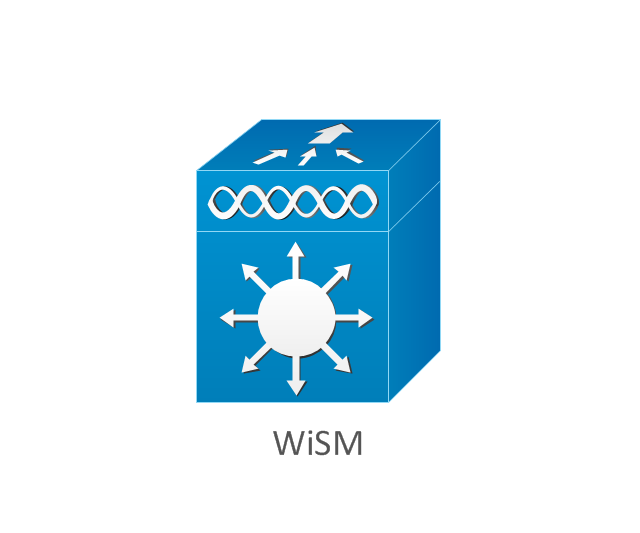
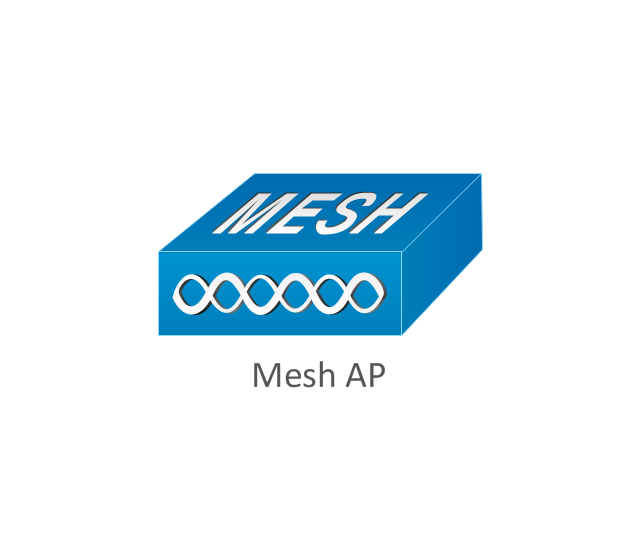
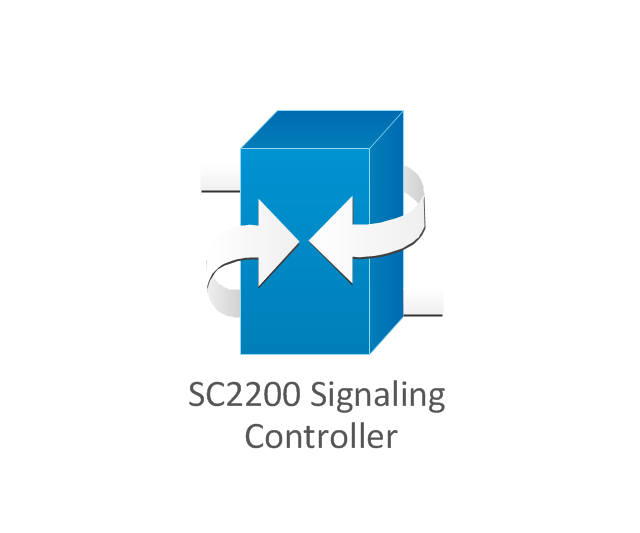
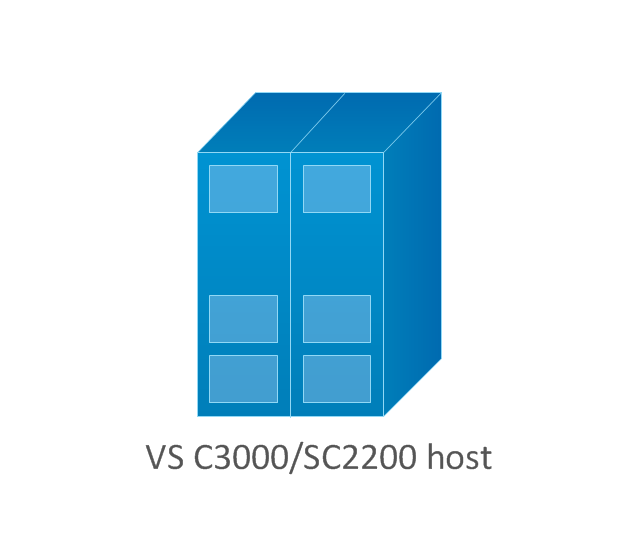
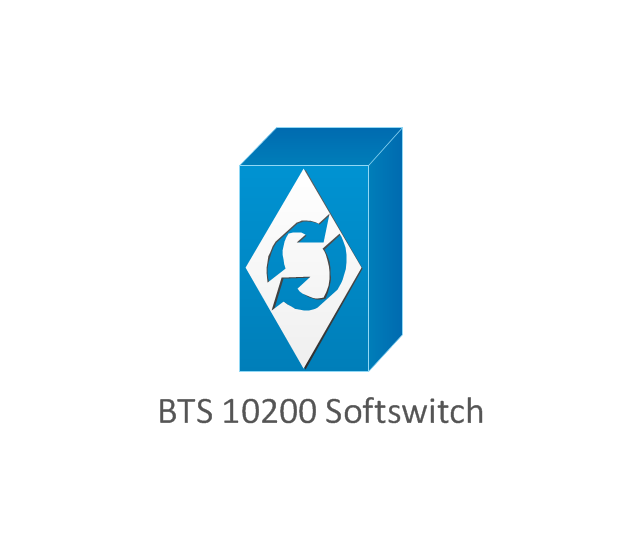
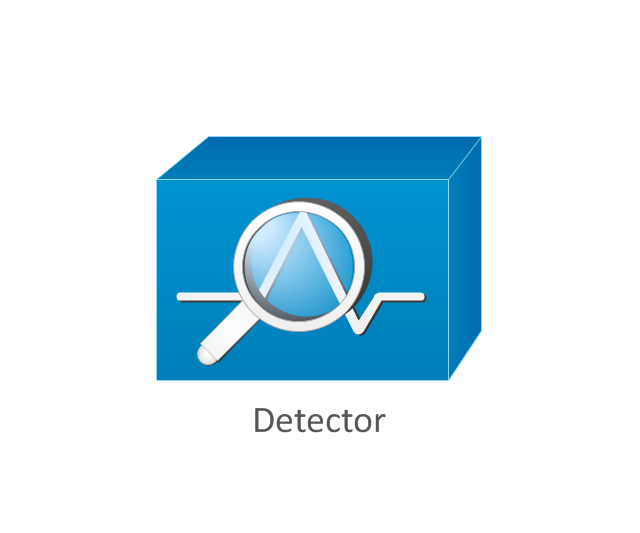
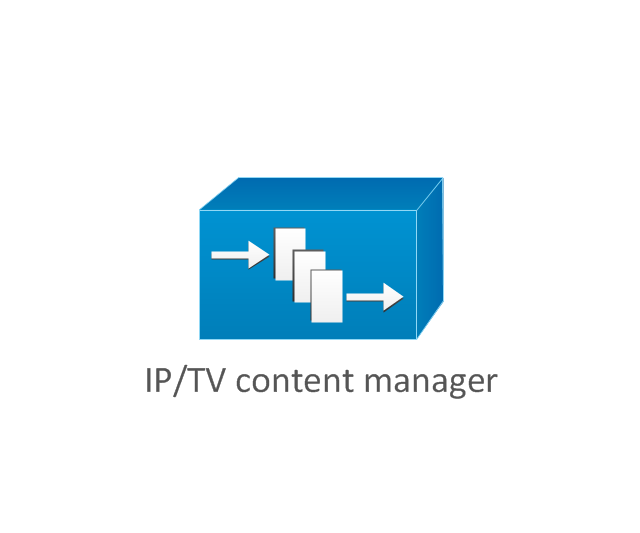
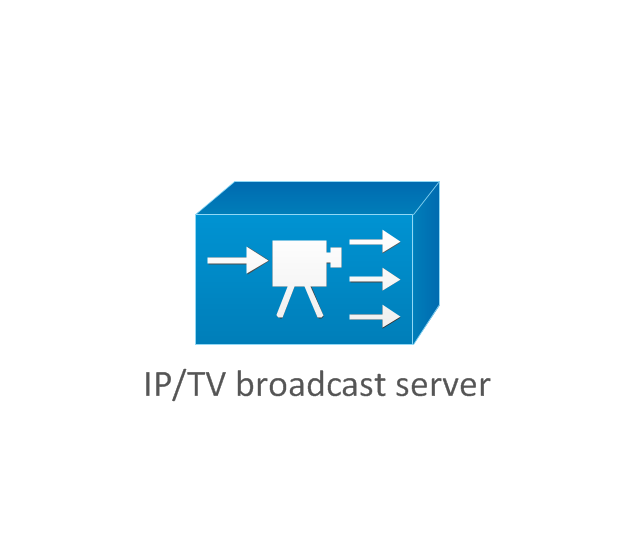
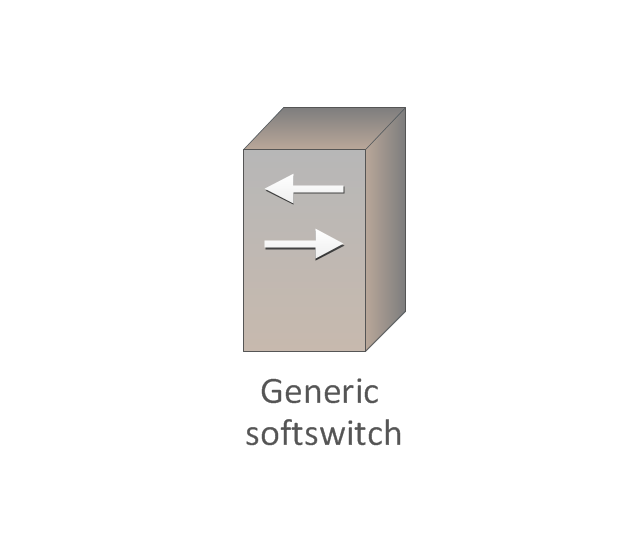
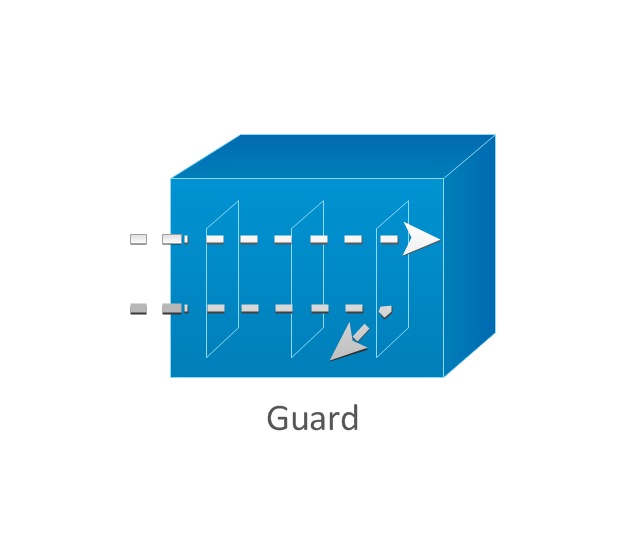
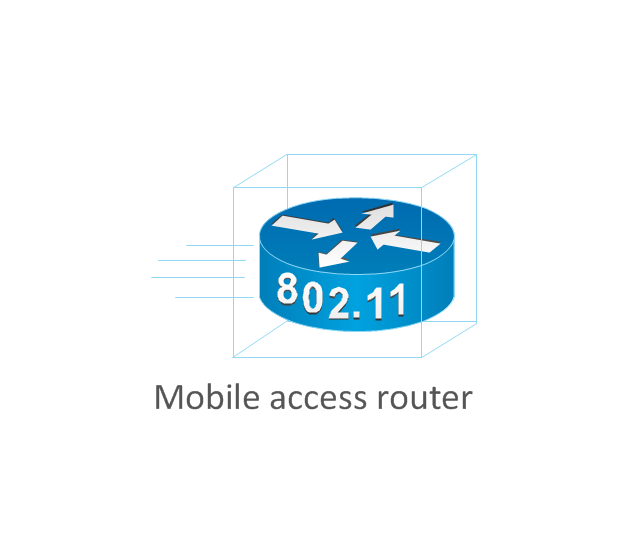
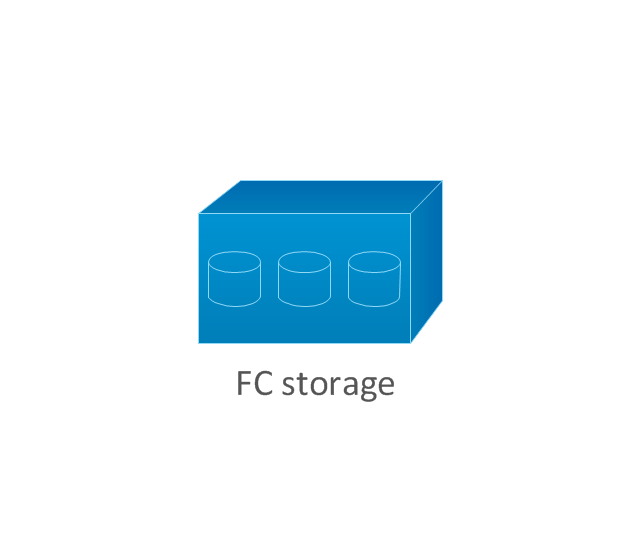
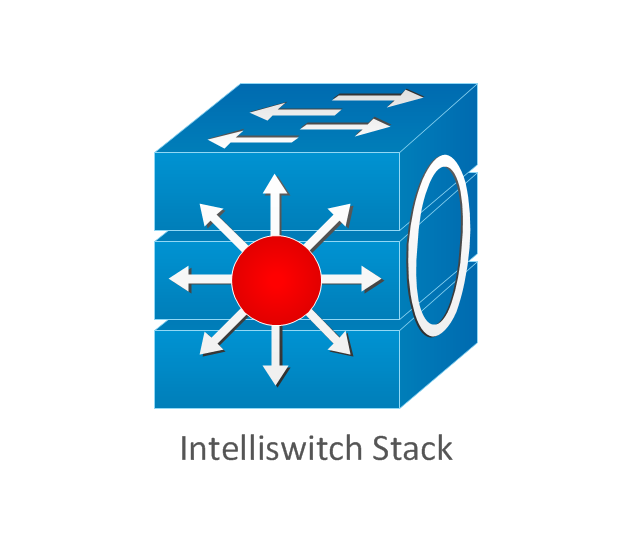
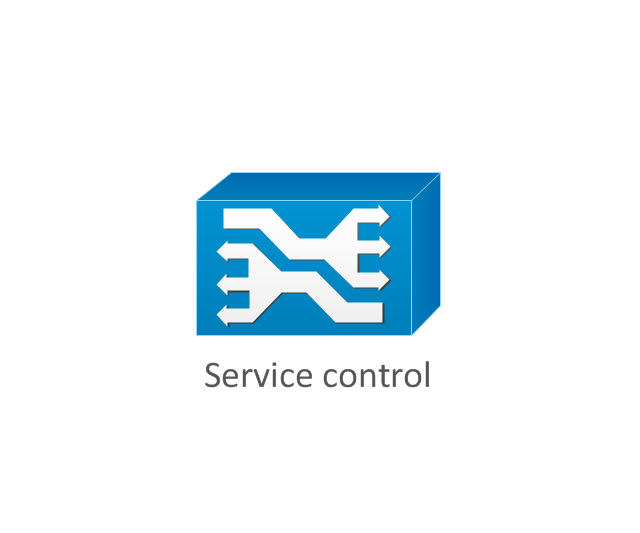
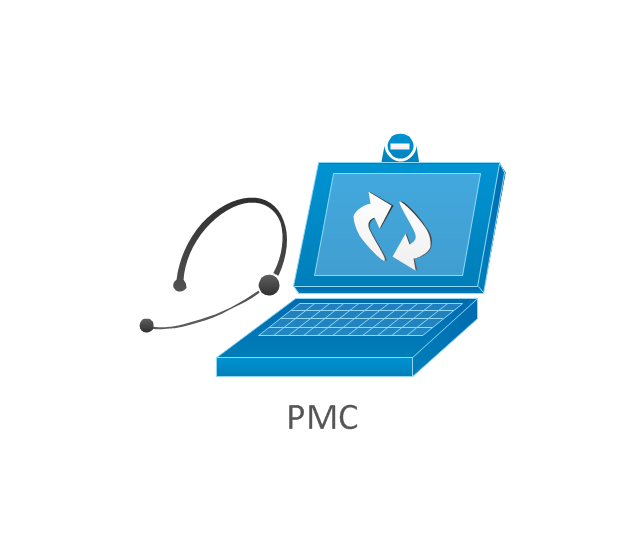
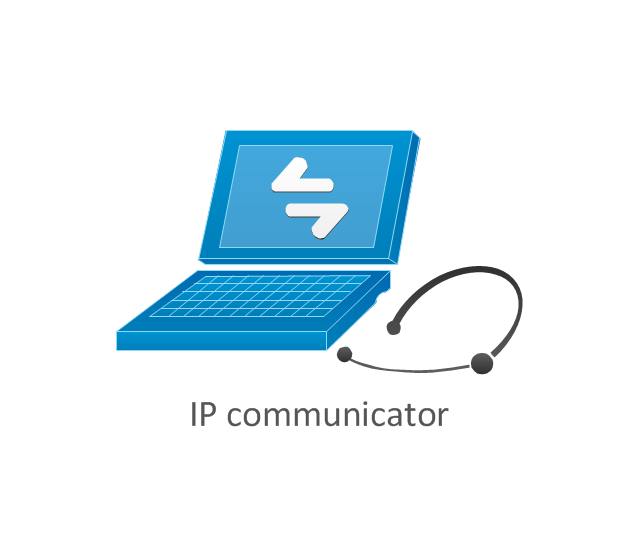
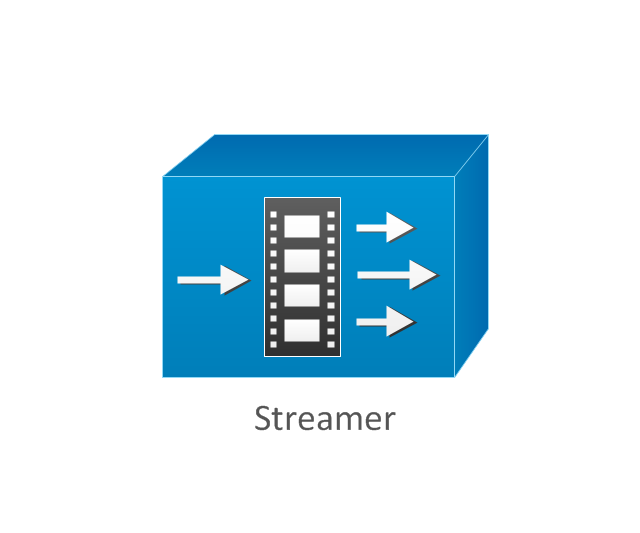
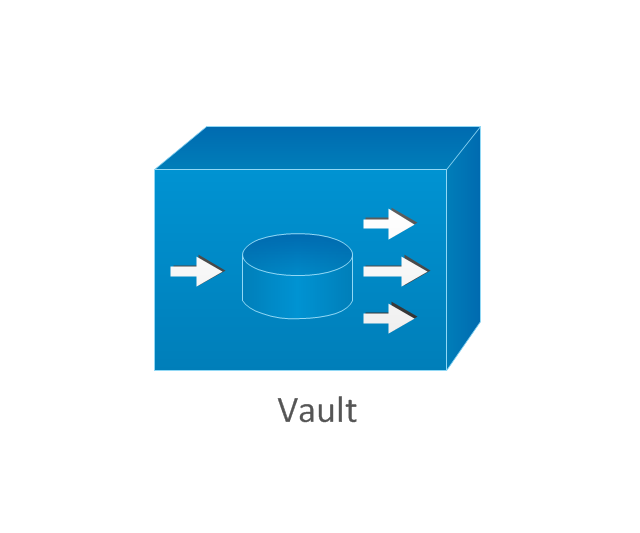
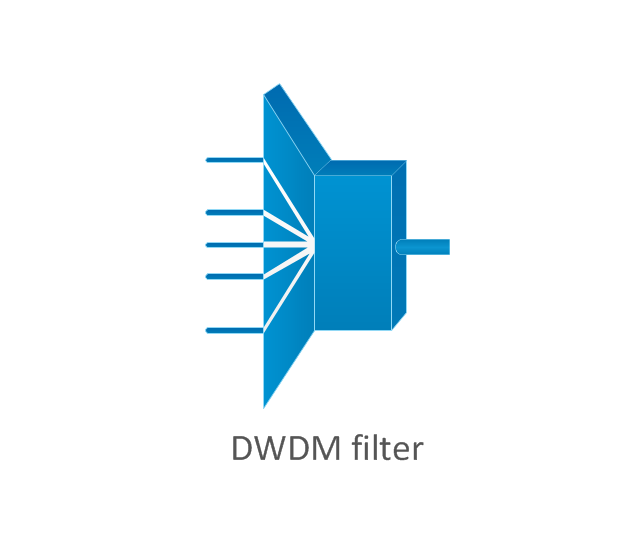
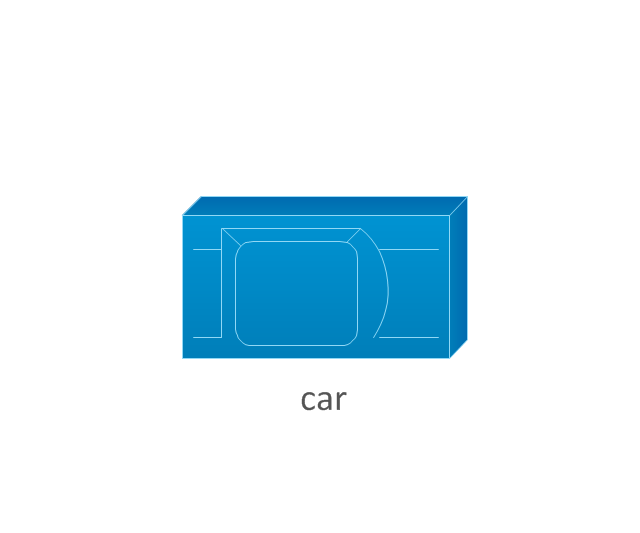
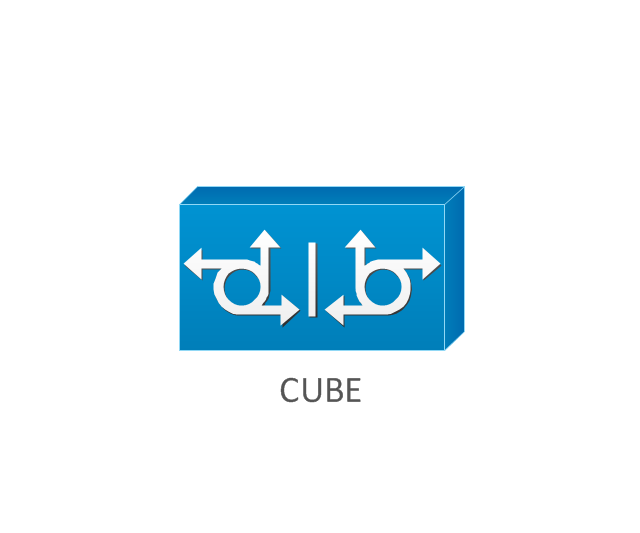
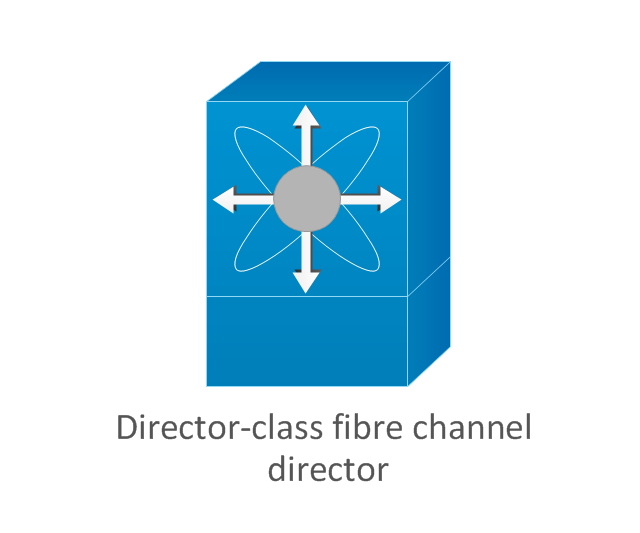
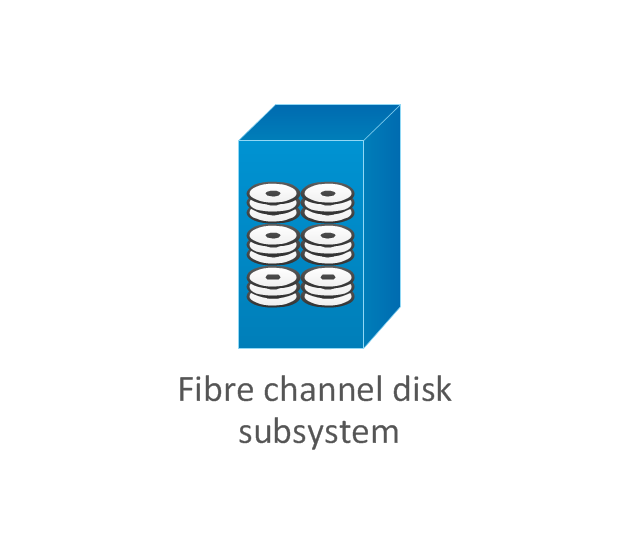
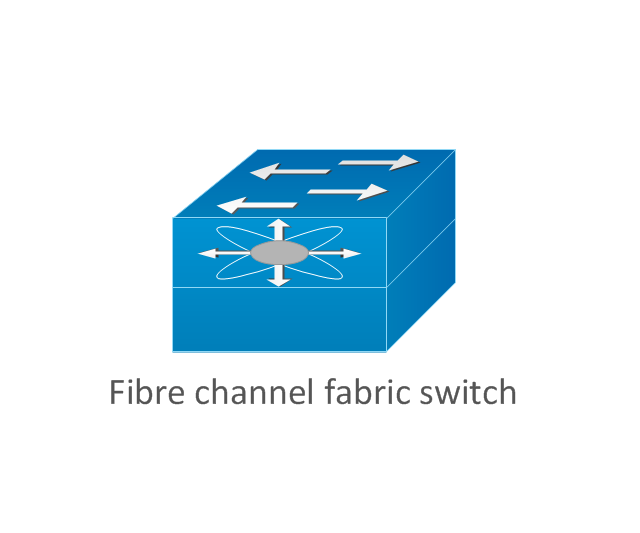
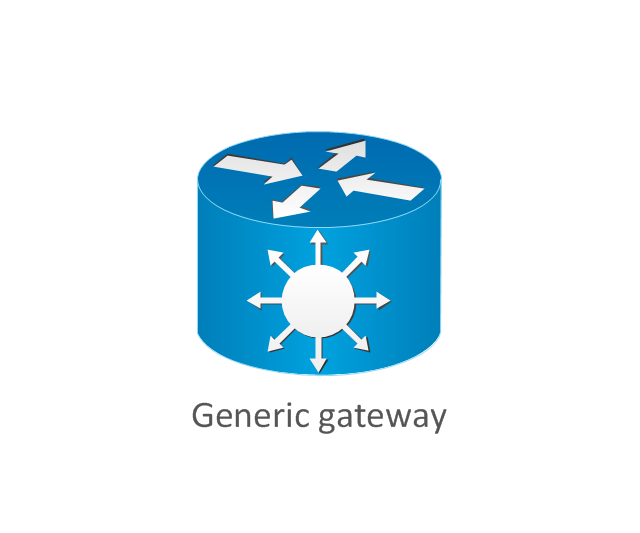
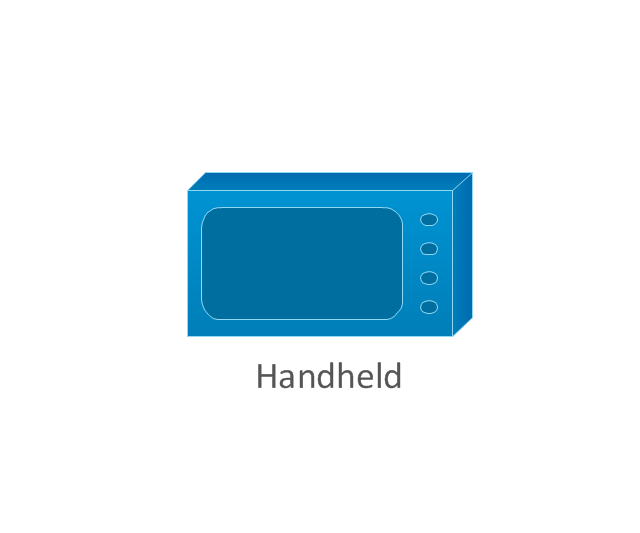
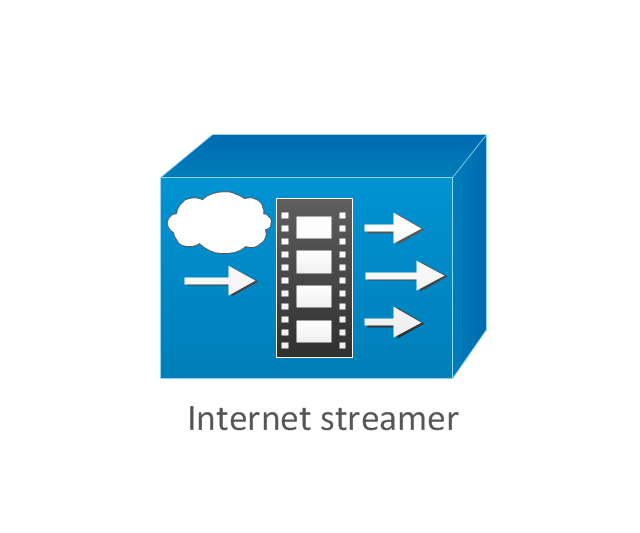
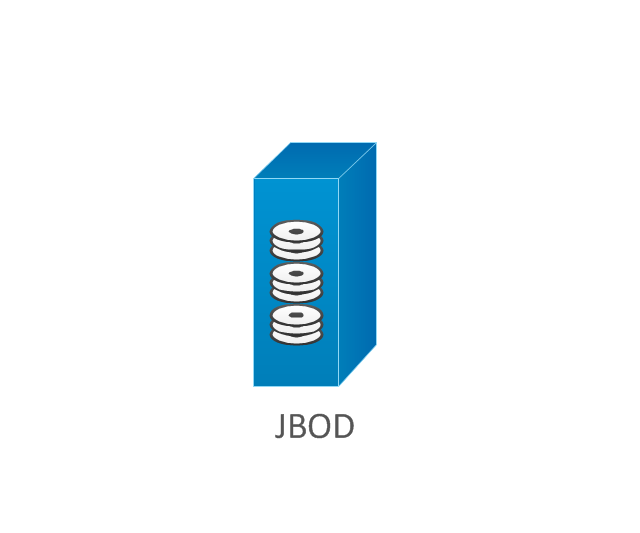
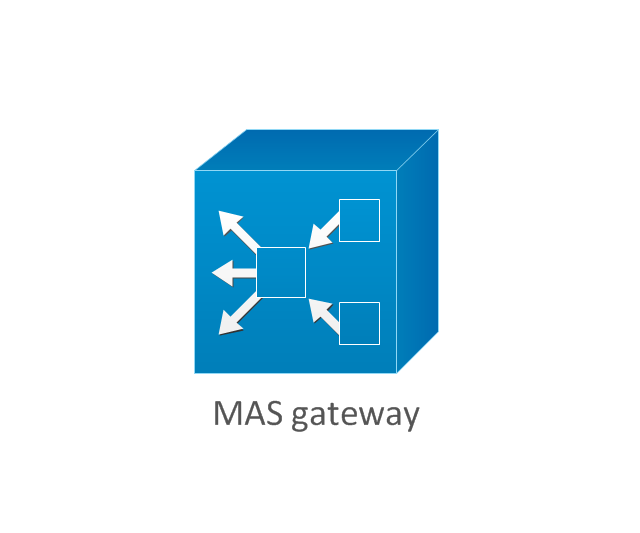
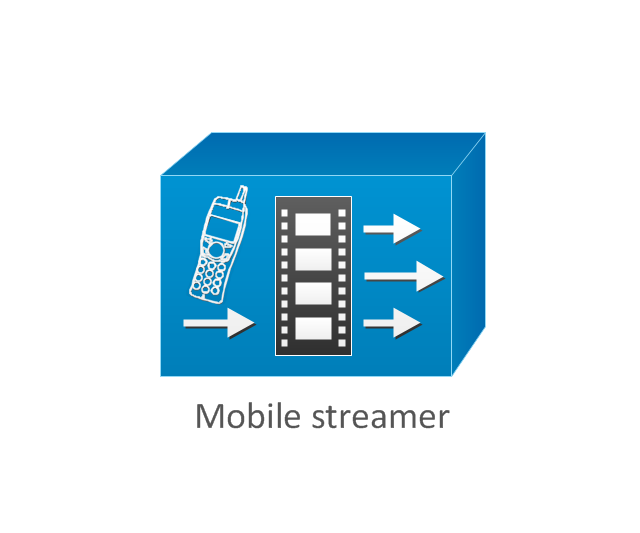
The vector stencils library "Cisco products additional" contains 141 symbols of computer network devices and equipment for drawing Cisco network diagrams.
The symbols example "Cisco products additional - Vector stencils library" was created using the ConceptDraw PRO diagramming and vector drawing software extended with the Cisco Network Diagrams solution from the Computer and Networks area of ConceptDraw Solution Park.
www.conceptdraw.com/ solution-park/ computer-networks-cisco
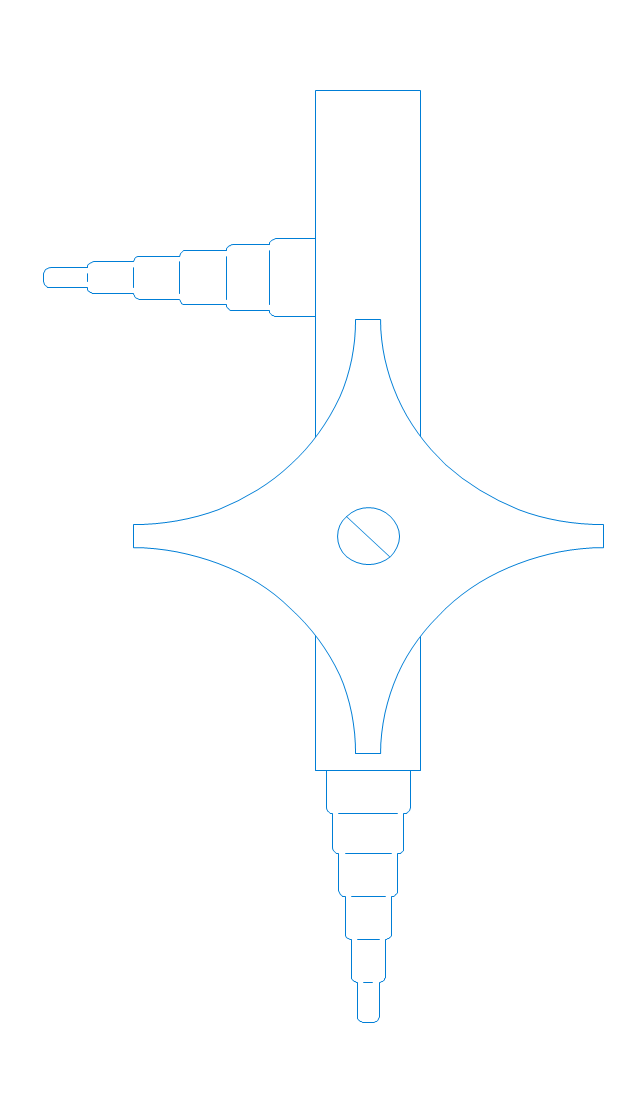
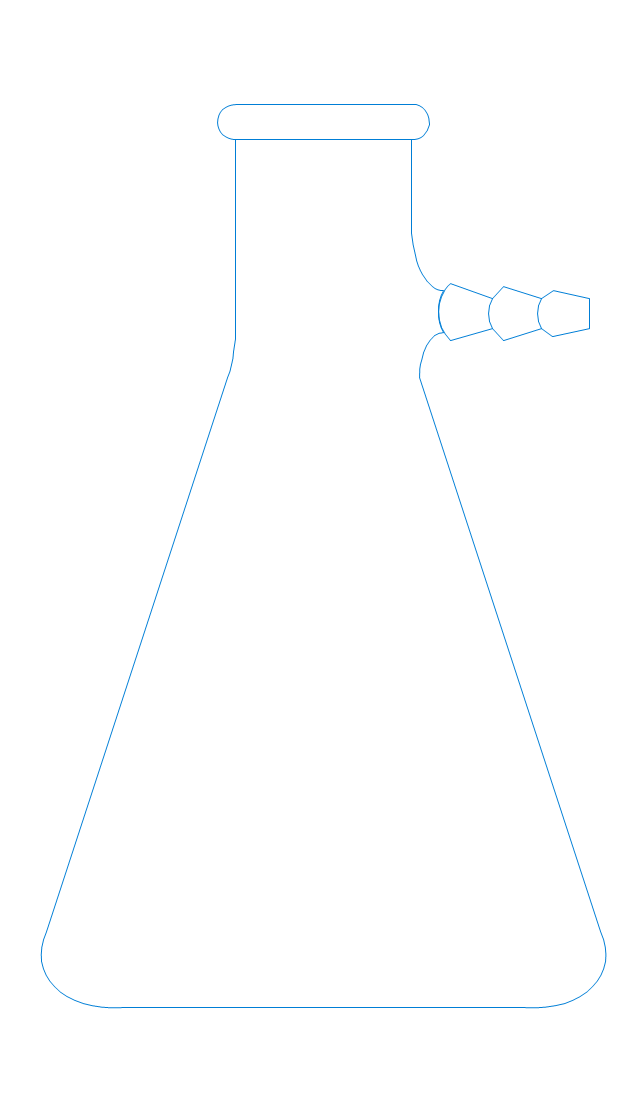
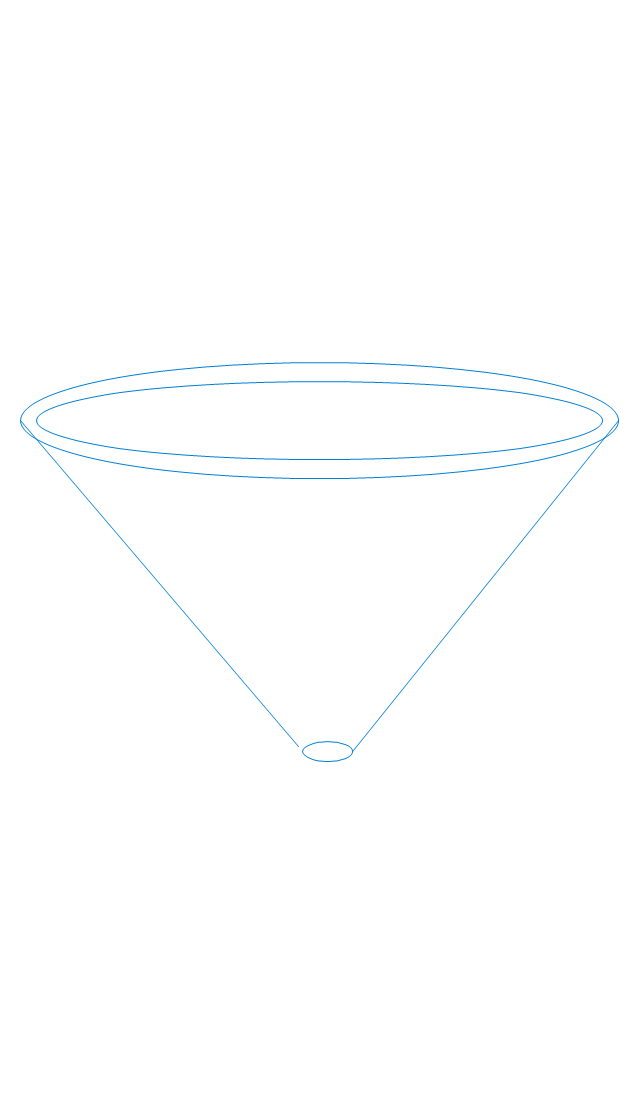
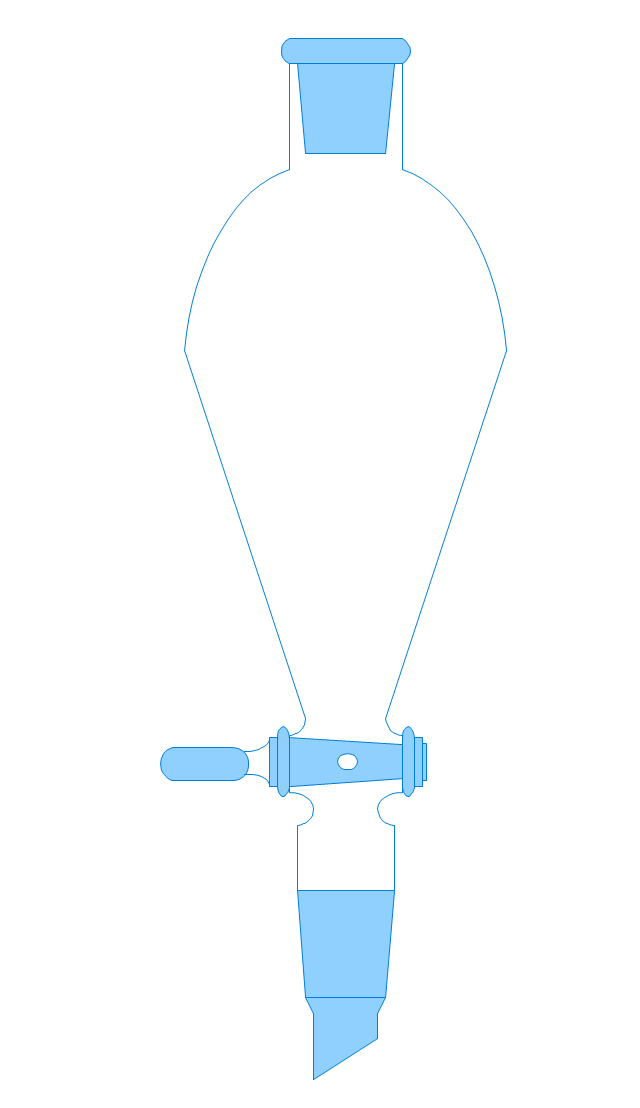
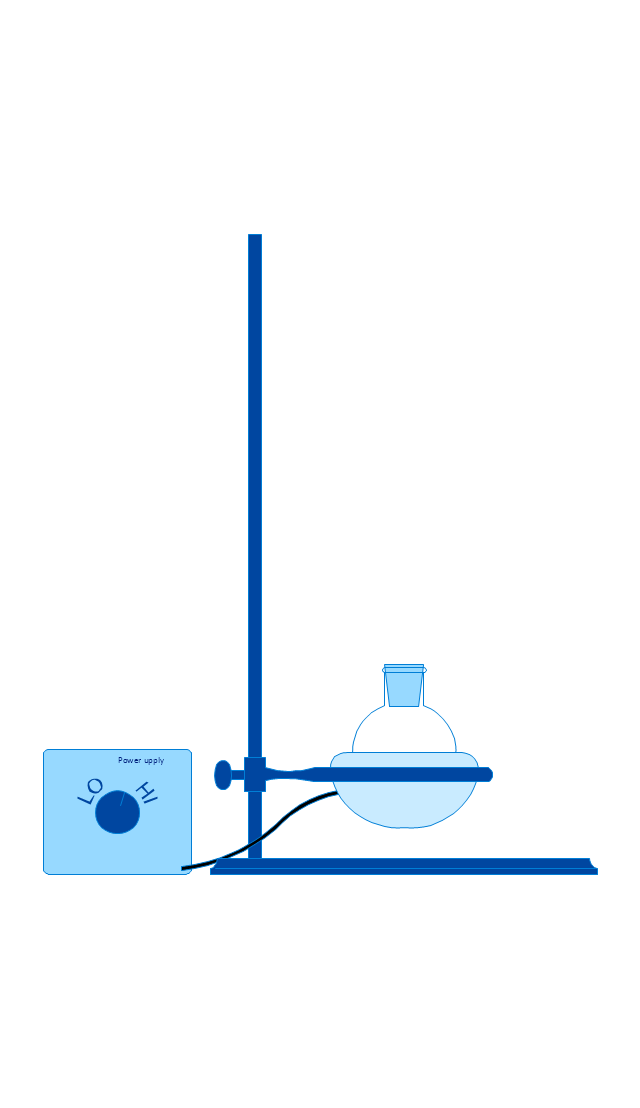
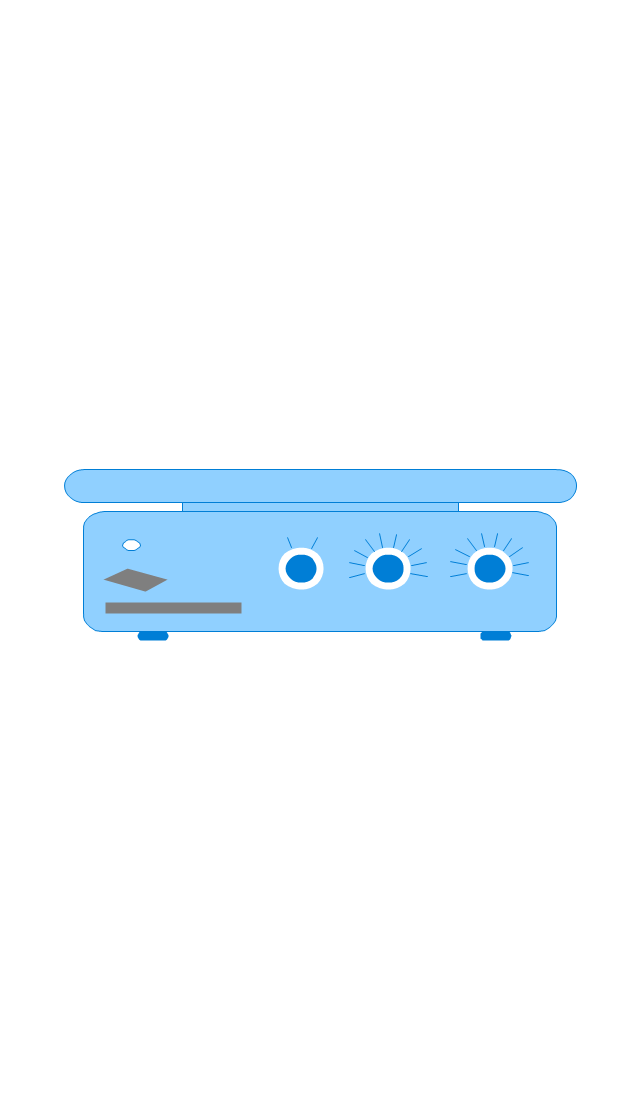
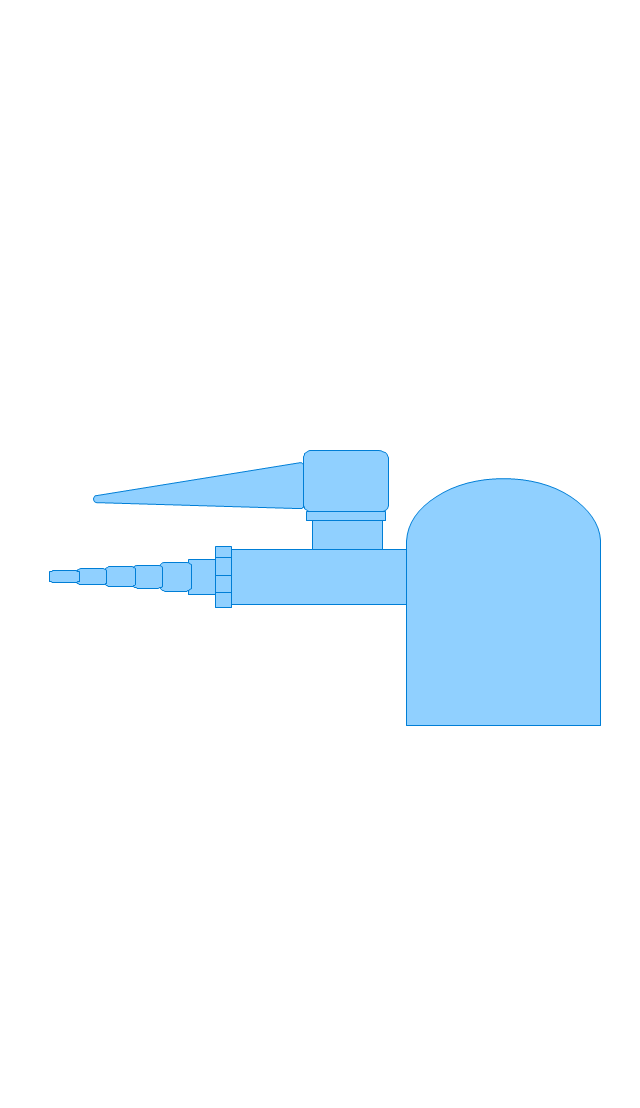
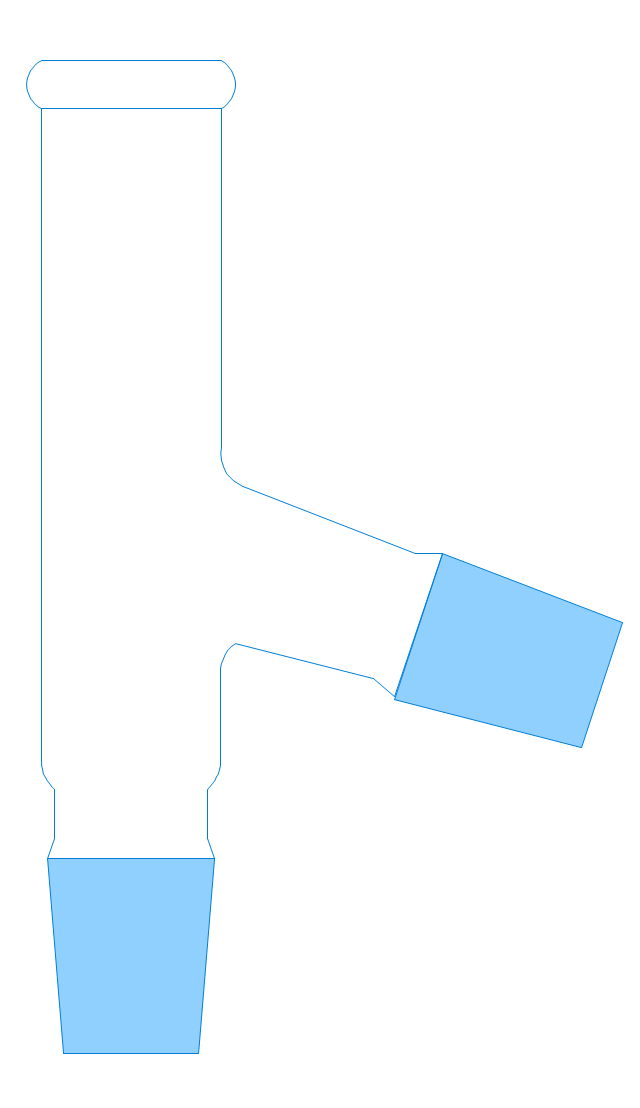
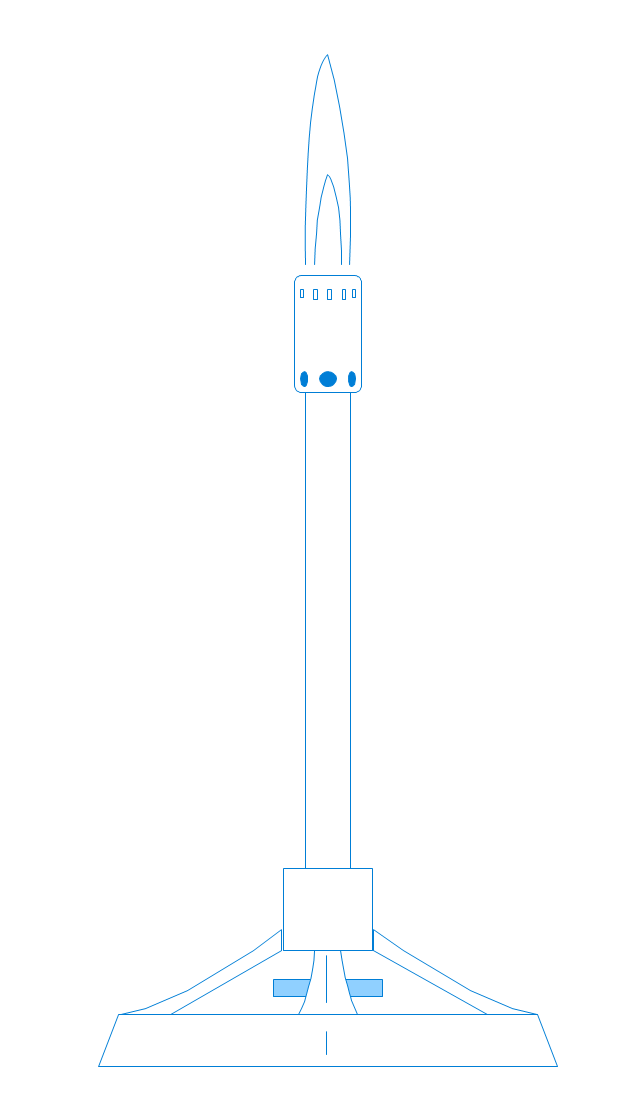
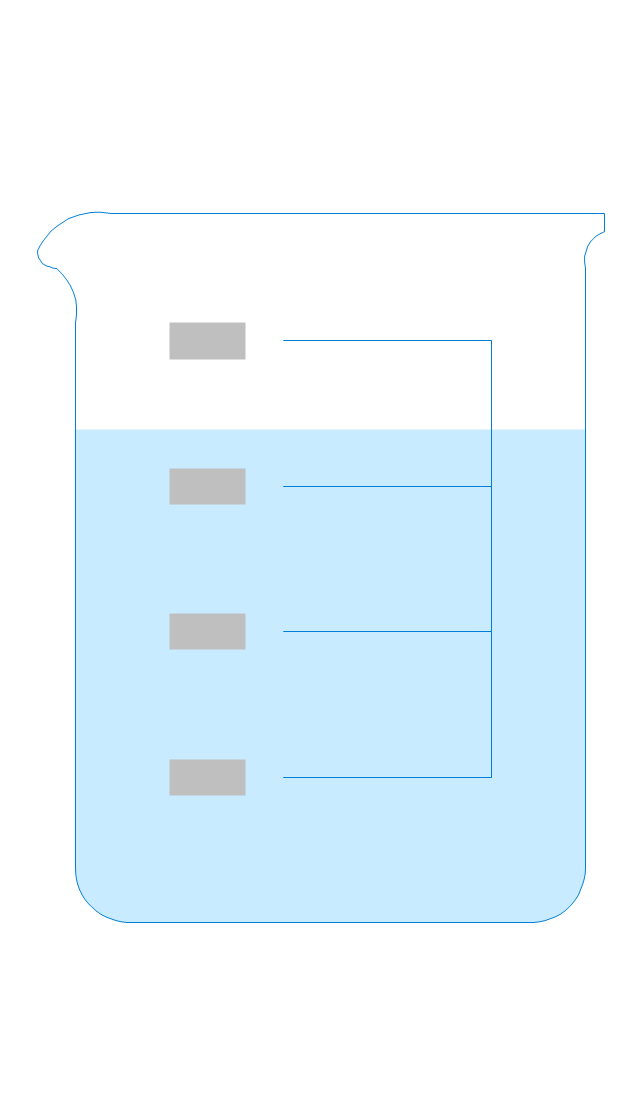
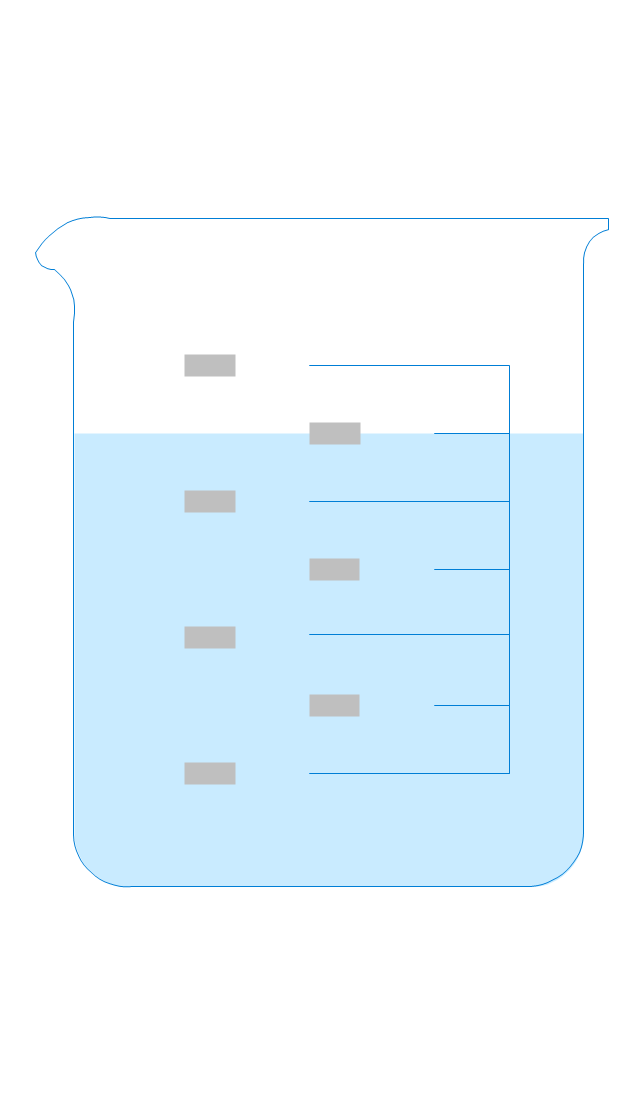
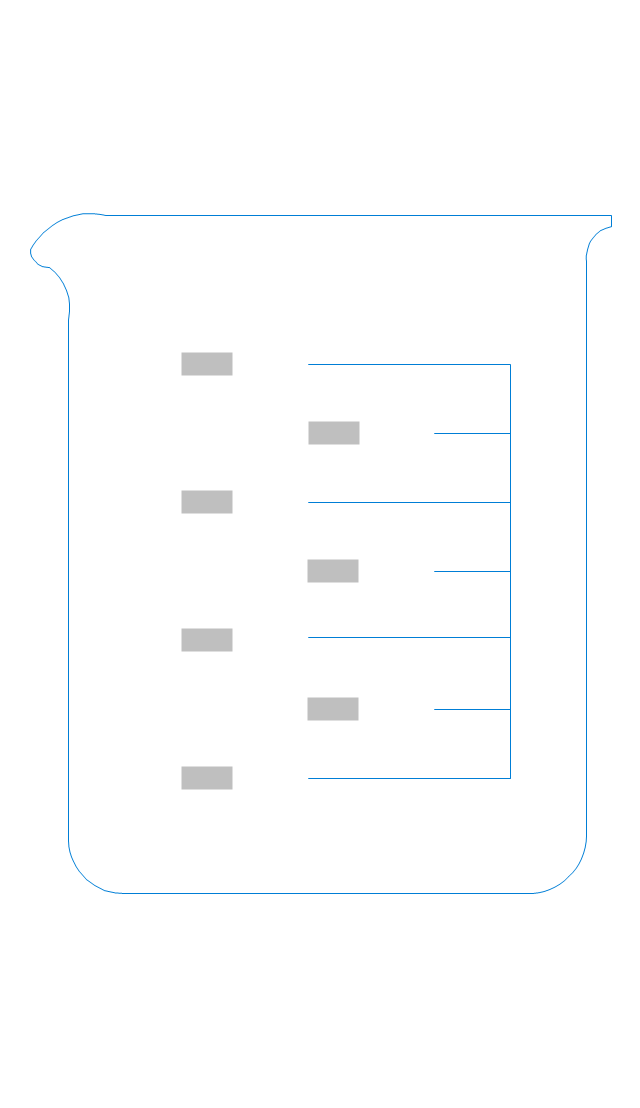
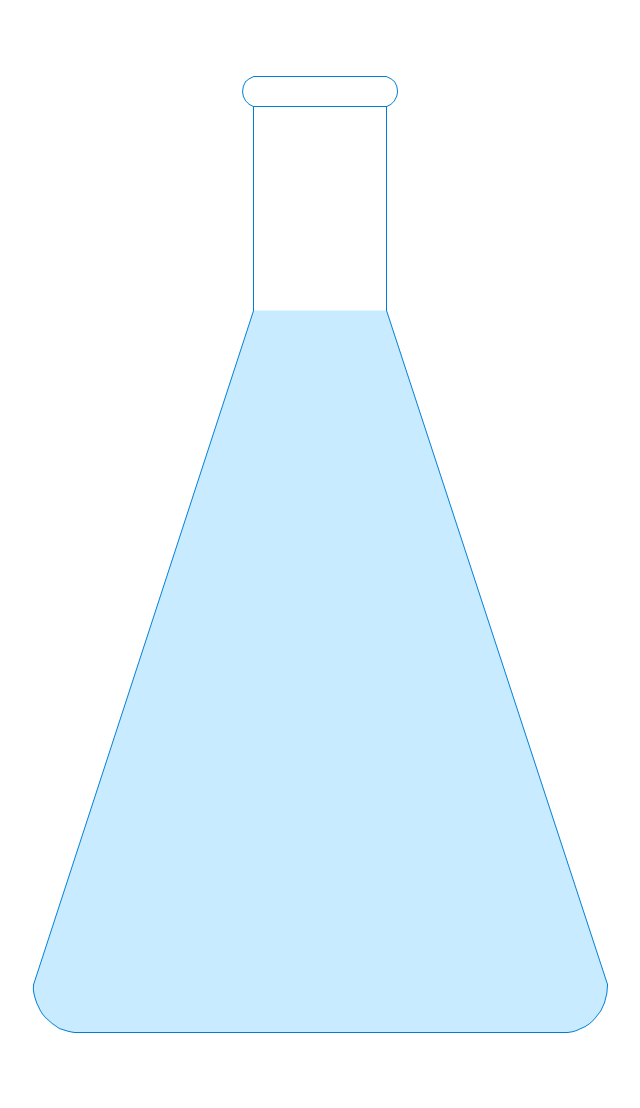
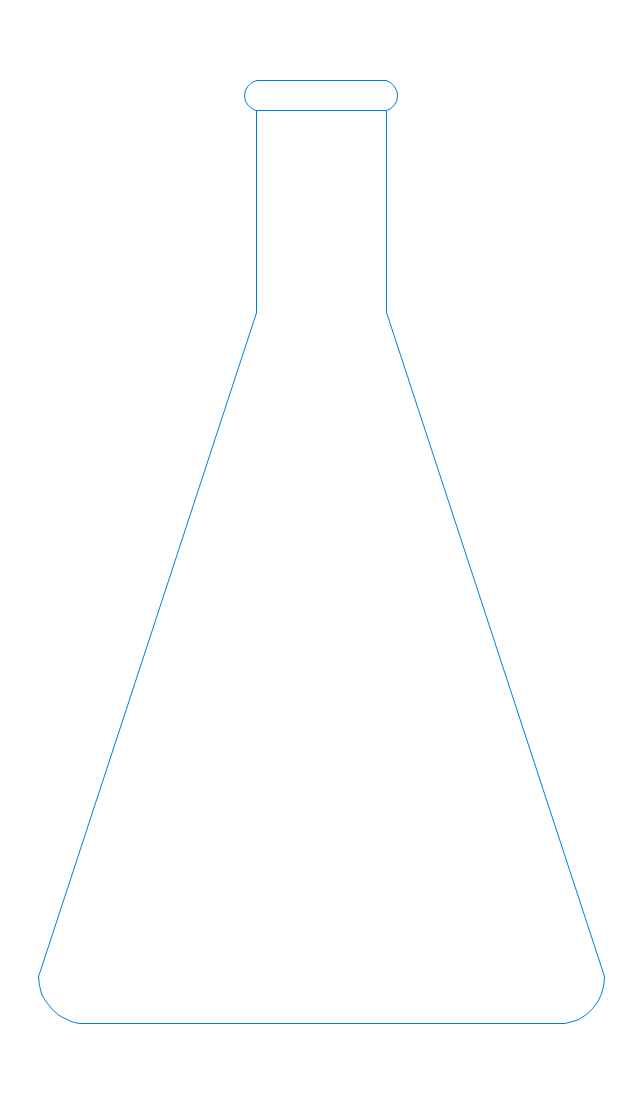
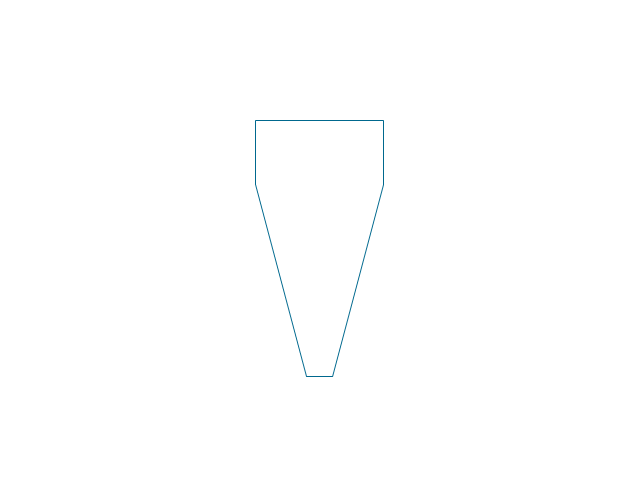
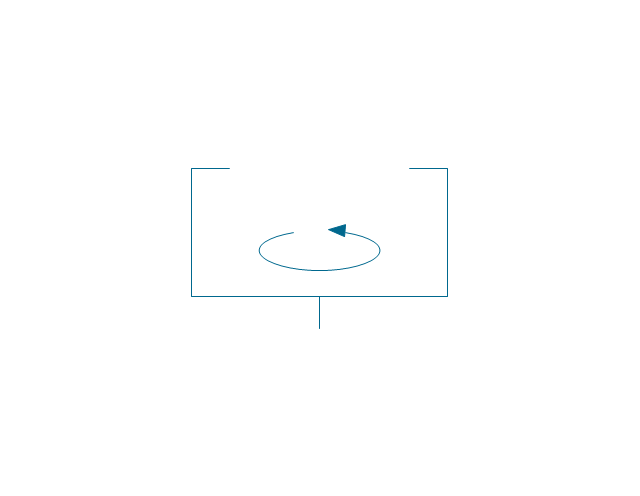
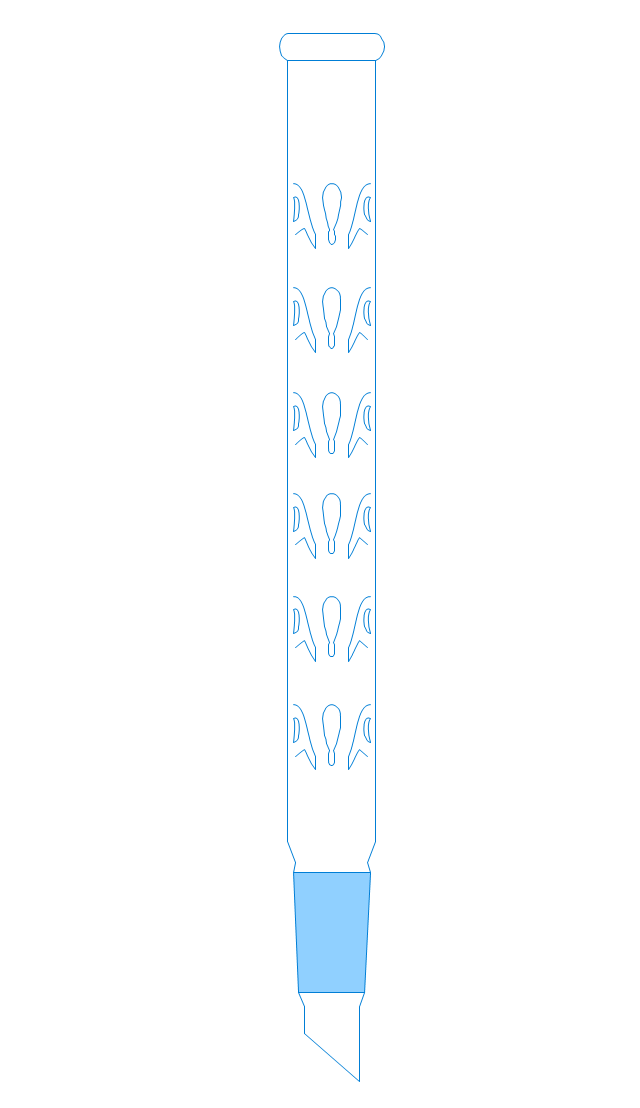
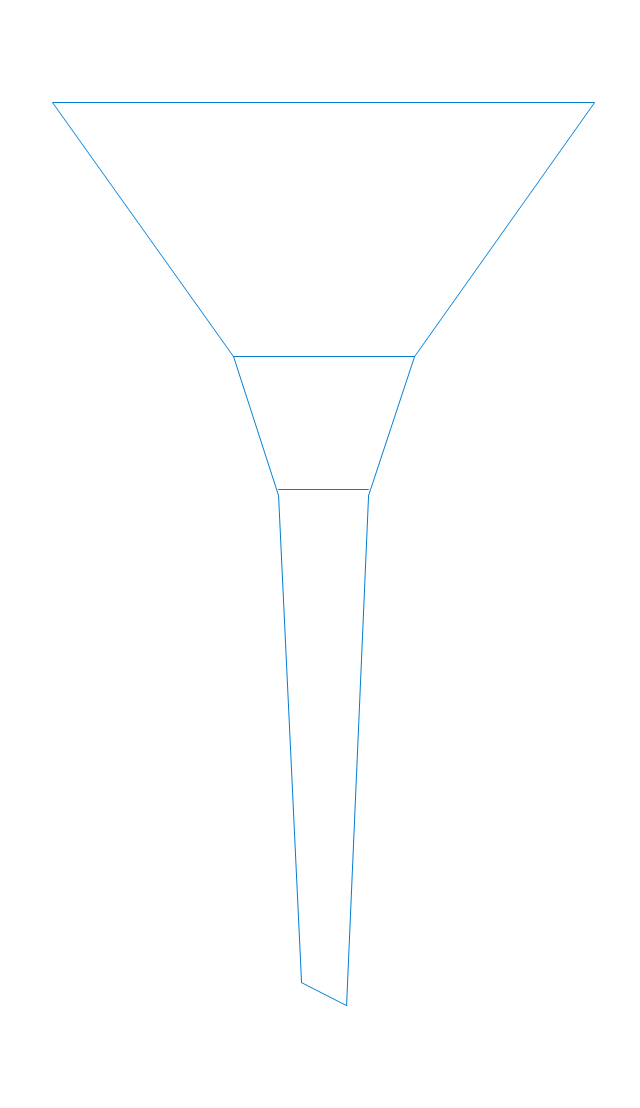
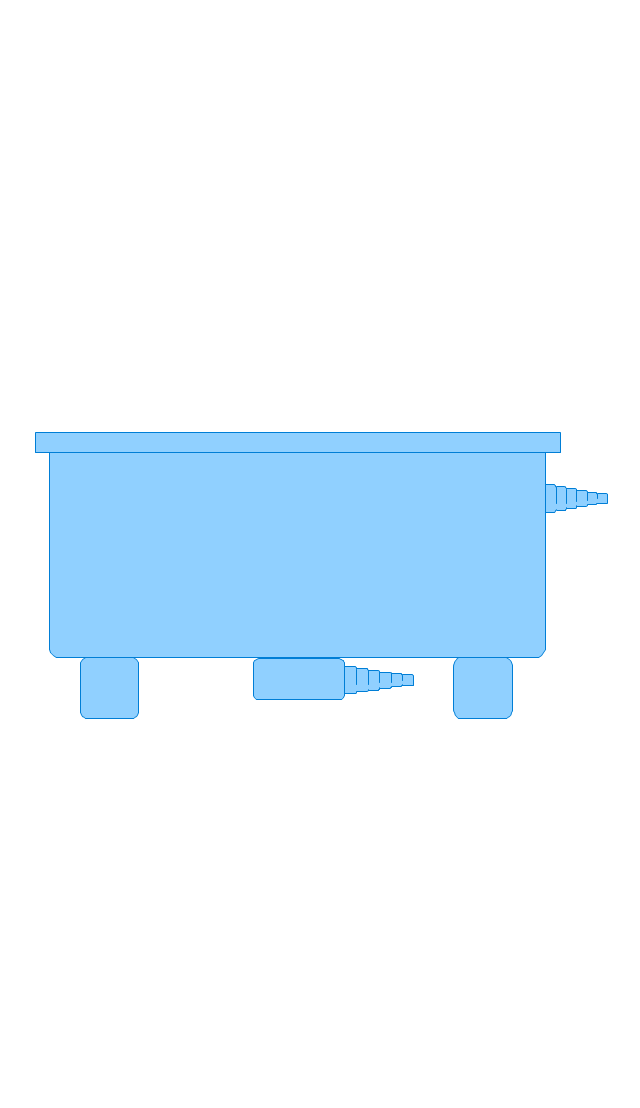
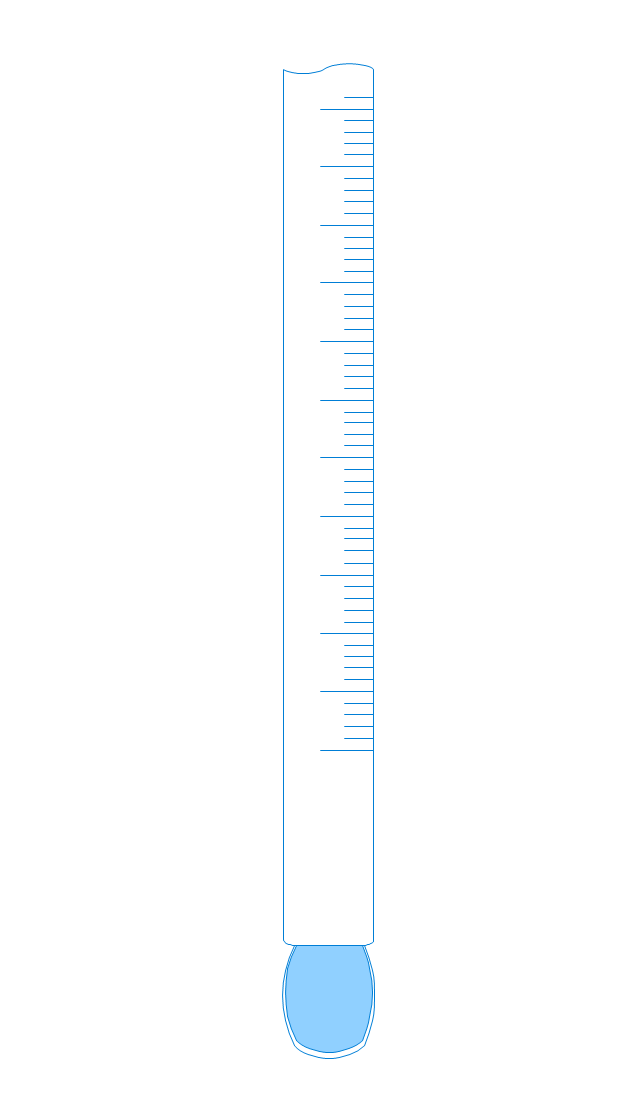
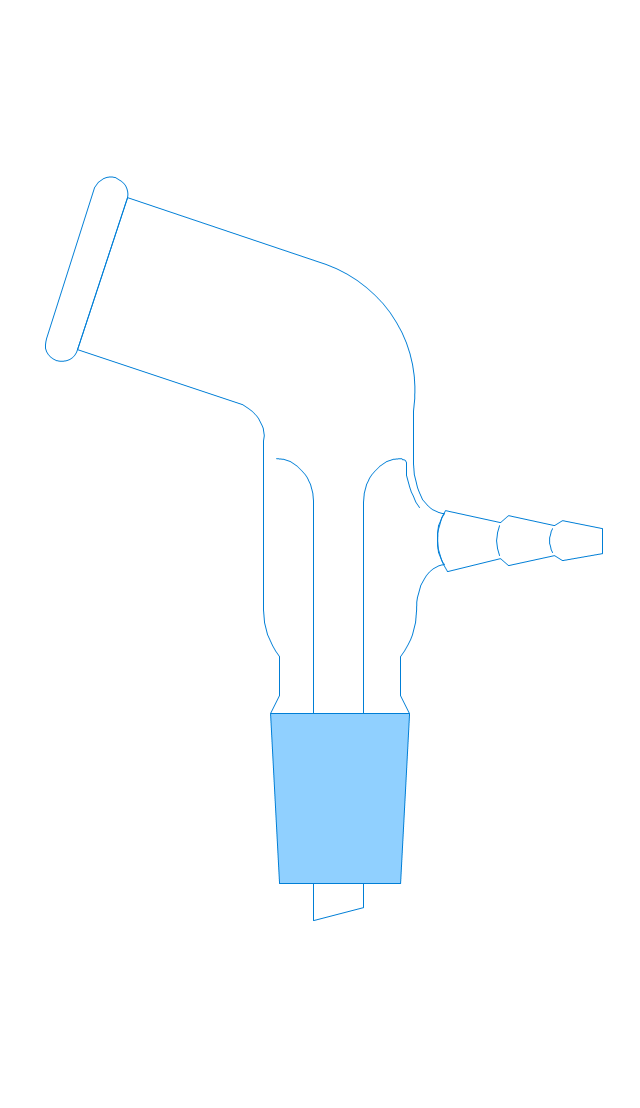
The vector stencils library "Laboratory equipment" contains 31 clipart icons of chemical laboratory equipment and labware.
Use these shapes for drawing part assembly and mounting schemes of glassware apparatus in chemical experiment diagrams and illustrations in the ConceptDraw PRO diagramming and vector drawing software extended with the Chemistry solution from the Science and Education area of ConceptDraw Solution Park.
Use these shapes for drawing part assembly and mounting schemes of glassware apparatus in chemical experiment diagrams and illustrations in the ConceptDraw PRO diagramming and vector drawing software extended with the Chemistry solution from the Science and Education area of ConceptDraw Solution Park.
The vector stencils library "VHF UHF SHF" contains 52 symbols for VHF, UHF, and SHF circuit design, including capacitance measurers, nonreciprocal devices, modulators, phase shifters, field polarization devices, and filters.
"Very high frequency (VHF) is the ITU-designated range of radio frequency electromagnetic waves from 30 MHz to 300 MHz, with corresponding wavelengths of one to ten meters. Frequencies immediately below VHF are denoted high frequency (HF), and the next higher frequencies are known as ultra high frequency (UHF).
Common uses for VHF are FM radio broadcasting, television broadcasting, land mobile stations (emergency, business, private use and military), long range data communication up to several tens of kilometres with radio modems, amateur radio, and marine communications. Air traffic control communications and air navigation systems (e.g. VOR, DME & ILS) work at distances of 100 kilometres or more to aircraft at cruising altitude.
VHF was previously used for analog television stations in the US." [Very high frequency. Wikipedia]
"Ultra-high frequency (UHF) designates the ITU radio frequency range of electromagnetic waves between 300 MHz and 3 GHz (3,000 MHz), also known as the decimetre band or decimetre wave as the wavelengths range from one to ten decimetres; that is 1 decimetre to 1 metre. Radio waves with frequencies above the UHF band fall into the SHF (super-high frequency) or microwave frequency range. Lower frequency signals fall into the VHF (very high frequency) or lower bands. UHF radio waves propagate mainly by line of sight; they are blocked by hills and large buildings although the transmission through building walls is high enough for indoor reception. They are used for television broadcasting (digital and analogue), cordless phones, walkie-talkies, satellite communication, and numerous other applications.
The IEEE defines the UHF radar band as frequencies between 300 MHz and 1 GHz. Two other IEEE radar band overlap the ITU UHF band: the L band between 1 and 2 GHz and the S band between 2 and 4 GHz." [Ultra high frequency. Wikipedia]
"Super high frequency (or SHF) is the ITU designation for radio frequencies (RF) in the range of 3 GHz and 30 GHz. This band of frequencies is also known as the centimetre band or centimetre wave as the wavelengths range from ten to one centimetres. These frequencies fall within the microwave band, so radio waves with these frequencies are called microwaves. The small wavelength of microwaves allows them to be directed in narrow beams by aperture antennas such as parabolic dishes, so they are used for point-to-point communication and data links, and for radar. This frequency range is used for most radar transmitters, microwave ovens, wireless LANs, cell phones, satellite communication, microwave radio relay links, and numerous short range terrestrial data links. The commencing wireless USB technology will be using approximately 1/ 3 of this spectrum.
Frequencies in the SHF range are often referred to by their IEEE radar band designations: S, C, X, Ku, K, or Ka band, or by similar NATO or EU designations." [Super high frequency. Wikipedia]
The shapes example "Design elements - VHF UHF SHF" was drawn using the ConceptDraw PRO diagramming and vector drawing software extended with the Electrical Engineering solution from the Engineering area of ConceptDraw Solution Park.
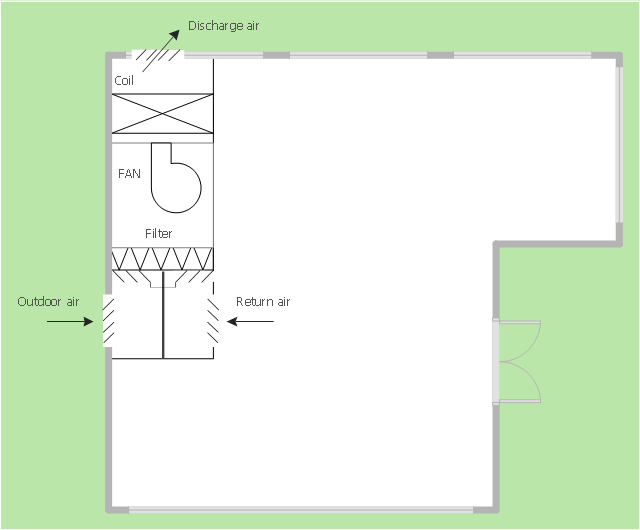
"An air handler, or air handling unit (often abbreviated to AHU), is a device used to condition and circulate air as part of a heating, ventilating, and air-conditioning (HVAC) system. An air handler is usually a large metal box containing a blower, heating or cooling elements, filter racks or chambers, sound attenuators, and dampers. Air handlers usually connect to a ductwork ventilation system that distributes the conditioned air through the building and returns it to the AHU. Sometimes AHUs discharge (supply) and admit (return) air directly to and from the space served without ductwork.
Small air handlers, for local use, are called terminal units, and may only include an air filter, coil, and blower; these simple terminal units are called blower coils or fan coil units. A larger air handler that conditions 100% outside air, and no recirculated air, is known as a makeup air unit (MAU). An air handler designed for outdoor use, typically on roofs, is known as a packaged unit (PU) or rooftop unit (RTU)." [Air handler. Wikipedia]
The floor plan example "Air handler - HVAC plan" was created using the ConceptDraw PRO diagramming and vector drawing software extended with the HVAC Plans solution from the Building Plans area of ConceptDraw Solution Park.
The vector stencils library "Laboratory equipment" contains 31 clipart icons of chemical laboratory equipment and labware.
Use these shapes for drawing part assembly and mounting schemes of glassware apparatus in chemical experiment diagrams and illustrations in the ConceptDraw PRO diagramming and vector drawing software extended with the Chemistry solution from the Science and Education area of ConceptDraw Solution Park.
Use these shapes for drawing part assembly and mounting schemes of glassware apparatus in chemical experiment diagrams and illustrations in the ConceptDraw PRO diagramming and vector drawing software extended with the Chemistry solution from the Science and Education area of ConceptDraw Solution Park.
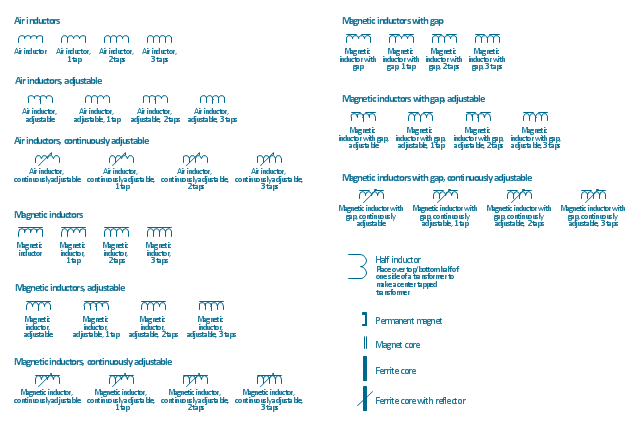
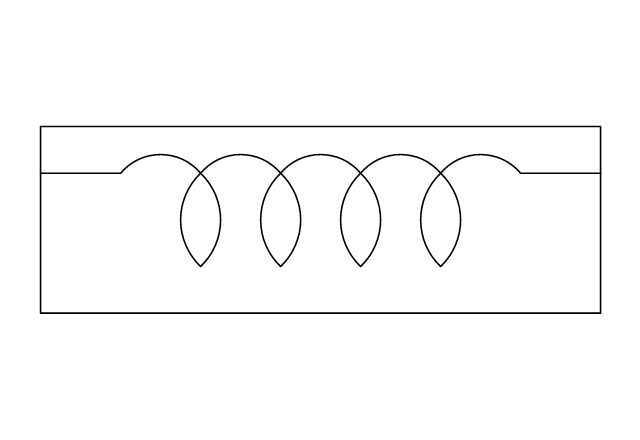
The vector stencils library "Inductors" contains 41 symbols of inductor elements for drawing electronic circuit diagrams.
"An inductor, also called a coil or reactor, is a passive two-terminal electrical component which resists changes in electric current passing through it. It consists of a conductor such as a wire, usually wound into a coil. When a current flows through it, energy is stored temporarily in a magnetic field in the coil. When the current flowing through an inductor changes, the time-varying magnetic field induces a voltage in the conductor, according to Faraday’s law of electromagnetic induction, which opposes the change in current that created it.
An inductor is characterized by its inductance, the ratio of the voltage to the rate of change of current, which has units of henries (H). Inductors have values that typically range from 1 µH (10-6H) to 1 H. Many inductors have a magnetic core made of iron or ferrite inside the coil, which serves to increase the magnetic field and thus the inductance. Along with capacitors and resistors, inductors are one of the three passive linear circuit elements that make up electric circuits. Inductors are widely used in alternating current (AC) electronic equipment, particularly in radio equipment. They are used to block the flow of AC current while allowing DC to pass; inductors designed for this purpose are called chokes. They are also used in electronic filters to separate signals of different frequencies, and in combination with capacitors to make tuned circuits, used to tune radio and TV receivers." [Inductor. Wikipedia]
The symbols example "Design elements - Inductors" was drawn using the ConceptDraw PRO diagramming and vector drawing software extended with the Electrical Engineering solution from the Engineering area of ConceptDraw Solution Park.
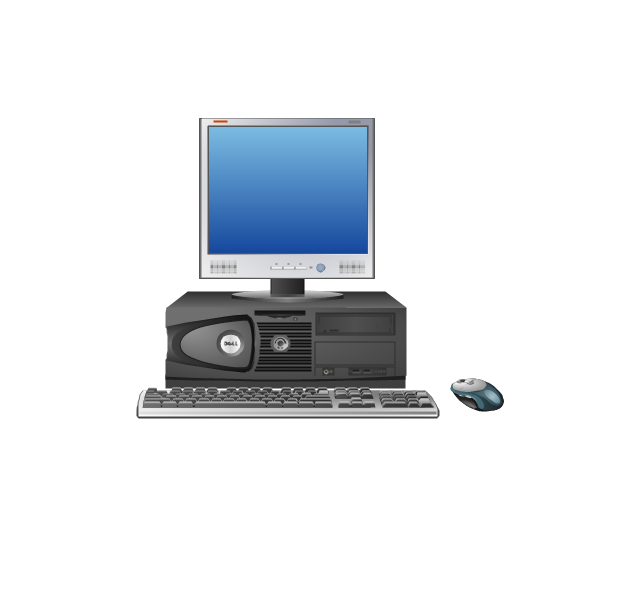
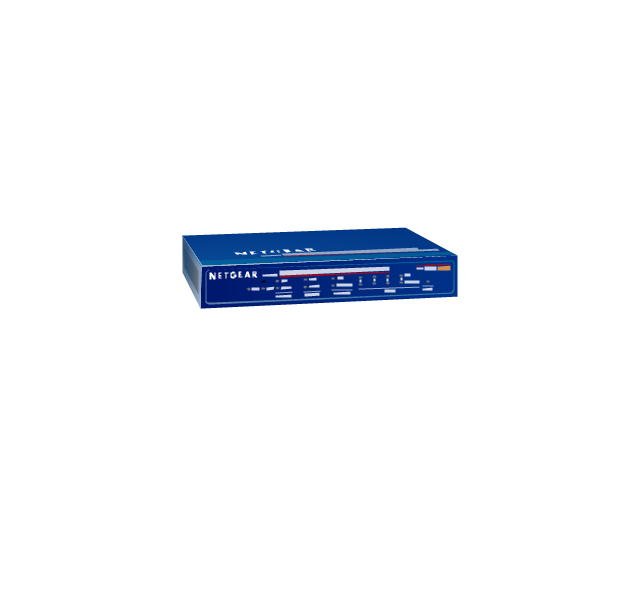
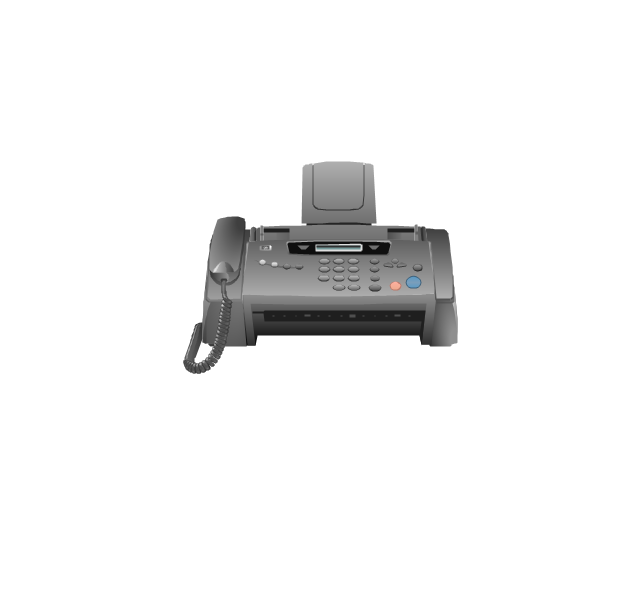
The vector stencils library "Computer network" contains 51 symbols of computer network devices and equipment for drawing computer network diagrams.
"Network Mapping Software.
A number of software tools exist to design computer network diagrams / or generate visual maps of networks, servers, storage, services, data centers, and other peripherals. Broadly, there are two types of software tools - those that help create diagrams manually and those that generate them using automated / semi-automated approaches.
Type of Software.
(1) Manual - allows users to design and draw logical and physical topology diagrams by manually placing icons and connections.
(2) Automated - generate topology diagrams / maps by traversing the network and automatically discovering resident devices or by importing network data." [Comparison of network diagram software. Wikipedia]
ConceptDraw PRO is the software for manual design of computer network diagrams. The solutions of the Computer and Networks area in ConceptDraw Solution Park extend ConceptDraw PRO with vector stencils libraries, templates and examples for creating the computer network diagrams.
The symbols example "Computer network - Vector stencils library" was created using the ConceptDraw PRO diagramming and vector drawing software extended with the Computer and Networks solution from the Computer and Networks area of ConceptDraw Solution Park.
www.conceptdraw.com/ solution-park/ computer-and-networks
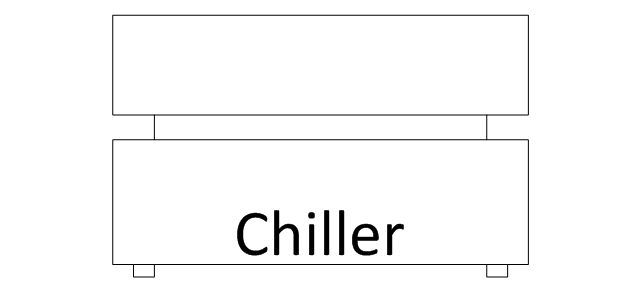
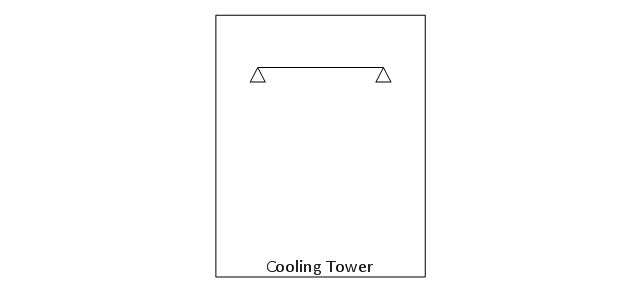
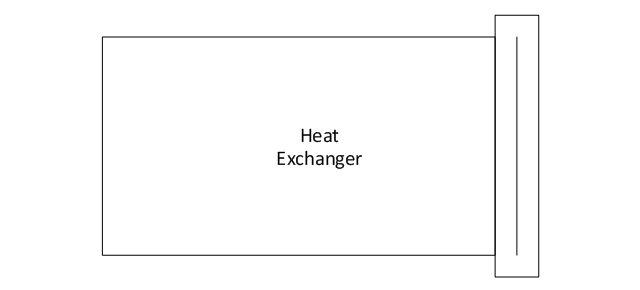
The vector stencils library "HVAC equipment" contains 26 symbols of HVAC equipment. Use it for drawing HVAC system diagrams, heating, ventilation, air conditioning, refrigeration, automated building control and environmental control system layout floor plans in the ConceptDraw PRO diagramming and vector drawing software extended with the HVAC Plans solution from the Building Plans area of ConceptDraw Solution Park.
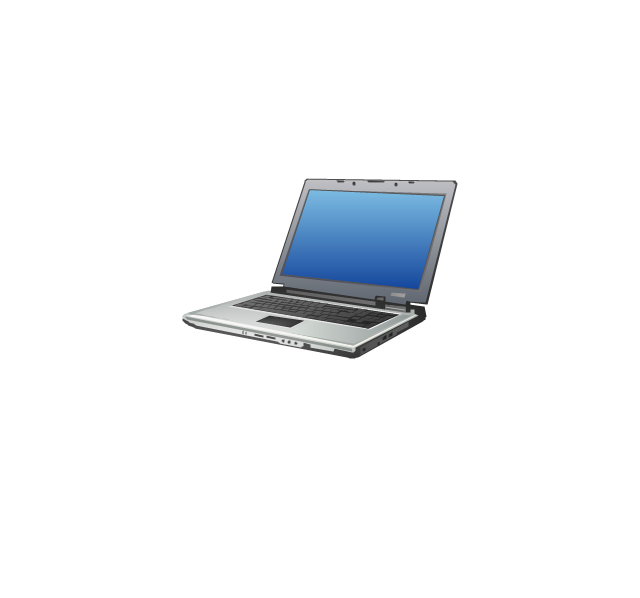
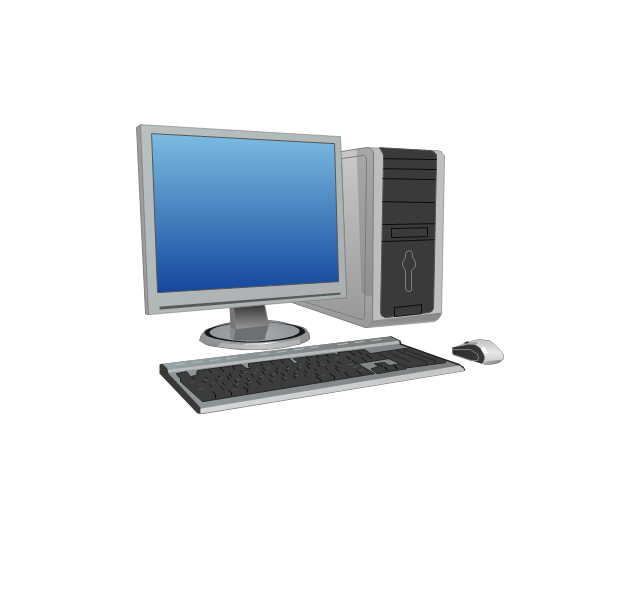
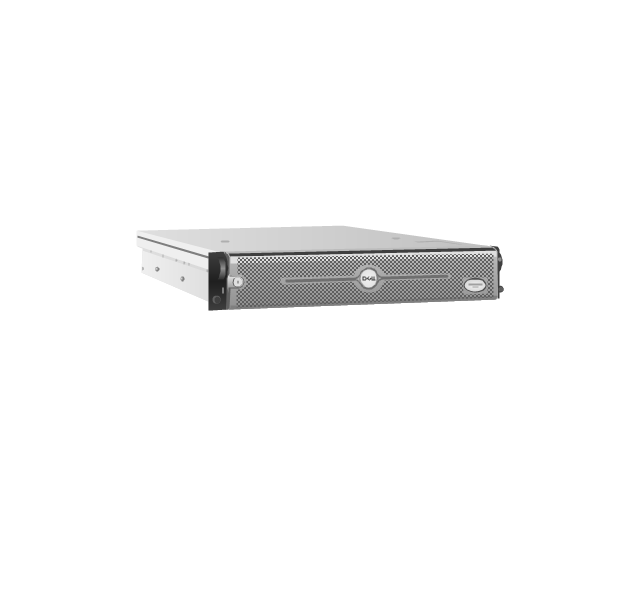
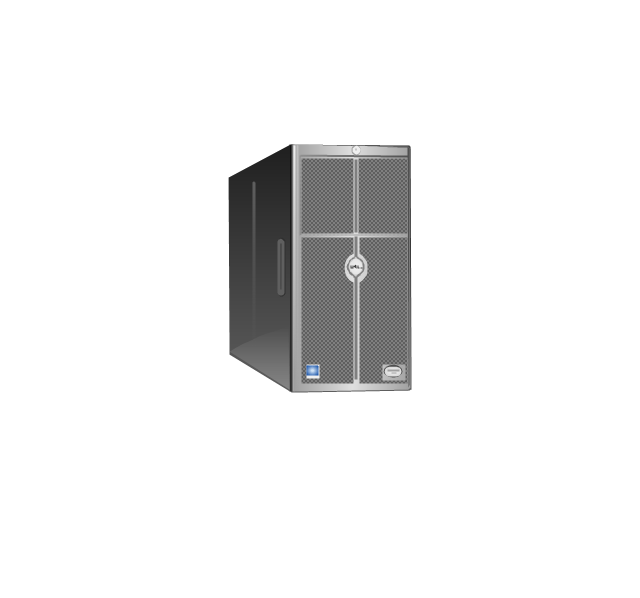
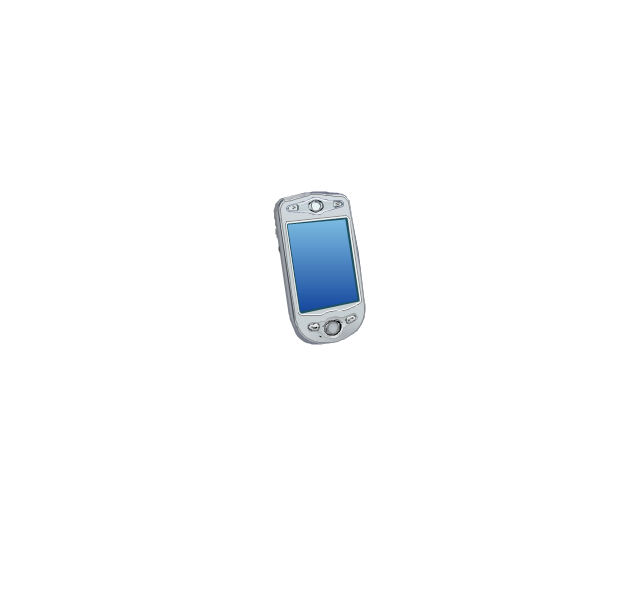
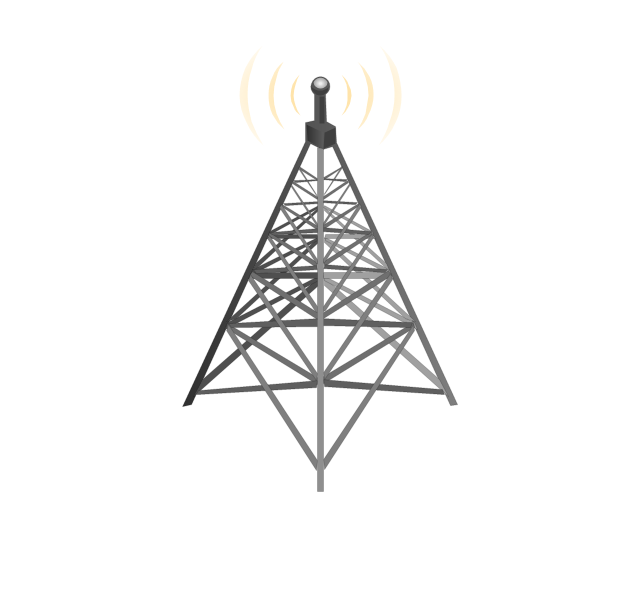
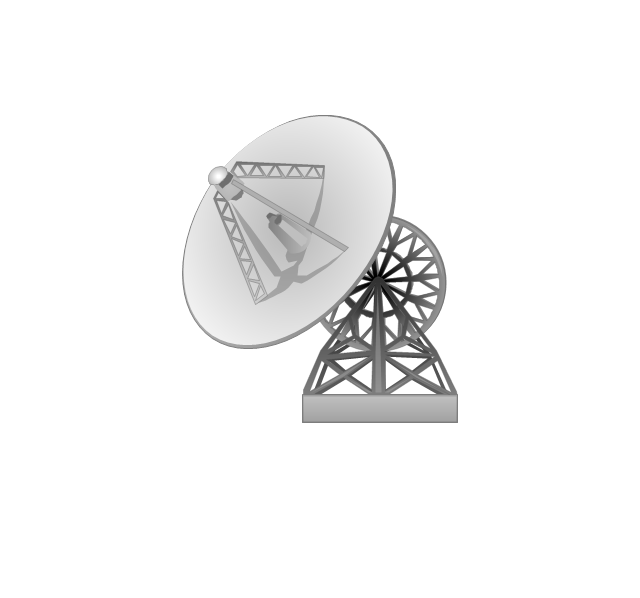
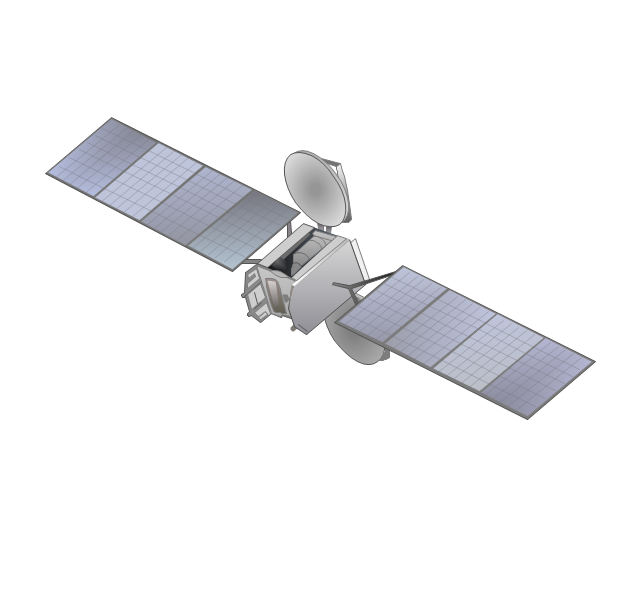
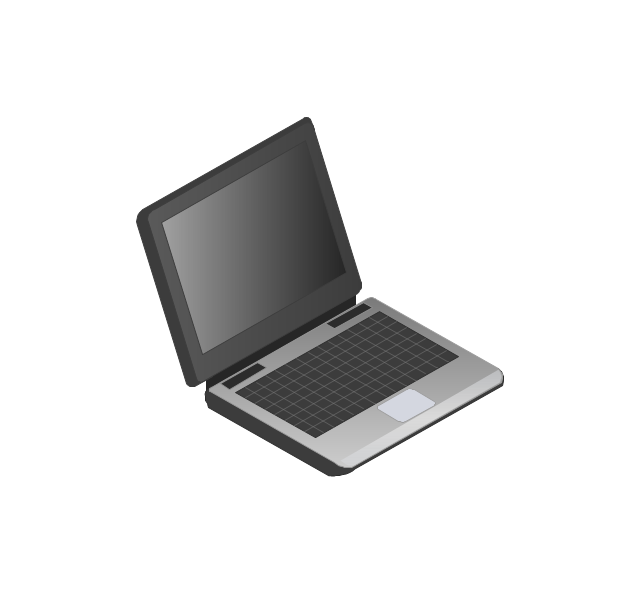
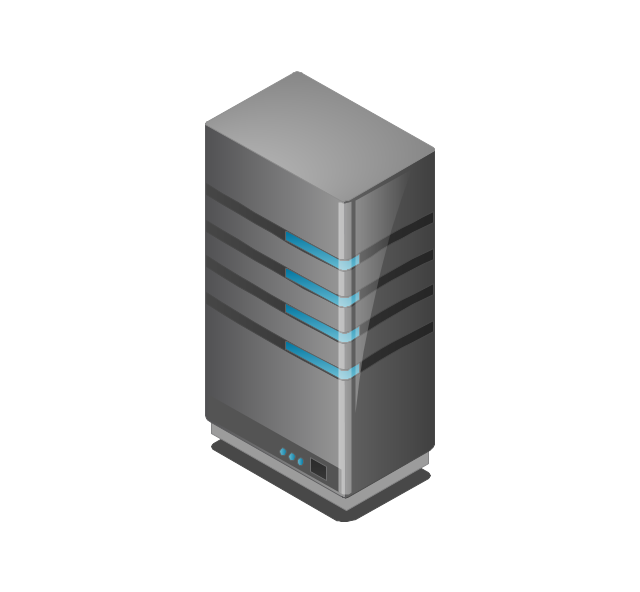
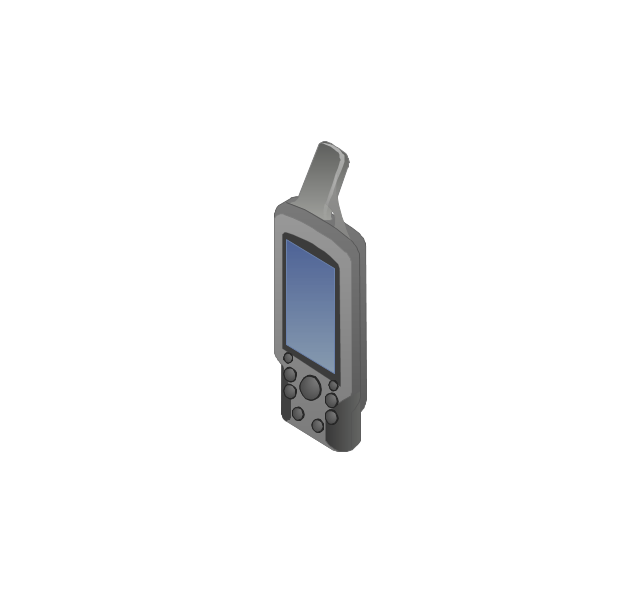
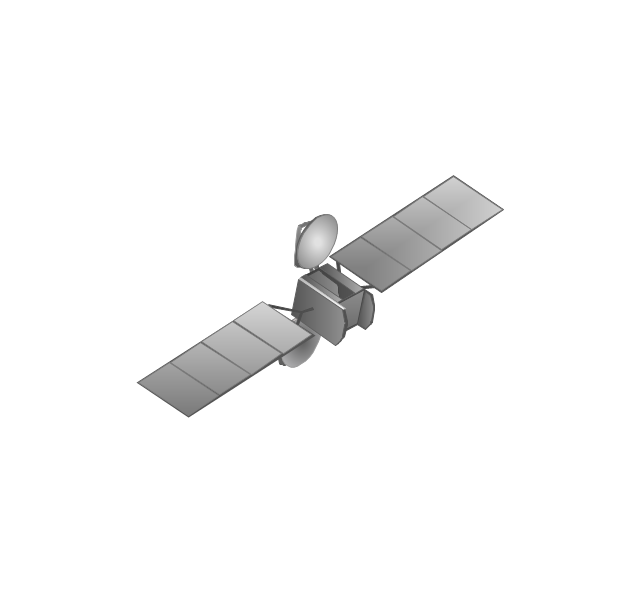
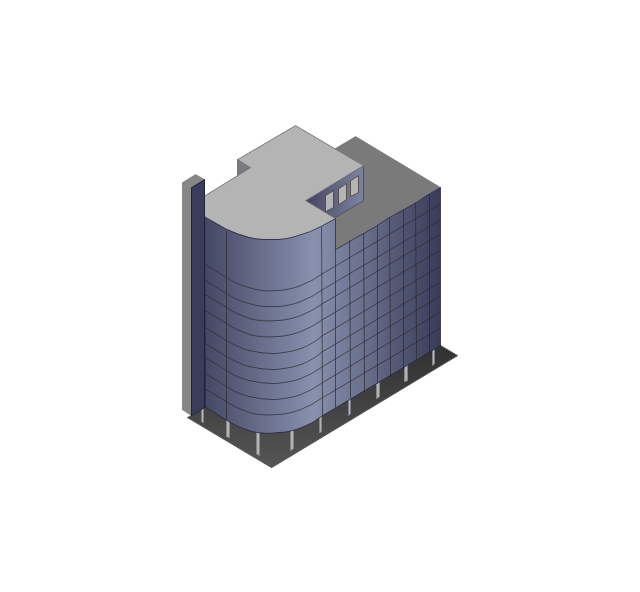
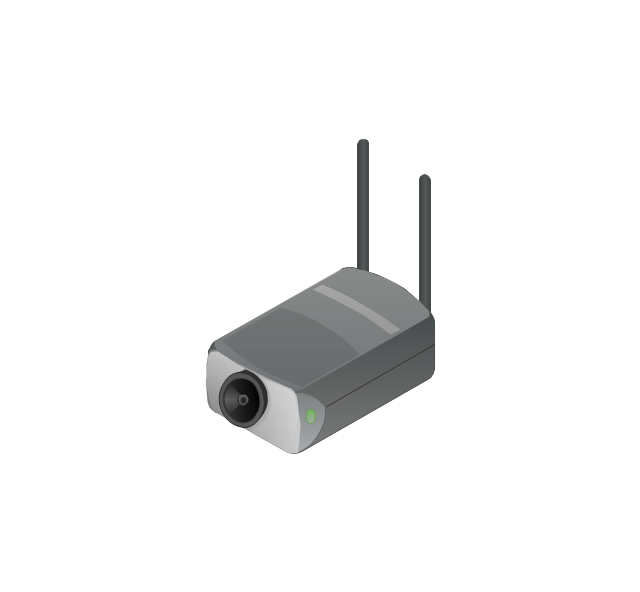
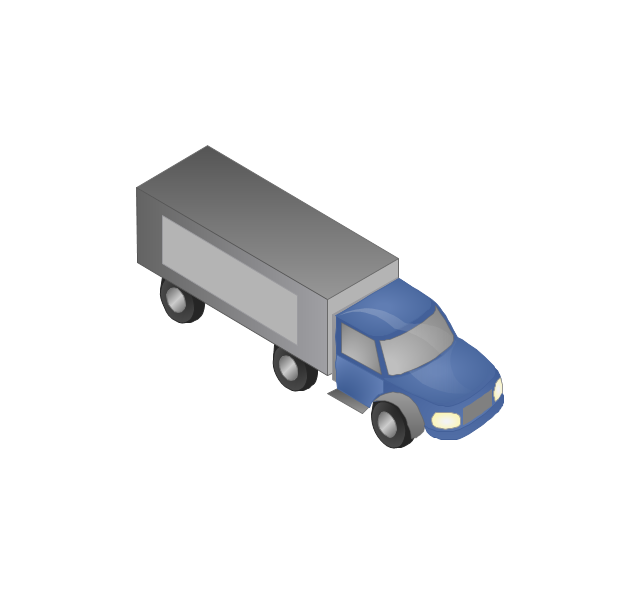
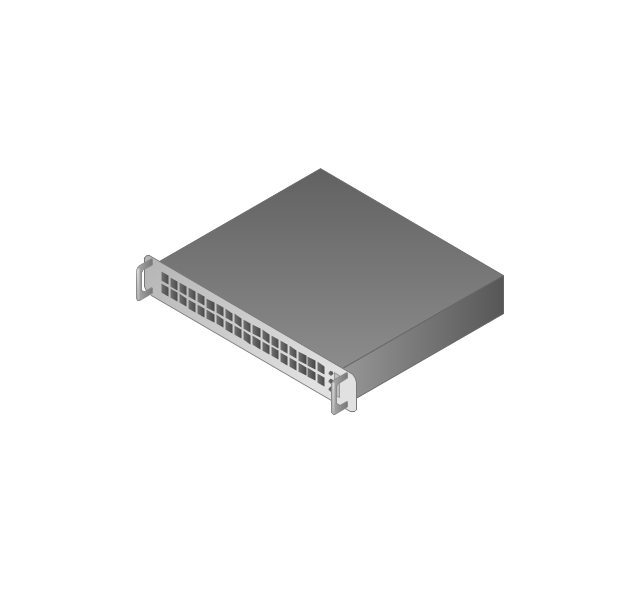
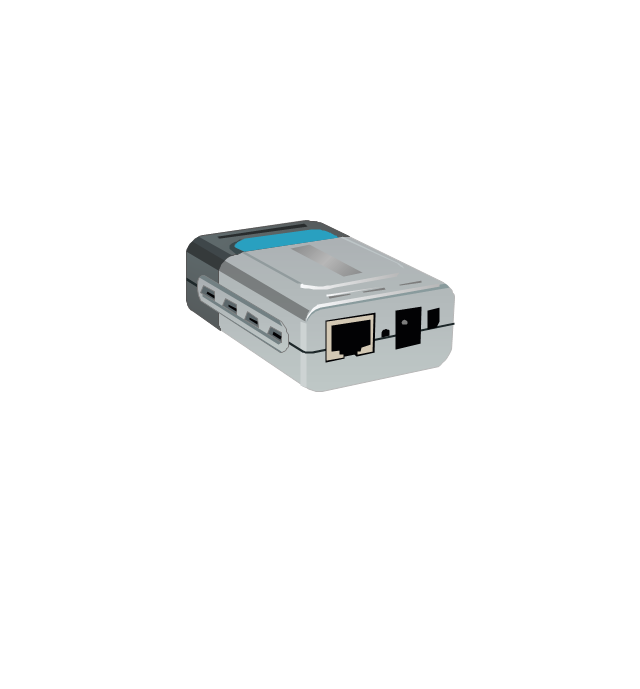
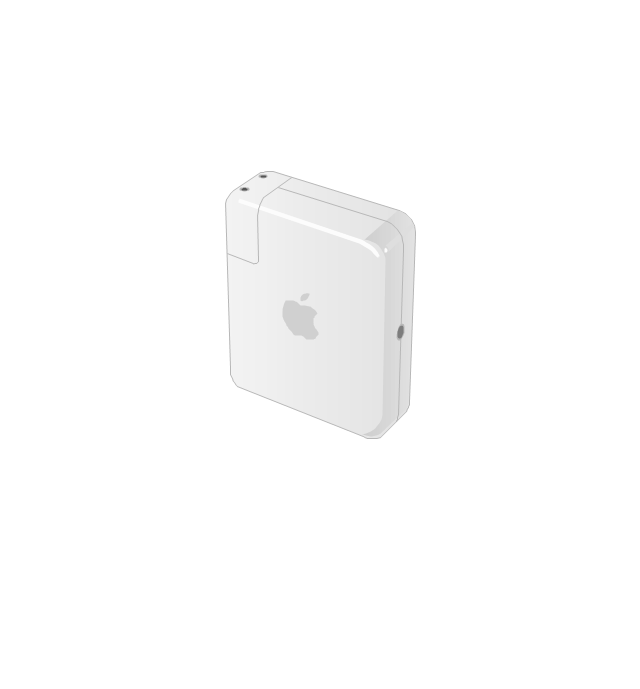
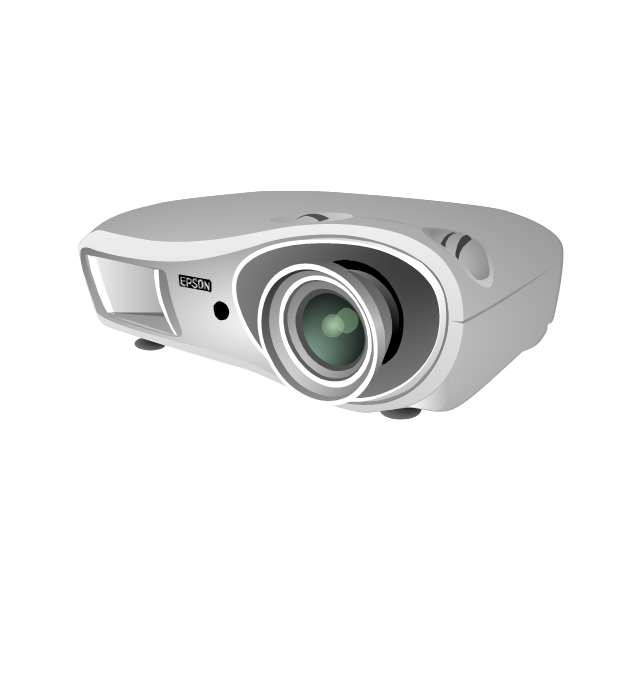
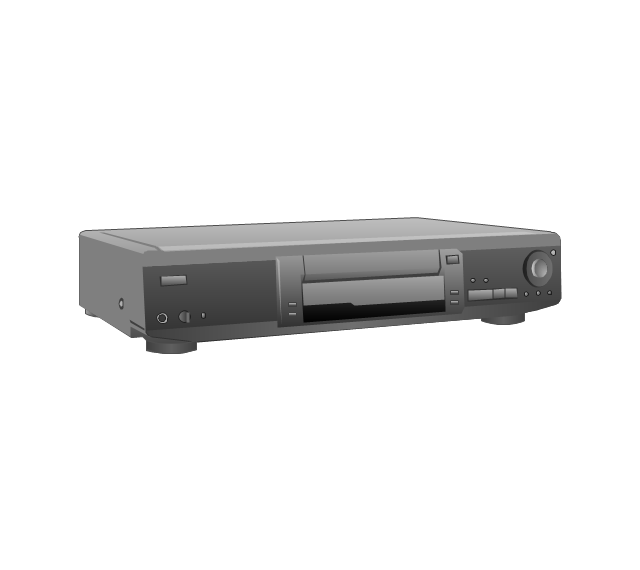
The vector stencils library "Computers and network isometric" contains 56 3D clipart images of computer and network devices and equipment for drawing network diagrams.
The clip art example "Computers and network isometric - Vector stencils library" was created using the ConceptDraw PRO diagramming and vector drawing software extended with the Computer and Networks solution from the Computer and Networks area of ConceptDraw Solution Park.
The clip art example "Computers and network isometric - Vector stencils library" was created using the ConceptDraw PRO diagramming and vector drawing software extended with the Computer and Networks solution from the Computer and Networks area of ConceptDraw Solution Park.
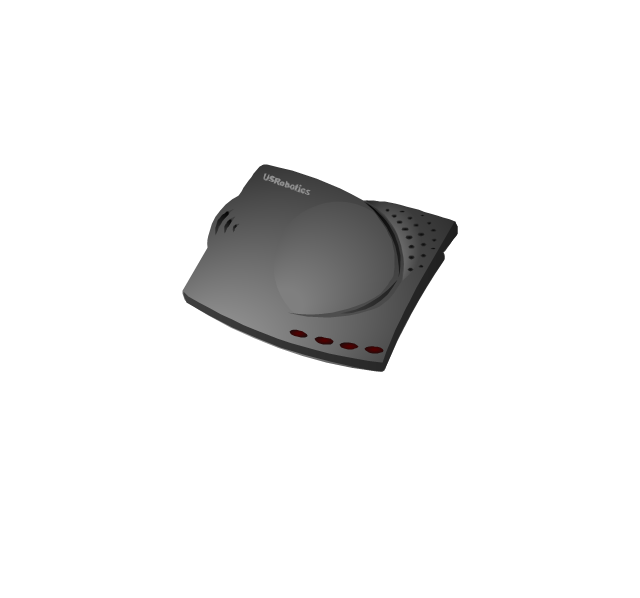
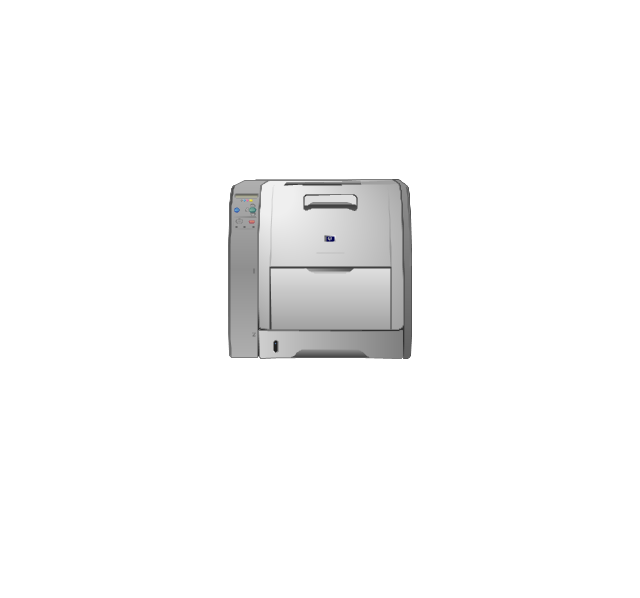
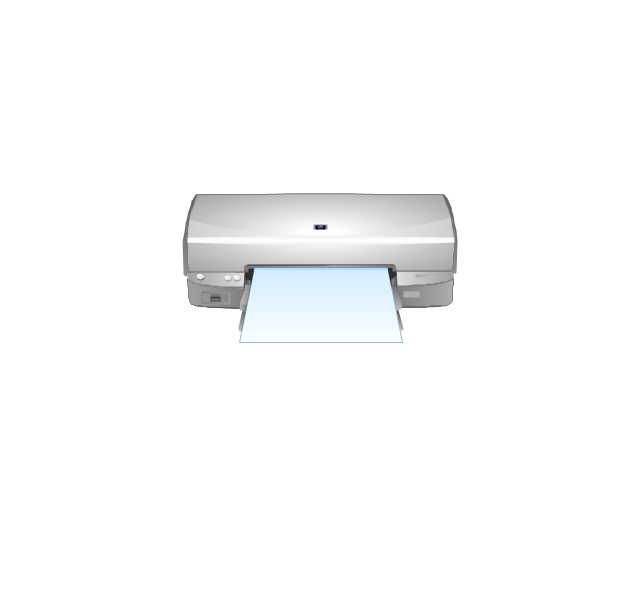
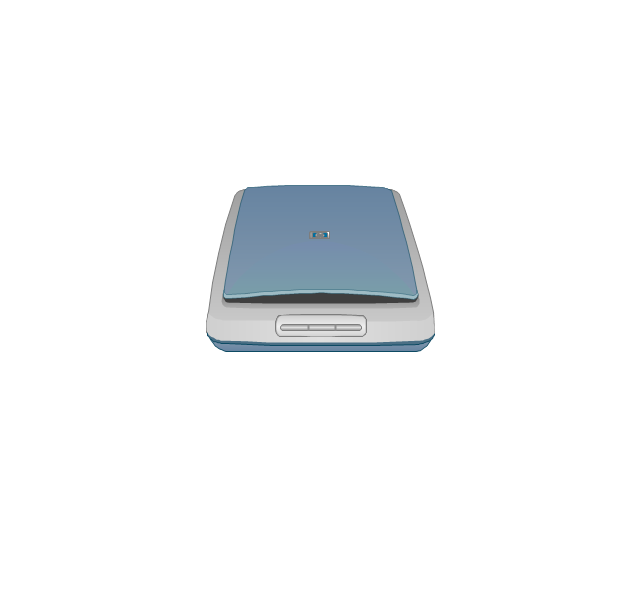
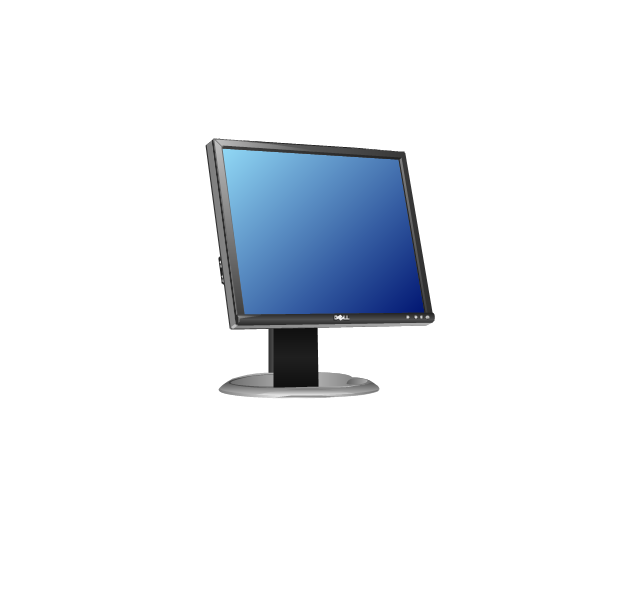
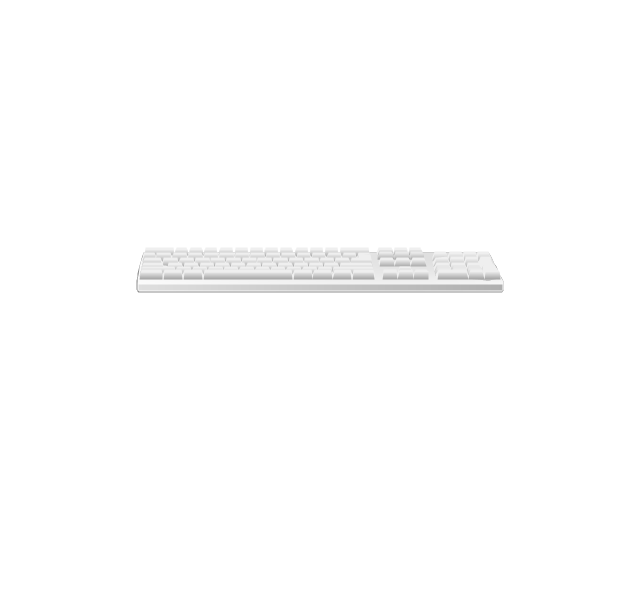
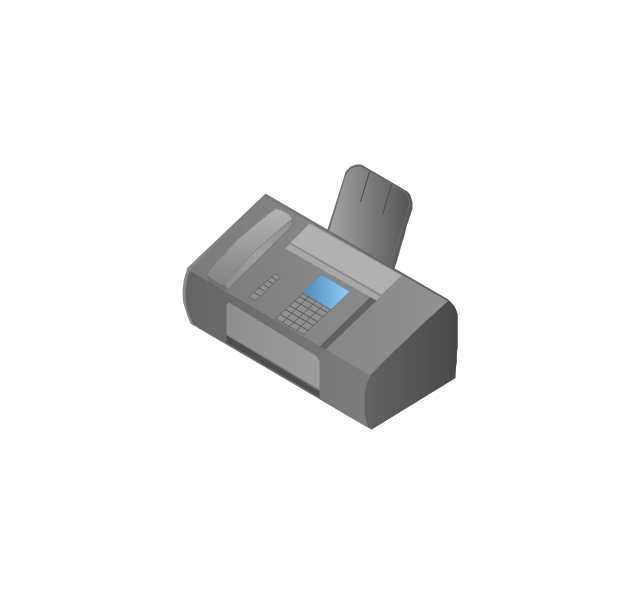
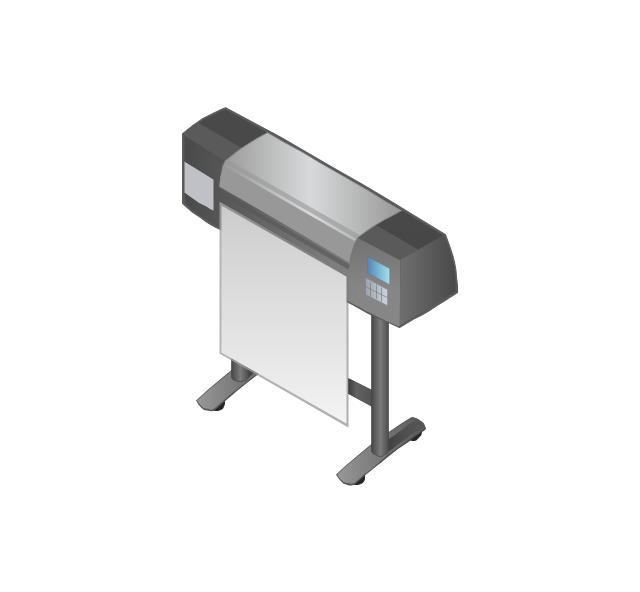
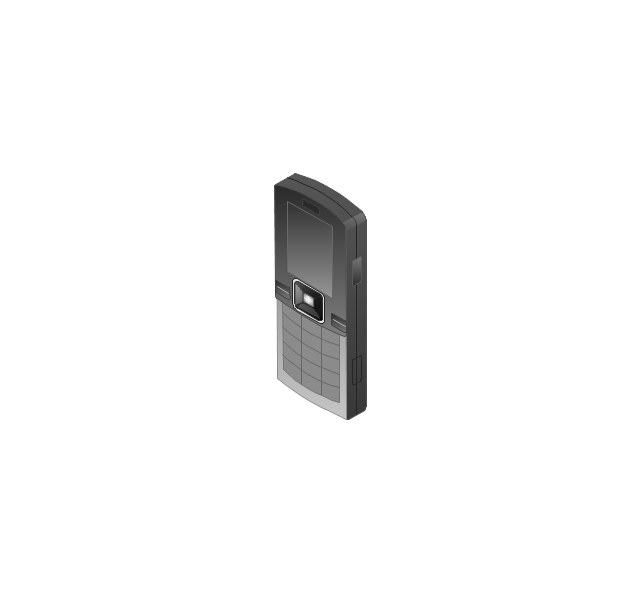
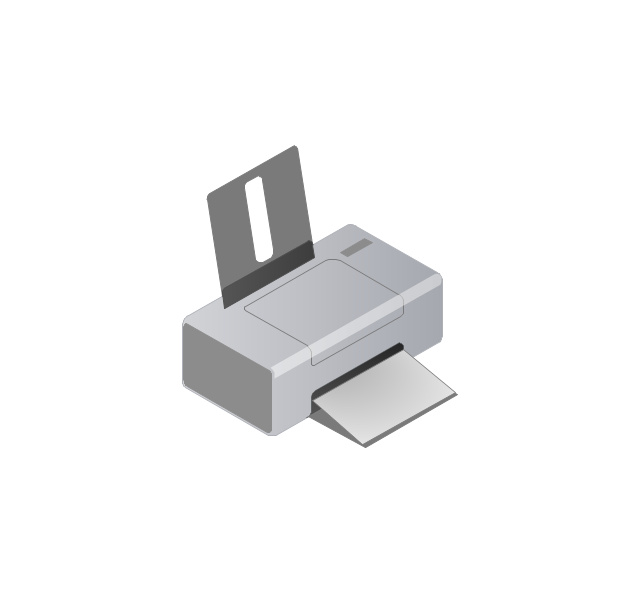
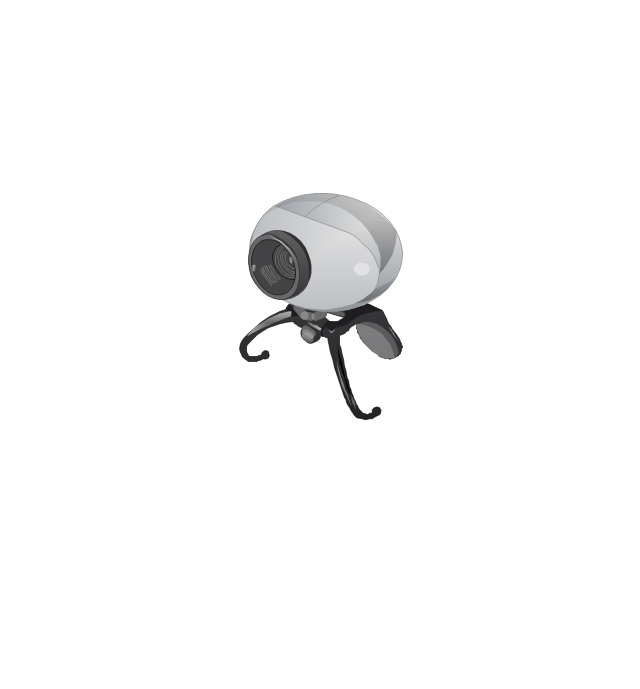
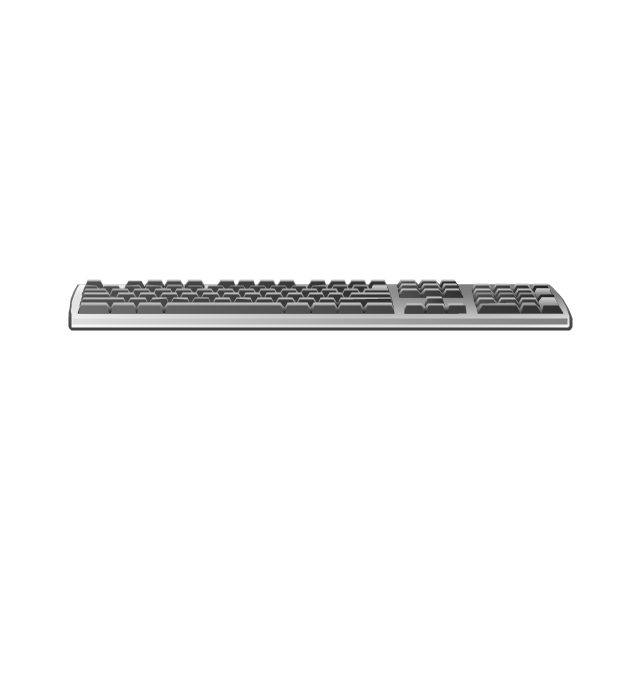
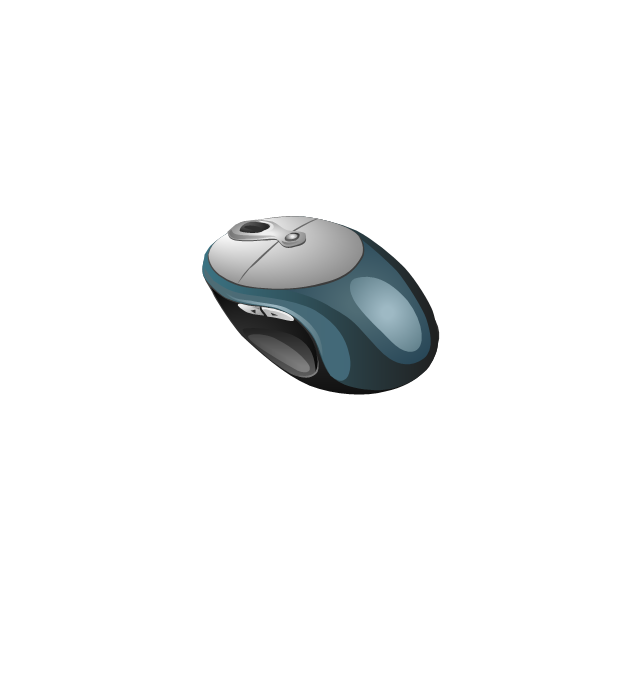
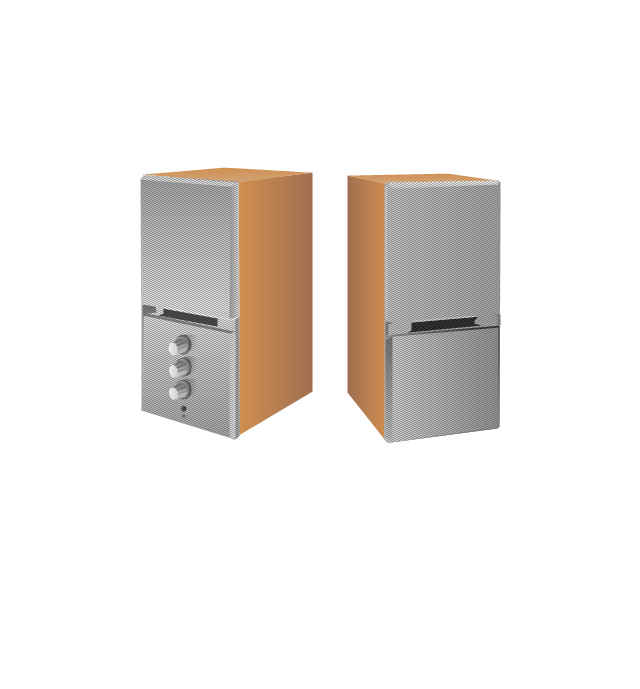
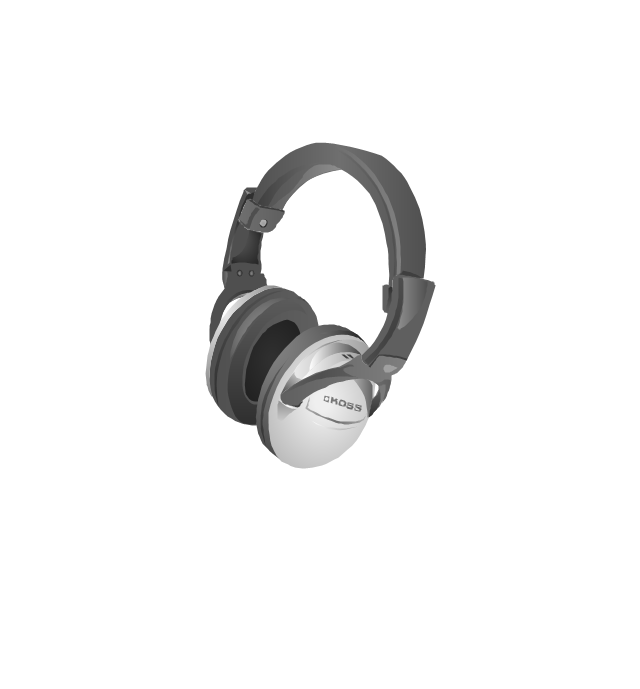
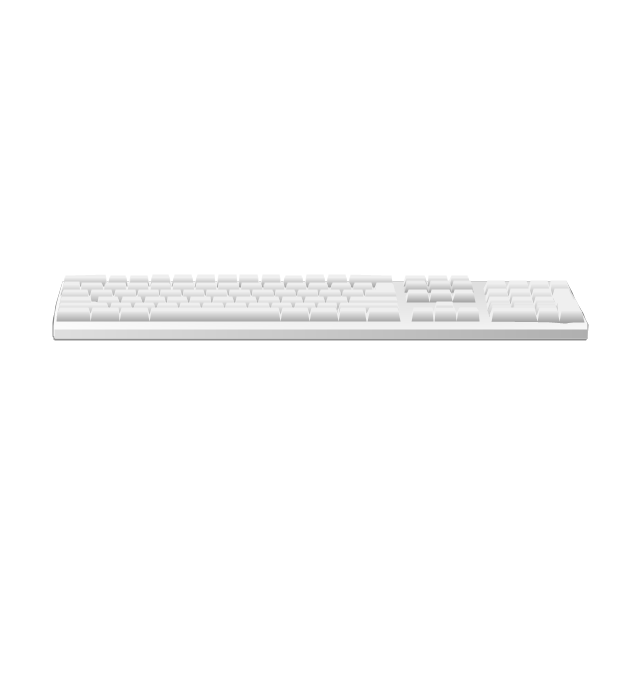
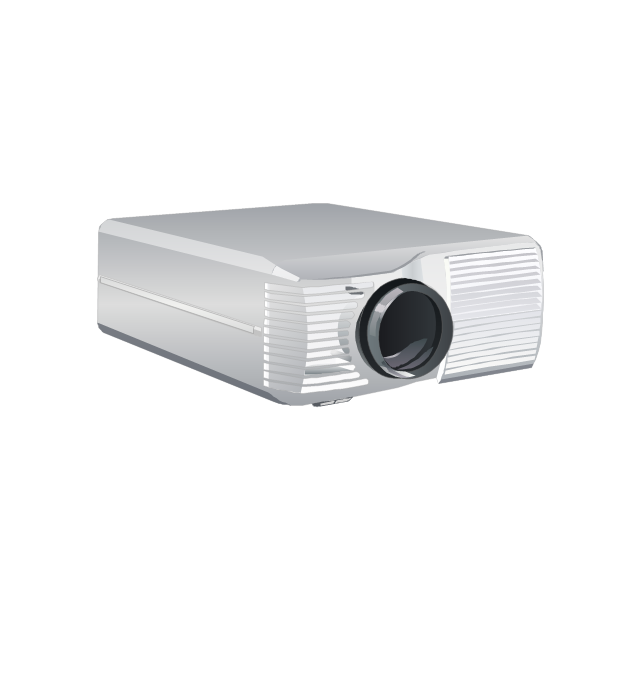
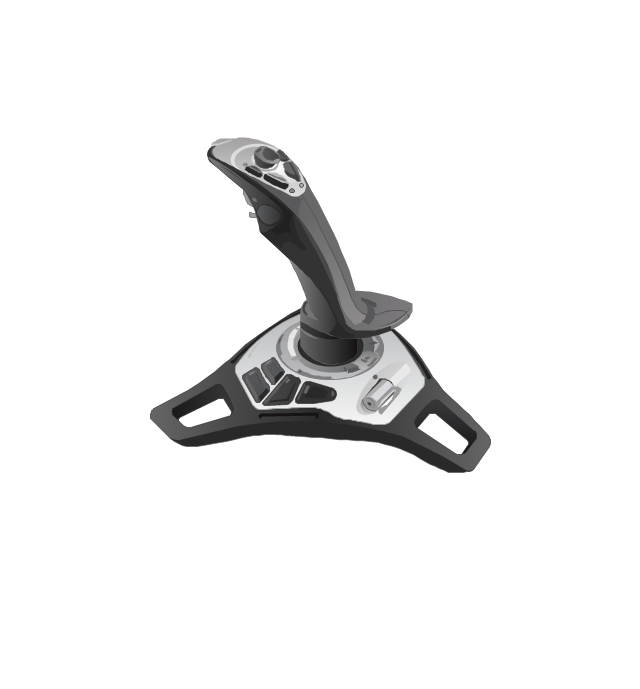
The vector stencils library "Computer peripheral devices" contains 18 clipart images of computer peripheral devices and equipment for drawing network diagrams.
"A peripheral is a device that is connected to a host computer, but not an integral part of it. It expands the host's capabilities but does not form part of the core computer architecture. It is often, but not always, partially or completely dependent on the host.
There are three different types of peripherals:
(1) Input, used to interact with, or send data to the computer (mouse, keyboards, etc.).
(2) Output, which provides output to the user from the computer (monitors, printers, etc.).
(3) Storage, which stores data processed by the computer (hard drives, flash drives, etc.)" [Peripheral. Wikipedia]
The clip art example "Computer peripheral devices - Vector stencils library" was created using the ConceptDraw PRO diagramming and vector drawing software extended with the Computer and Networks solution from the Computer and Networks area of ConceptDraw Solution Park.
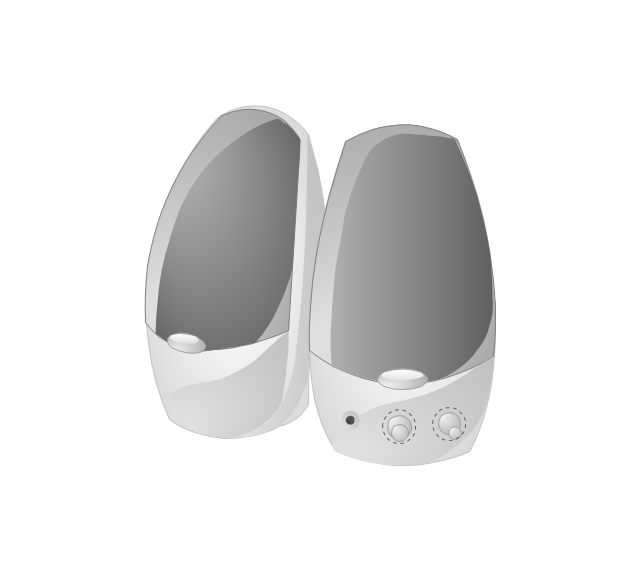
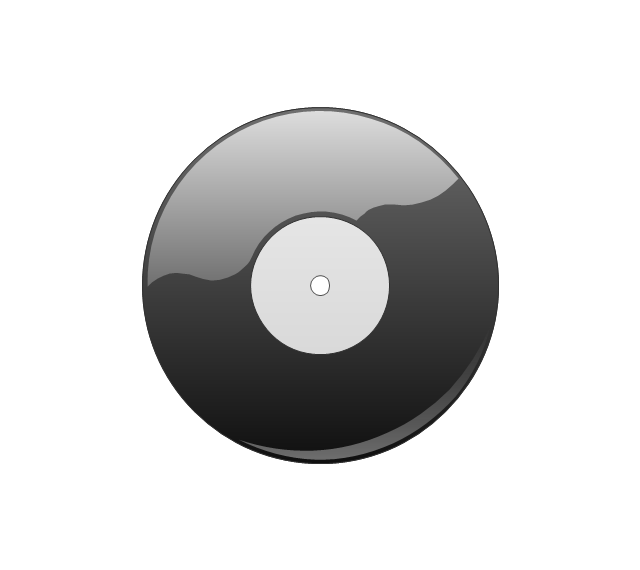
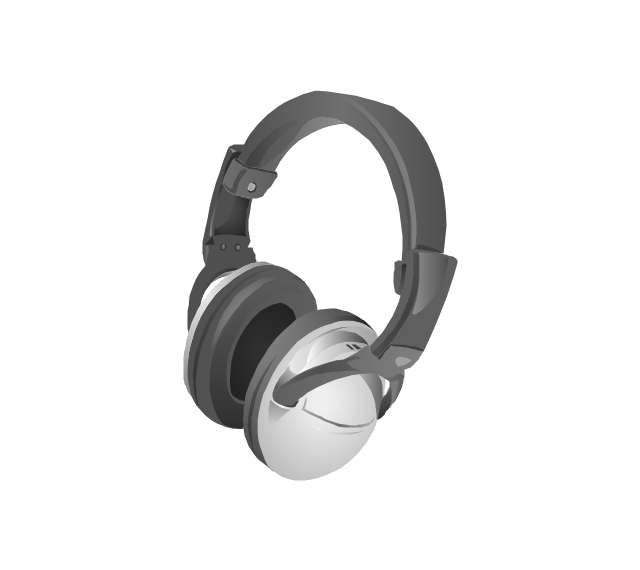
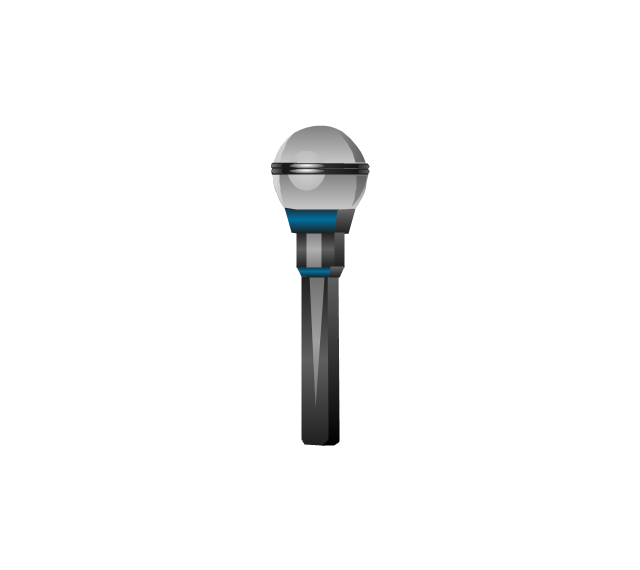
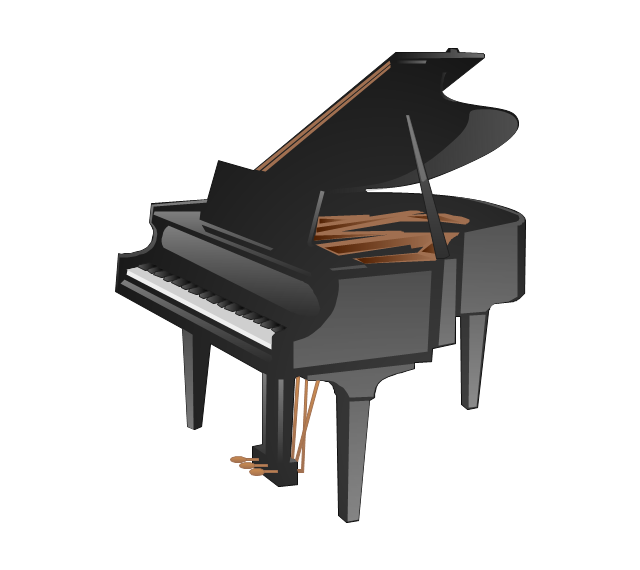
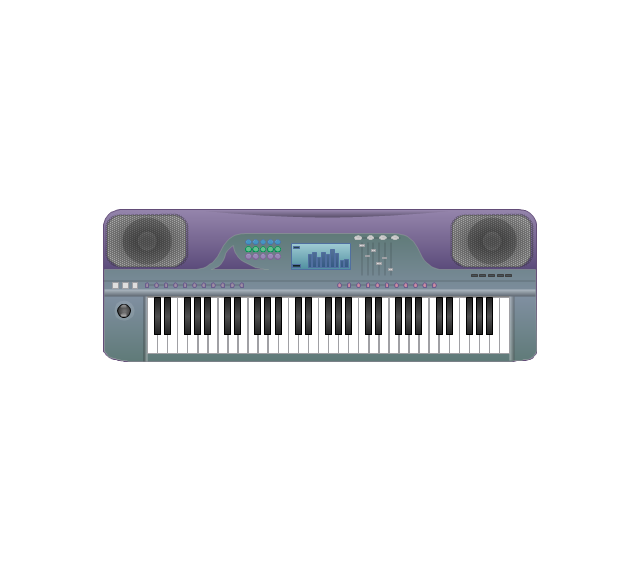
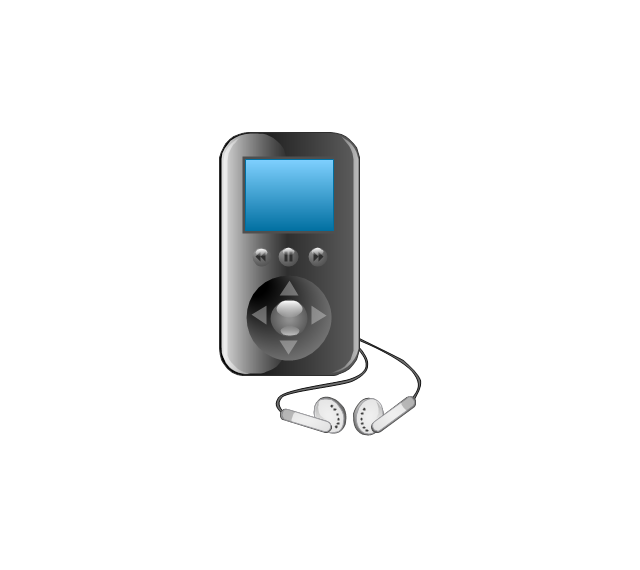
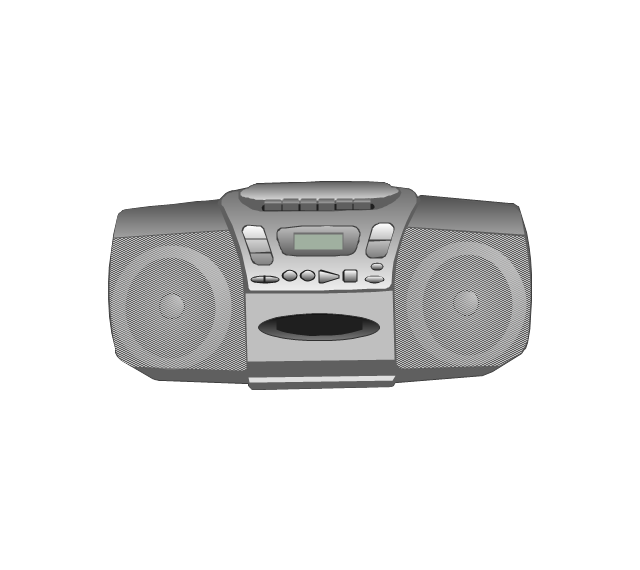
The vector stencils library "Music" contains 28 clipart images of musical devices, instruments and note signs for drawing illustrations.
"Music notation or musical notation is any system used to visually represent aurally perceived music through the use of written symbols, including ancient or modern musical symbols. Although many ancient cultures used symbols to represent melodies, none of them is nearly as comprehensive as written language, limiting the knowledge of ancient music to a few fragments. Comprehensive music notation began to be developed in Europe in the Middle Ages and has been adapted to many kinds of music worldwide." [Musical notation. Wikipedia]
The clip art example "Music - Vector stencils library" was created using the ConceptDraw PRO diagramming and vector drawing software extended with the Artwork solution from the Illustration area of ConceptDraw Solution Park.
www.conceptdraw.com/ solution-park/ illustrations-artwork
This work flow chart sample was redesigned from the picture "Weather Forecast" from the article "Simulation Workflows".
[iaas.uni-stuttgart.de/ forschung/ projects/ simtech/ sim-workflows.php]
"(1) The weather is predicted for a particular geological area. Hence, the workflow is fed with a model of the geophysical environment of ground, air and water for a requested area.
(2) Over a specified period of time (e.g. 6 hours) several different variables are measured and observed. Ground stations, ships, airplanes, weather balloons, satellites and buoys measure the air pressure, air/ water temperature, wind velocity, air humidity, vertical temperature profiles, cloud velocity, rain fall, and more.
(3) This data needs to be collected from the different sources and stored for later access.
(4) The collected data is analyzed and transformed into a common format (e.g. Fahrenheit to Celsius scale). The normalized values are used to create the current state of the atmosphere.
(5) Then, a numerical weather forecast is made based on mathematical-physical models (e.g. GFS - Global Forecast System, UKMO - United Kingdom MOdel, GME - global model of Deutscher Wetterdienst). The environmental area needs to be discretized beforehand using grid cells. The physical parameters measured in Step 2 are exposed in 3D space as timely function. This leads to a system of partial differential equations reflecting the physical relations that is solved numerically.
(6) The results of the numerical models are complemented with a statistical interpretation (e.g. with MOS - Model-Output-Statistics). That means the forecast result of the numerical models is compared to statistical weather data. Known forecast failures are corrected.
(7) The numerical post-processing is done with DMO (Direct Model Output): the numerical results are interpolated for specific geological locations.
(8) Additionally, a statistical post-processing step removes failures of measuring devices (e.g. using KALMAN filters).
(9) The statistical interpretation and the numerical results are then observed and interpreted by meteorologists based on their subjective experiences.
(10) Finally, the weather forecast is visualized and presented to interested people." [iaas.uni-stuttgart.de/ forschung/ projects/ simtech/ sim-workflows.php]
The example "Workflow diagram - Weather forecast" was drawn using the ConceptDraw PRO diagramming and vector drawing software extended with the Workflow Diagrams solution from the Business Processes area of ConceptDraw Solution Park.
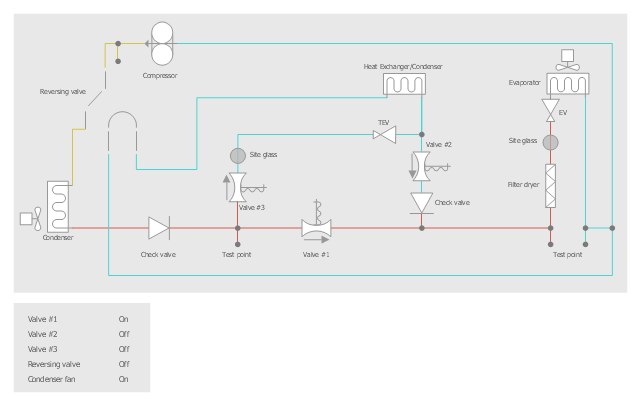
This example was drawn on the base of HVAC schematics in the post "Central Air Pool Heater" from the blog of Nathan Stratton.
"With House Cool Mode, hot gas leaves the compressor runs through the reversing value into the condenser where it condenses into a liquid. Valve #1 is ON so liquid is able to leave the outside unit and run through the filter dryer and site glass into the evaporator upstairs in the house where the liquid flashes into a gas as it passes through the expansion valve and absorbs heat from the air passing through the evaporator. The cold gas travels downstairs and outside to the compressor and the cycle starts all over again." [robotics.net/ projects/ central-air-pool-heater/ ]
The HVAC plan example "Central air pool heater - House cool mode" was created using the ConceptDraw PRO diagramming and vector drawing software extended with the HVAC Plans solution from the Building Plans area of ConceptDraw Solution Park.
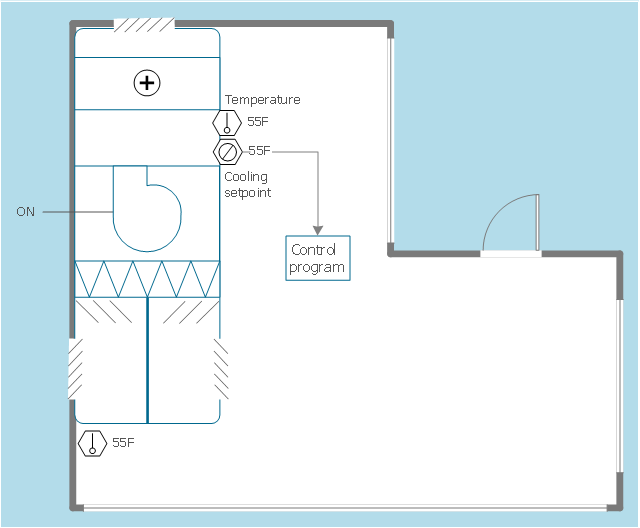
"A thermostat is a component of a control system which senses the temperature of a system so that the system's temperature is maintained near a desired setpoint. The thermostat does this by switching heating or cooling devices on or off, or regulating the flow of a heat transfer fluid as needed, to maintain the correct temperature. The name is derived from the Greek words thermos "hot" and statos "a standing".
A thermostat may be a control unit for a heating or cooling system or a component part of a heater or air conditioner. Thermostats can be constructed in many ways and may use a variety of sensors to measure the temperature. The output of the sensor then controls the heating or cooling apparatus. A thermostat may switch on and off at temperatures either side of the setpoint the extent of the difference is known as hysteresis and prevents too frequent switching of the controlled equipment." [Thermostat. Wikipedia]
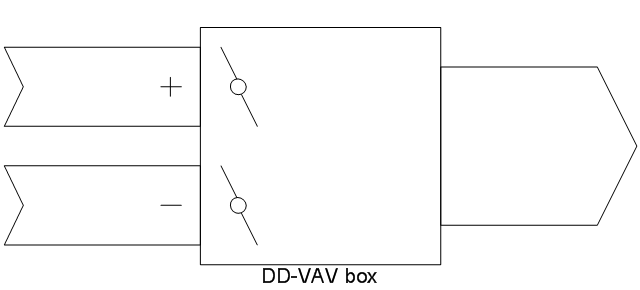
The HVAC plan example "Digital unit ventilator control" was created using the ConceptDraw PRO diagramming and vector drawing software extended with the HVAC Plans solution from the Building Plans area of ConceptDraw Solution Park.
"Ventilating (the V in HVAC) is the process of "changing" or replacing air in any space to provide high indoor air quality (i.e. to control temperature, replenish oxygen, or remove moisture, odors, smoke, heat, dust, airborne bacteria, and carbon dioxide). Ventilation is used to remove unpleasant smells and excessive moisture, introduce outside air, to keep interior building air circulating, and to prevent stagnation of the interior air.
Ventilation includes both the exchange of air to the outside as well as circulation of air within the building. It is one of the most important factors for maintaining acceptable indoor air quality in buildings. Methods for ventilating a building may be divided into mechanical/ forced and natural types.
"Mechanical" or "forced" ventilation is used to control indoor air quality. Excess humidity, odors, and contaminants can often be controlled via dilution or replacement with outside air. However, in humid climates much energy is required to remove excess moisture from ventilation air.
Ventilation increases the energy needed for heating or cooling, however heat recovery ventilation can be used to mitigate the energy consumption. This involves heat exchange between incoming and outgoing air. Energy recovery ventilation additionally includes exchange of humidity." [Ventilation (architecture). Wikipedia]
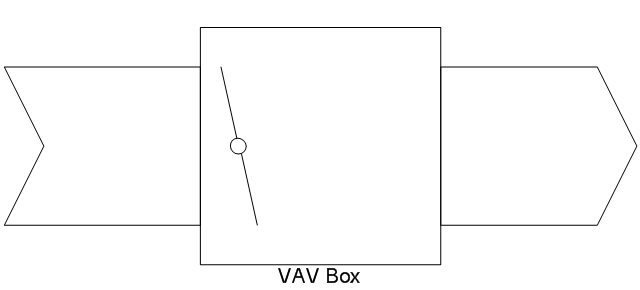
The HVAC plan example "Blow-through unit ventilator" was created using the ConceptDraw PRO diagramming and vector drawing software extended with the HVAC Plans solution from the Building Plans area of ConceptDraw Solution Park.
The vector stencils library "HVAC control equipment" contains 48 HVAC symbols.
Use it for drawing HVAC systems diagrams, heating, ventilation, air conditioning, refrigeration, automated building control, and environmental control design building plans and equipment layouts.
The symbols example "HVAC control equipment - Vector stencils library" was created using the ConceptDraw PRO diagramming and vector drawing software extended with the HVAC Plans solution from the Building Plans area of ConceptDraw Solution Park.
The vector stencils library "Industrial equipment" contains 81 symbols of pumps, compressors, fans, turbines, and power generators.
Use these shapes to design pumping systems, air and fluid compression systems, and industrial process diagrams in the ConceptDraw PRO software extended with the Chemical and Process Engineering solution from the Chemical and Process Engineering area of ConceptDraw Solution Park.
www.conceptdraw.com/ solution-park/ engineering-chemical-process
- Gravity filtration of liquids
- Education | Gravity filtration of liquids | Chemical Laboratory
- DWDM filter
- Gravity filtration of liquids | Chemistry Laboratory Glassware
- Laboratory equipment - Vector stencils library
- Design elements - Recreation signs | Recreation signs - Vector ...
- PFD - Crude oil distillation | Process flow diagram (PFD) template ...
- Periodic table of chemical elements | PAH compounds | Design ...
- Electrical Drawing Software | Design elements - Electrical circuits ...
- Data Flow Diagram Symbols. DFD Library | Basic Flowchart ...
- Design elements - Chemical engineering | PFD - Jet fuel mercaptan ...
- Amplifier - Circuit diagram | Design elements - Composite ...
- Computer network - Vector stencils library
- Design elements - Switches and relays
- Air handler- HVAC plan | Air temperature correlations - Cafe ...
- Computers and network isometric - Vector stencils library
- Computer peripheral devices - Vector stencils library
- Chemical and Process Engineering | Design elements - Chemical ...
- VHF UHF SHF - Vector stencils library
- Music - Vector stencils library









-vhf-uhf-shf---vector-stencils-library.png--diagram-flowchart-example.png)














-cisco-products-additional---vector-stencils-library.png--diagram-flowchart-example.png)
-cisco-products-additional---vector-stencils-library.png--diagram-flowchart-example.png)
-cisco-products-additional---vector-stencils-library.png--diagram-flowchart-example.png)
-cisco-products-additional---vector-stencils-library.png--diagram-flowchart-example.png)


-cisco-products-additional---vector-stencils-library.png--diagram-flowchart-example.png)
-cisco-products-additional---vector-stencils-library.png--diagram-flowchart-example.png)


-cisco-products-additional---vector-stencils-library.png--diagram-flowchart-example.png)
-cisco-products-additional---vector-stencils-library.png--diagram-flowchart-example.png)
-cisco-products-additional---vector-stencils-library.png--diagram-flowchart-example.png)
-cisco-products-additional---vector-stencils-library.png--diagram-flowchart-example.png)

-cisco-products-additional---vector-stencils-library.png--diagram-flowchart-example.png)
-cisco-products-additional---vector-stencils-library.png--diagram-flowchart-example.png)
-cisco-products-additional---vector-stencils-library.png--diagram-flowchart-example.png)
-cisco-products-additional---vector-stencils-library.png--diagram-flowchart-example.png)
-cisco-products-additional---vector-stencils-library.png--diagram-flowchart-example.png)


--laboratory-equipment---vector-stencils-library.png--diagram-flowchart-example.png)
-laboratory-equipment---vector-stencils-library.png--diagram-flowchart-example.png)
-laboratory-equipment---vector-stencils-library.png--diagram-flowchart-example.png)
