Cause and Effect Analysis - Fishbone Diagrams for Problem Solving
Fishbone diagram is a powerful tool used for solving business problems and obstacles. ConceptDraw PRO software extended with Fishbone Diagrams solution from the Management area of ConceptDraw Solution Park is a helpful tool for cause and effect analysis. It gives the ability to easy identify many possible causes and factors which cause the effects and to draw Fishbone Diagrams for problem solving.
 Fishbone Diagrams
The Fishbone Diagrams solution extends ConceptDraw PRO v10 software with the ability to easily draw the Fishbone Diagrams (Ishikawa Diagrams) to clearly see the cause and effect analysis and also problem solving. The vector graphic diagrams produced using this solution can be used in whitepapers, presentations, datasheets, posters, and published technical material.
Cause and Effect Diagram
ConceptDraw PRO software extended with Fishbone Diagrams solution from the Management area of ConceptDraw Solution Park is perfect for Cause and Effect Diagram creating. It gives the ability to draw fishbone diagram that identifies many possible causes for an effect or a problem. Causes and Effects are usually grouped into major categories to identify these sources of variation. Causes and Effects in the diagram show relationships among various factor. Fishbone diagram shows factors of Equipment, Process, People, Materials, Environment and Management, all affecting the overall problem.Venn Diagram Examples for Problem Solving. Environmental Social Science. Human Sustainability Confluence
The Venn diagram example below shows sustainable development at the confluence of three constituent parts.Create your Venn diagrams for problem solving in environmental social science using the ConceptDraw PRO diagramming and vector drawing software extended with the Venn Diagrams solution from the area "What is a Diagram" of ConceptDraw Solution Park.
3 Circle Venn Diagram. Venn Diagram Example
This template shows the Venn Diagram. It was created in ConceptDraw PRO diagramming and vector drawing software using the ready-to-use objects from the Venn Diagrams Solution from the "What is a Diagram" area of ConceptDraw Solution Park.Venn Diagrams visualize all possible logical intersections between several sets and are widely used in mathematics, logic, statistics, marketing, sociology, etc.
ConceptDraw Arrows10 Technology
Connecting objects manually in ConceptDraw PRO is a snap:- points;
- Connecting groups of objects;
- Auto-routing;
- Connectors text;
- Snap to Guides ;
- Quick.
Cylinder Venn Diagram
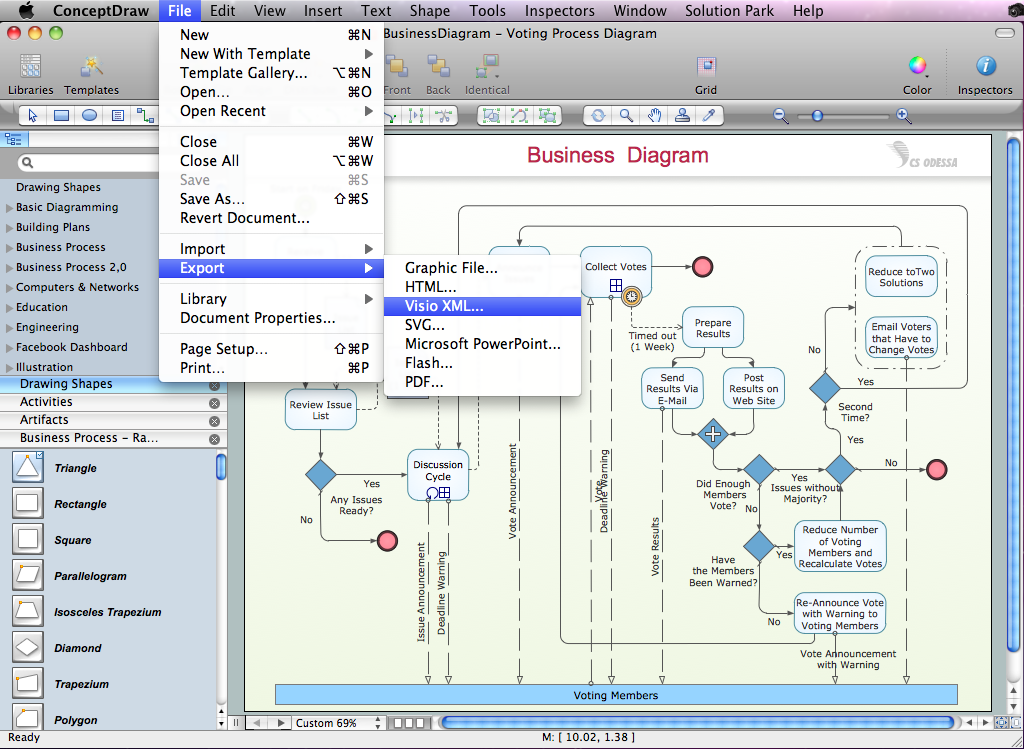
You need design Cylinder Venn Diagram? Nothing could be easier with ConceptDraw PRO diagramming and vector drawing software extended with Venn Diagrams Solution from the “What is a Diagram” Area. ConceptDraw PRO allows you to design various Venn Diagrams including Cylinder Venn Diagrams.Export from ConceptDraw PRO Document to MS Visio® XML
Once you have created your document in ConceptDraw PRO and you want to share it with your colleagues and friends, who uses MS Visio on their computers, you can easily export your document using ConceptDraw PRO export to Visio XML files (VDX) feature.Now you can share your ConceptDraw documents with MS Visio users.

ConceptDraw Arrows10 Technology
You want to connecting objects manually?You don't know how should diagramming software work?
Is it possible to develop a diagram as quickly as the ideas come to you?
Yes. The innovative ConceptDraw Arrows10 Technology - This is more than enough versatility to draw any type of diagram with any degree of complexity.
You can start draw your diagram manually now.
How To Make a Bubble Chart
Bubble diagrams solution extends ConceptDraw PRO software with templates, Using ConceptDraw Connectors, you can make a bubble chart in moments. Using ConceptDraw you will be able to make a bubble chart from the ready ConceptDraw library objects or make your own objects. The created diagram can represent ideas organization, in brainstorming processes, by teachers for explaining difficult ideas or for presentations.
 Fault Tree Analysis Diagrams
This solution extends ConceptDraw PRO v9.5 or later with templates, fault tree analysis example, samples and a library of vector design elements for drawing FTA diagrams (or negative analytical trees), cause and effect diagrams and fault tree diagrams.
Human Resource Management
ConceptDraw PRO diagramming and vector drawing software enhanced with powerful HR Flowcharts Solution from the Management Area of ConceptDraw Solution Park perfectly suits for Human Resource Management.
 Seven Basic Tools of Quality
Manage quality control in the workplace, using fishbone diagrams, flowcharts, Pareto charts and histograms, provided by the Seven Basic Tools of Quality solution.
 Security and Access Plans
This solution extends ConceptDraw PRO software with physical security plan, security chart, access chart, security plans, access schemes, access plans , CCTV System Plan samples, templates and libraries of design elements for drawing the Security and Acce
 PM Response
This solution extends all ConceptDraw Office 2.0 products by helping to improve the response time to project changes. PM Response also helps with iteration planning, discussing project layout approaches, and solving project challenges.
- Cause and Effect Diagram | Fishbone Diagrams | Business Diagram ...
- Using Fishbone Diagrams for Problem Solving | PROBLEM ...
- Fishbone Diagram | Using Fishbone Diagrams for Problem Solving ...
- Fishbone Diagram Topics In Science
- Fish Bone In Science
- Venn Diagram Examples for Problem Solving. Venn Diagram as a ...
- Fishbone Diagram Science Examples In Science
- Fishbone Diagrams | Venn Diagram Examples for Problem Solving ...
- Fishbone Diagram | Draw Fishbone Diagram on MAC Software ...
- Fishbone Diagrams | ConceptDraw Solution Park | Mathematics ...
- Fishbone Diagram | Business Productivity Diagramming | Using ...
- Venn Diagram Examples for Problem Solving. Environmental Social ...
- Fishbone Diagram | Fishbone Diagram Problem Solving | Using ...
- Fishbone diagram
- Fishbone Diagram | Universal Diagramming Area | Simple & Fast ...
- Fishbone Diagram Example For Poor Education
- The Fishbone Diagram Chemical Engineering
- Fishbone Diagram | Fishbone Diagrams | How to Draw a Fishbone ...
- Fishbone Diagrams | Education | Simple Drawing Applications for ...


