Process Flowchart
The main reason of using Process Flowchart or PFD is to show relations between major parts of the system. Process Flowcharts are used in process engineering and chemical industry where there is a requirement of depicting relationships between major components only and not include minor parts. Process Flowcharts for single unit or multiple units differ in their structure and implementation. ConceptDraw PRO is Professional business process mapping software for making Process flowcharts, Process flow diagram, Workflow diagram, flowcharts and technical illustrations for business documents and also comprehensive visio for mac application. Easier define and document basic work and data flows, financial, production and quality management processes to increase efficiency of your business with ConcepDraw PRO. Business process mapping software with Flowchart Maker ConceptDraw PRO includes extensive drawing tools, rich examples and templates, process flowchart symbols and shape libraries, smart connectors that allow you create the flowcharts of complex processes, process flow diagrams, procedures and information exchange. Process Flowchart Solution is project management workflow tools which is part ConceptDraw Project marketing project management software. Drawing charts, diagrams, and network layouts has long been the monopoly of Microsoft Visio, making Mac users to struggle when needing such visio alternative like visio for mac, it requires only to view features, make a minor edit to, or print a diagram or chart. Thankfully to MS Visio alternative like ConceptDraw PRO software, this is cross-platform charting and business process management tool, now visio alternative for making sort of visio diagram is not a problem anymore however many people still name it business process visio tools.
Basic Flowchart Symbols and Meaning
Flowcharts are the best for visually representation the business processes and the flow of a custom-order process through various departments within an organization. ConceptDraw PRO diagramming and vector drawing software extended with Flowcharts solution offers the full set of predesigned basic flowchart symbols which are gathered at two libraries: Flowchart and Flowcharts Rapid Draw. Among them are: process, terminator, decision, data, document, display, manual loop, and many other specific symbols. The meaning for each symbol offered by ConceptDraw gives the presentation about their proposed use in professional Flowcharts for business and technical processes, software algorithms, well-developed structures of web sites, Workflow diagrams, Process flow diagram and correlation in developing on-line instructional projects or business process system. Use of ready flow chart symbols in diagrams is incredibly useful - you need simply drag desired from the libraries to your document and arrange them in required order. There are a few serious alternatives to Visio for Mac, one of them is ConceptDraw PRO. It is one of the main contender with the most similar features and capabilities.
How to Create Flowcharts for an Accounting Information System
Accounting information is a system of interrelated processes which represent financial and accounting data, required for decision making. For representing the accounting processes in a visual and easy for perception form are constructed Accounting Flowcharts. For their creation are used special flowchart symbols, this makes Accounting flowcharts understandable for all users of accounting information system and helps them easy understand the sequence of steps involved to accounting processes. But how to create Flowcharts for an Accounting Information System fast and easy? Use of special design software is useful for this. ConceptDraw PRO software extended with Accounting Flowcharts solution is the best for creation accurate Accounting Flowcharts, for documentation and visually communication on how accounting processes work, how each operation is done. Accounting Flowcharts solution is supplied with library of predesigned commonly used vector symbols, Accounting Flowchart templates and samples demonstrating receiving, purchasing, payment, and other accounting processes.ConceptDraw PRO The best Business Drawing Software
ConceptDraw PRO is new software for business and technical drawing. Powerful business drawing tools, extensive libraries with pre-drawn shapes, free samples of business drawings, technical drawings and flowcharts, support of many graphic formats enable users to visually develop their business drawings charts and diagrams in any combination of drawings, diagrams and flow charts.Gane Sarson Diagram
The Gane-Sarson methodology uses the graphical techniques for building the logical models for the systems. It is helpful for analysts and designers to make common and clear picture of the system, to depict all its processes and how they transform the data. The Gane-Sarson methodology lets represent all this information in a way understandable for the users and other interested people, and gives the possibility to see instantly how the system's parts serve together to meet their needs. This methodology supposes the building of a system top-down. First you need create an overall system data flow, then determine the details of the data structures, the process logic and design the modular structures. ConceptDraw PRO diagramming and vector drawing software offers the Data Flow Diagrams solution with Gane-Sarson Notation library rich for the specific symbols of the Gane-Sarson notation. All they are vector and fully ready-to-use for drawing the Data Flow Diagrams, which will be then successfully used in presentations, websites, and various business documents.Value Stream Mapping Symbols
VSM symbols are the best for a production process designing. The entire Value Stream Mapping method uses a graphical representation of the manufacturing process, factors' pros and cons, that all stakeholders can easily understand. Value Stream Mapping is a graphical technique that provides possibilities to improve analysis of a manufacturing process, at the stage of the transferring information or materials that required to deliver a product or service to the customer.HelpDesk
How to Create the Custom Diagram Template on Mac
ConceptDraw?PRO enables you to?place your own templates. You can create diagram with ConceptDraw PRO using your custom Template. You can set up your Template as a default ConceptDraw PRO start page. A template diagram is a drawing that serves as a starting point for a new graphic document. When you open a template, it is pre-formatted in some way. For example, you might use template that is formatted as an organizational chart. The template would likely have a workspace and a corresponding object libraries. When you save a file created with a template, you are usually prompted to save a copy of the file, so that you don't save over the template. Templates can either come with a proper solution or can be created by the user. If you find yourself creating similar documents over and over again, it might be a good idea to save one of them as a template. Then you won't have to format your documents each time you want to make a new one. Just open the template and start from there.HelpDesk
How to Create a Time Series Dashboard
Time Series Dashboard means an integration of some type of diagrams: Line Charts, Bar Charts, Column Charts, and Dot Plots on a single space. The ConceptDraw Time Series Dashboard solution can be used to create the interactive Time Series dashboard. The libraries of Time Series Charts solution contain the Live Objects, that can change their appearance depending on the external data. Each chart from the Time Series dashboard displays particular source data. You can include Time Series Charts in your business or technical dashboards to show and compare the items changing over time.Network Diagram Software LAN Network Diagrams & Diagrams for LAN Physical Office Network Diagrams
Physical LAN Diagrams illustrate the communication schemes of Local Area Networks, the physical network connection of computers and networks arrangement on the small areas - at homes, offices, and other buildings. ConceptDraw PRO is a perfect network diagramming software with samples and examples of WAN and LAN Diagrams, templates and collection of network components libraries. Computer Network Diagrams Solution for ConceptDraw PRO Mac and Windows is ideal for IT professionals, network engineers and network designers who need to visualize network architecture, to document LANs physical structure and arrangement, to draw Local Area Network (LAN) diagrams and schematics, WAN diagrams, physical office network diagrams and topologies, wiring drawings, etc. You can design all them easy using the predesigned vector objects of computers and computer network devices, hardware devices, peripheral devices, external digital devices, internet and logical symbols, and many other stencils from the Computer Network Diagrams libraries. ConceptDraw PRO offers a powerful and easy-to-use solution for those who looking for a Visio alternative for Mac. It is a world-class diagramming platform with dynamic presentation power.
Technical Drawing Software
Technical drawing or draft is a form of specialized graphic communication, exchange of ideas in industry and engineering. It is a visual representation of object with indication of dimensions and used material, constructed with maintaining the proportions between its parts. Technical drawings are constructed by architects, technologists, engineers, designers, drafters, and other technical professionals according to defined rules, specifications, internationally accepted standards and standardized notations allowing to make unambiguous, clear and understandable technical drawings. ConceptDraw PRO extended with Electrical Engineering solution, Mechanical Engineering solution, Chemical and Process Engineering solution from Industrial Engineering Area of ConceptDraw Solution Park is ideal technical drawing software. Its powerful drawing tools, predesigned vector objects, templates, samples are helpful for creation all kinds of Technical Drawings and Technical Diagrams, Electrical and Mechanical Schematics, Circuit and Wiring Diagrams, Structural Drawings, and many other.HelpDesk
How to Plan and Allocate Resources in Your Project on Mac
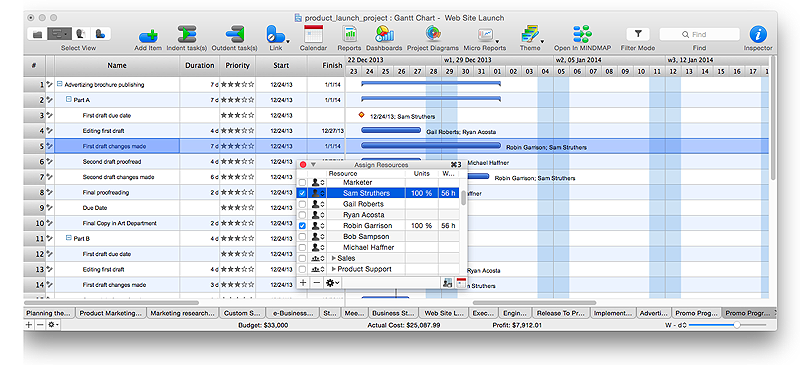
CoceptDraw PROJECT provides easy ways to project Resources Management: Create a list of project resources and assign the right people to tasks, as well as the necessary materials to be used.HelpDesk
How to Use ConceptDraw Single User License
With ConceptDraw products it is possible to reassign a licensesHelpDesk
How are Summary Values of Project Phases Calculated
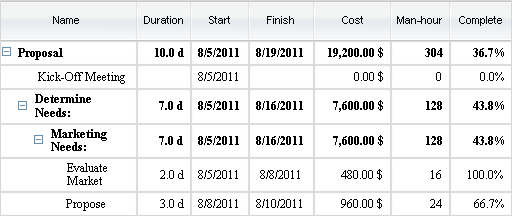
The project schedule usually consists of a list of project tasks joined into project phases. Each task has its own value such as duration, cost, % complete, etc.HelpDesk
How to Insert a Mind Map into Microsoft Word Document
ConceptDraw MINDMAP offers several options of converting your mind map to MS Word document. You can choose the proper format that meets your needs to communicate content of your mind maps. Generate text, presentations, images or web pages that are pertinent to your work. Primary, you can export a mind map to MS Word. This method allows stylizing the document by using a custom MS Word templates. If you need to combine text and hierarchically structured information in a single document, the best solution is to incorporate a mind map into the MS Word document using the copy-paste capabilities of ConceptDraw MINDMAP.- Process Flowchart | How to Create Flowcharts for an Accounting ...
- Basic Flowchart Symbols and Meaning | Audit Flowchart Symbols ...
- Management Information Systems Business Process Flowchart
- 4 Level pyramid model diagram - Information systems types | 5 Level ...
- Chart Of Management Information System With Diagram
- Process Flowchart | Cross-Functional Flowcharts | Basic Flowchart ...
- Data Flow Diagram Model | DFD - Model of small traditional ...
- Data Flow Draigram For Export Information
- Contoh Flowchart | Flowchart | Basic Flowchart Symbols and ...
- Process Flowchart | How to Create Flowcharts for an Accounting ...
- Process Flowchart | Data Flow Diagram Model | Flow chart Example ...
- Basic Audit Flowchart . Flowchart Examples | Audit Flowcharts | Audit ...
- Flowchart Symbols Use In Business Information System
- Data Flow Diagram
- 4 Level pyramid model diagram - Information systems types | 5 Level ...
- Explain Information System In An Enterprise With The Help Of Flow
- Data Flow Diagram Symbols. DFD Library | Basic Flowchart ...
- Accounting Flowcharts | How to Create Flowcharts for an Accounting ...
- Process Flowchart | Basic Flowchart Symbols and Meaning | Cross ...


