Process Flowchart


Bar Diagrams for Problem Solving. Create manufacturing and economics bar charts with Bar Graphs Solution

Chart Templates

HelpDesk
How to Draw the Different Types of Pie Charts
HelpDesk
How to Create an IDEF0 Diagram for an Application Development

Geo Map — USA — Montana

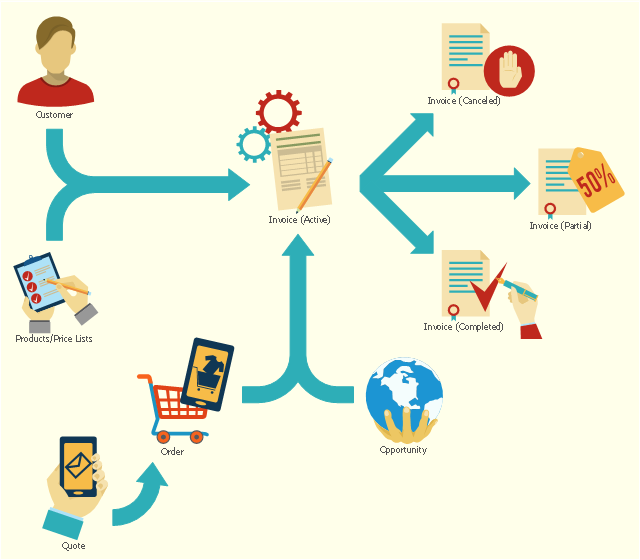
This flowchart example shows the lifecycle of an invoice in Microsoft Dynamics CRM. It was redesigned from the Wikimedia Commons file: Invoice lifecycle.svg. [commons.wikimedia.org/ wiki/ File:Invoice_ lifecycle.svg]
"Microsoft Dynamics CRM is a customer relationship management software package developed by Microsoft. Out of the box, the product focuses mainly on Sales, Marketing, and Service (help desk) sectors...
Dynamics CRM is a server-client application, which, like Microsoft SharePoint, is primarily an IIS-based web application which also supports extensive web services interfaces. Clients access Dynamics CRM either by using a Browser or by a thick client plug-in to Microsoft Outlook." [Microsoft Dynamics CRM. Wikipedia]
The process flowchart example "Invoice lifecycle" was created using the ConceptDraw PRO diagramming and vector drawing software extended with the Sales Flowcharts solution from the Marketing area of ConceptDraw Solution Park.
Lifecycle of an invoice in Microsoft Dynamics CRM
Geo Map - Europe - Belarus

HelpDesk
How to Create an Enterprise Architecture Diagram in ConceptDraw PRO

 Stakeholder Onion Diagrams
The Stakeholder Onion Diagram is often used as a way to view the relationships of stakeholders to a project goal. A basic Onion Diagram contains a rich information. It shows significance of stakeholders that will have has influence to the success achieve
 Pie Charts
Pie Charts are extensively used in statistics and business for explaining data and work results, in mass media for comparison (i.e. to visualize the percentage for the parts of one total), and in many other fields. The Pie Charts solution for ConceptDraw PRO v10 offers powerful drawing tools, varied templates, samples, and a library of vector stencils for simple construction and design of Pie Charts, Donut Chart, and Pie Graph Worksheets.
 Seating Plans
The correct and convenient arrangement of tables, chairs and other furniture in auditoriums, theaters, cinemas, banquet halls, restaurants, and many other premises and buildings which accommodate large quantity of people, has great value and in many cases requires drawing detailed plans. The Seating Plans Solution is specially developed for their easy construction.
 Target and Circular Diagrams
This solution extends ConceptDraw PRO software with samples, templates and library of design elements for drawing the Target and Circular Diagrams.
- Service Sector Activities With Charts
- Process Flowchart | Cross-functional flowchart - Providing telecom ...
- Sector weightings - Exploded pie chart | Bar Diagrams for Problem ...
- Manufacturing Chart
- Pie Chart Examples and Templates | Process Flowchart | How to ...
- Sector weightings - Exploded pie chart | Domestic sector SWOT ...
- Sector weightings - Exploded pie chart | Pyramid Chart Examples ...
- Examples of Flowcharts, Org Charts and More | Pie Chart Examples ...
- Process Flowchart | Flow chart Example. Warehouse Flowchart ...
- Sector weightings - Exploded pie chart | Stakeholder Onion ...
- Flow Chart Of Clothing Including Primary Sector Secondary Sector ...
- Flow chart Example. Warehouse Flowchart | Logistics ...
- Sales Process Flowchart . Flowchart Examples | Sales Process Steps ...
- Invoice payment process - Flowchart | Application handling and ...
- Process Flowchart | Cross Functional Flowchart Examples | Flow ...
- Purchase Process Flow Chart , Receiving Process Flow Chart
- Business process diagram BPMN 1.2 - Hiring process | Cab booking ...
- Business Process Diagram | Process Flowchart | Cross-Functional ...
- Process Flowchart | How to Draw a Process Flow Diagram in ...
- Sales Process Flowchart . Flowchart Examples | Sales department ...