Process Flowchart
The main reason of using Process Flowchart or PFD is to show relations between major parts of the system. Process Flowcharts are used in process engineering and chemical industry where there is a requirement of depicting relationships between major components only and not include minor parts. Process Flowcharts for single unit or multiple units differ in their structure and implementation. ConceptDraw PRO is Professional business process mapping software for making Process flowcharts, Process flow diagram, Workflow diagram, flowcharts and technical illustrations for business documents and also comprehensive visio for mac application. Easier define and document basic work and data flows, financial, production and quality management processes to increase efficiency of your business with ConcepDraw PRO. Business process mapping software with Flowchart Maker ConceptDraw PRO includes extensive drawing tools, rich examples and templates, process flowchart symbols and shape libraries, smart connectors that allow you create the flowcharts of complex processes, process flow diagrams, procedures and information exchange. Process Flowchart Solution is project management workflow tools which is part ConceptDraw Project marketing project management software. Drawing charts, diagrams, and network layouts has long been the monopoly of Microsoft Visio, making Mac users to struggle when needing such visio alternative like visio for mac, it requires only to view features, make a minor edit to, or print a diagram or chart. Thankfully to MS Visio alternative like ConceptDraw PRO software, this is cross-platform charting and business process management tool, now visio alternative for making sort of visio diagram is not a problem anymore however many people still name it business process visio tools.
Flowchart Example: Flow Chart of Marketing Analysis
An example flowchart of marketing analysis shows main steps you have to challenge writing a marketing analysis.Types of Flowcharts
A Flowchart is a graphical representation of process, algorithm, workflow or step-by-step solution of the problem. It shows the steps as boxes of various kinds and connects them by arrows in a defined order depicting a flow. There are twelve main Flowchart types: Basic Flowchart, Business Process Modeling Diagram (BPMN), Cross Functional Flowchart, Data Flow Diagram (DFD), IDEF (Integrated DEFinition) Flowchart, Event-driven Process Chain (EPC) Diagram, Influence Diagram (ID), Swimlane Flowchart, Process Flow Diagram (PFD), Specification and Description Language (SDL) Diagram, Value Stream Mapping, Workflow Diagram. Using the Flowcharts solution from the Diagrams area of ConceptDraw Solution Park you can easy and quickly design a Flowchart of any of these types. This solution offers a lot of special predesigned vector symbols for each of these widely used notations. They will make the drawing process of Flowcharts much easier than ever. Pay also attention for the included collection of ready Flowchart examples, samples and quick-start templates. This is business process improvement tools. If you are looking for MS Visio for your Mac, then you are out of luck, because it hasn't been released yet. However, you can use Visio alternatives that can successfully replace its functions. ConceptDraw PRO is an alternative to MS Visio for Mac that provides powerful features and intuitive user interface for the same.
HelpDesk
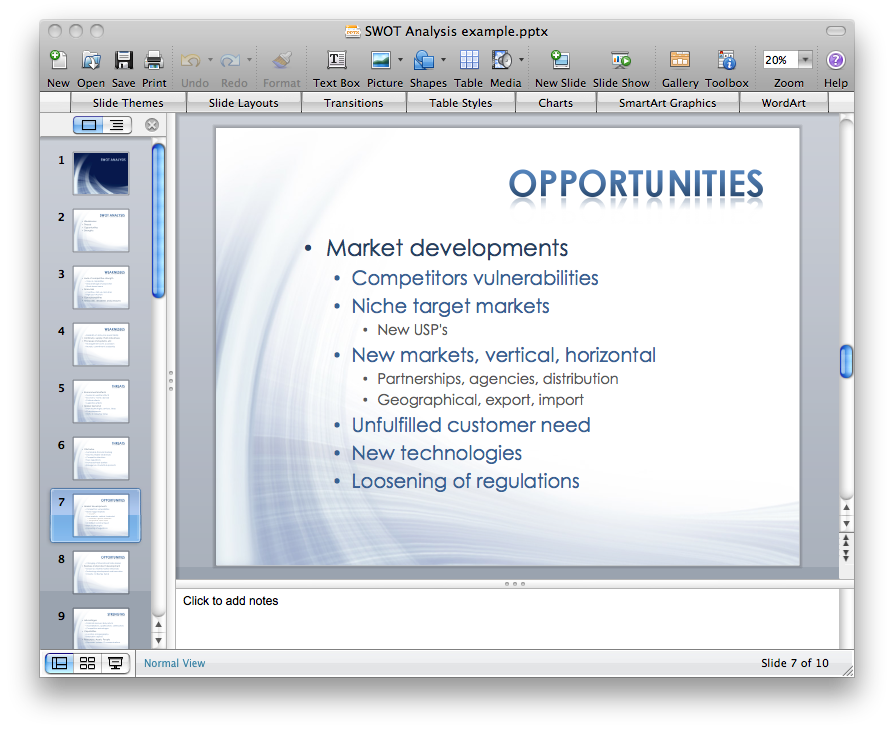
How to Create a PowerPoint Presentation from a SWOT Matrix
You can use SWOT analysis PowerPoint presentation to represent strengths, weakness, opportunities, and threats involved in your SWOT matrix.
 Cross-Functional Flowcharts
Cross-functional flowcharts are powerful and useful tool for visualizing and analyzing complex business processes which requires involvement of multiple people, teams or even departments. They let clearly represent a sequence of the process steps, the order of operations, relationships between processes and responsible functional units (such as departments or positions).
HelpDesk
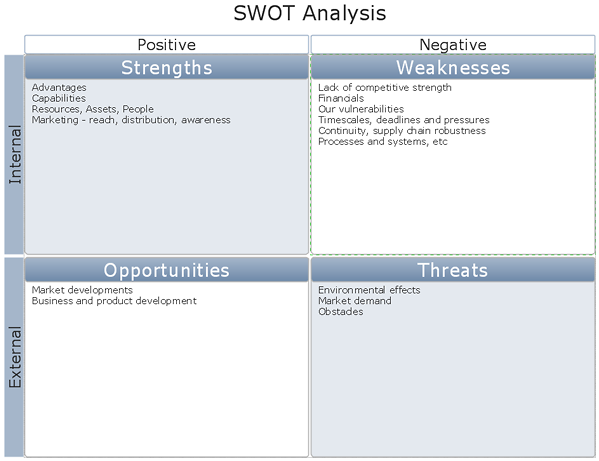
How to Create SWOT Analysis Template Using ConceptDraw PRO
SWOT-analysis is used to develop a marketing strategy. SWOT-analysis includes determining the strengths and weaknesses in the company's activity, potential external threats and opportunities and assesses their relative strategic competitors. ConceptDraw SWOT and TOWS Matrix Diagrams solution provide a set of SWOT matrix in which should be recorded and then compared the strengths and weaknesses of the enterprise and the market opportunities and threats. This comparison allows you to determine what steps can be taken for the development of your company and what problems need to be addressed urgently.HelpDesk
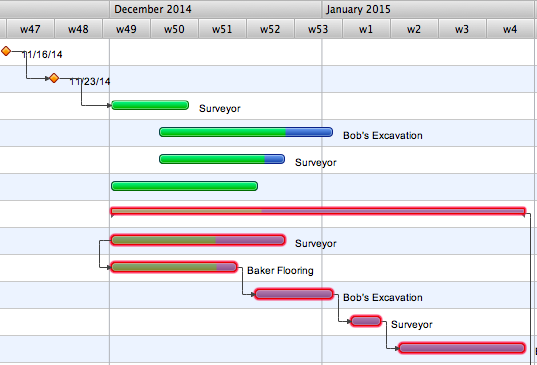
How to Use Critical Path Analysis for Scheduling Complex Projects
Instruction on how to use this important project management tool with ConceptDraw PROJECT
 Accounting Flowcharts
Accounting Flowcharts solution extends ConceptDraw PRO software with templates, samples and library of vector stencils for drawing the accounting flow charts.
HelpDesk
How to Create a Fault Tree Analysis Diagram (FTD) in ConceptDraw PRO
Fault Tree Diagram are logic diagram that shows the state of an entire system in a relationship of the conditions of its elements. Fault Tree Diagram are used to analyze the probability of functional system failures and safety accidents. ConceptDraw PRO allows you to create professional Fault Tree Diagrams using the basic FTD symbols. An FTD visualize a model of the processes within a system that can lead to the unlikely event. A fault tree diagrams are created using standard logic symbols . The basic elements in a fault tree diagram are gates and events.HelpDesk
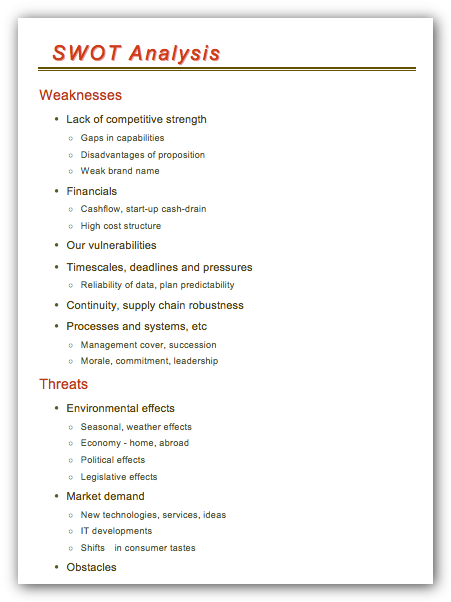
How to Make SWOT Analysis in a Word Document
A SWOT analysis is a strategic planning tool that helps to identify and compare strengths and weaknesses with opportunities and threats to make a decision and create an action plan. When performing a SWOT analysis, one can create a table split up into four columns so as to list each impacting element side-by-side for comparison, but typically it is conducted using a four-square SWOT analysis template. Using mind map allows you to collect and structure an information involved in SWOT Analysis then, you can export your SWOT mind map into a MS Word document that allows you to present and collaborate your business strategic SWOT analysis matrix in MS Word document.Create Process Flowcharts
A process flowchart is a picture of the separate steps of a process in sequential order.Use ConceptDraw PRO software and the vector stencils from object libraries are designed objects you can use adding to process flowcharts for the best result.Business diagrams & Org Charts with ConceptDraw PRO
The business diagrams are in great demand, they describe the business processes, business tasks and activities which are executed to achieve specific organizational and business goals, increase productivity, reduce costs and errors. They let research and better understand the business processes. ConceptDraw PRO is a powerful professional cross-platform business graphics and business flowcharting tool which contains hundreds of built-in collections of task-specific vector stencils and templates. They will help you to visualize and structure information, create various Business flowcharts, maps and diagrams with minimal efforts, and add them to your documents and presentations to make them successful. Among them are Data flow diagrams, Organization charts, Business process workflow diagrams, Audit flowcharts, Cause and Effect diagrams, IDEF business process diagrams, Cross-functional flowcharts, PERT charts, Timeline diagrams, Calendars, Marketing diagrams, Pyramids, Target diagrams, Venn diagrams, Comparison charts, Analysis charts, Dashboards, and many more. Being a cross-platform application, ConceptDraw PRO is very secure, handy, free of bloatware and one of the best alternatives to Visio for Mac users.
Technical Flow Chart
Flow chart is a diagrammatic representation of an algorithm and essential part of planning the system. Flow charts are widely used in technical analysis and programming for easy writing programs and explaining them to others. So, one of the most popular type of flow charts is Technical Flow Chart. Technical Flow Chart can be drawn by pencil on the paper, but it will be easier to use for designing a special software. ConceptDraw PRO diagramming and vector drawing software extended with Flowcharts Solution from the "Diagrams" Area of ConceptDraw Solution Park will be useful for this goal.HelpDesk
How To Create Root Cause Analysis Diagram Using ConceptDraw Office
Root Cause Analysis (RCA) is used to determine the main causes of the problem. If the certain factor is the root cause, this mean that its vanishing will help to prevent the further recurrence of the problem. Root Cause Analysis diagram is used to analyze the root causes of factors that influence the problem. It helps to identify the root causes for a factor and then propose possible corrective actions. A diagram is constructed separately for each high priority factor. The ability to create a RCA tree diagram from a mind map is supported by the ConceptDraw Seven Management and Planning Tools solution.
 Audit Flowcharts
Audit flowcharts solution extends ConceptDraw PRO software with templates, samples and library of vector stencils for drawing the audit and fiscal flow charts.
Account Flowchart Stockbridge System. Flowchart Examples
Create your own flow charts of data processing systems using the ConceptDraw PRO diagramming and vector drawing software extended with the Cross-Functional Flowcharts solution from the Business Processes area of ConceptDraw Solution Park. This is a flowchart of a data processing system combining manual and computerized processing to handle accounts receivable, billing, and general ledger.TQM Diagram Example
The Total Quality Management Diagram solution helps you and your organization visualize business and industrial processes. Create Total Quality Management diagrams for business process with ConceptDraw software."Business process improvement (BPI) is a systematic approach to help an organization optimize its underlying processes to achieve more efficient results. ...
An organization is only as good as its processes. To be able to make the necessary changes in an organization, one needs to understand the key processes of the company. Rummler and Brache suggested a model for running a Process Improvement and Management project (PI&M), containing the following steps:
1. Identify the process to be improved (based on a critical business issue): The identification of key processes can be a formal or informal exercise. The management team might select processes by applying a set of criteria derived from strategic and tactical priorities, or process selection is based on obvious performance gaps. It is important is to select the process(es) which have the greatest impact on a competitive advantage or customer requirement.
2. Develop the objective(s) for the project based on the requirements of the process: The focus might be on quality improvement, productivity, cost, customer service or cycle time. The goal is however always the same; to get the key process under control.
3. Select the members of the cross-functional team: A horizontal (cross-functional) analysis is carried out by a team composed of representatives of all functions involved in the process. While a consultant or in-house staff person can do the job, the quality of the analysis and the commitment to change is far greater with a cross-functional team.
4. Document the current process by creating a flowchart or "organization map": Describe the process regarding the Organizational level, the Process level and the Job/ Performer level according to Rummler. Develop a cross-functional process map for the process.
5. Identify "disconnects" in the process: “Disconnections” are everything that inhibit the efficiency and effectiveness of the process. The identification should be categorized into the three levels: The Organizational level, the Process level and the Job/ Performer level.
6. Recommend changes (organizational, in the process or in its execution): Categorize and prioritize the main problems and possibilities, evaluate alternative solutions. Develop a cross-functional process map for the recommended process.
7. Establish process and sub-process measures: The process measures should reflect the objectives of the project.
8. Implement the improvements." [Business process improvement. Wikipedia]
The opportunity flow chart example "Replacing engine oil" was created using the ConceptDraw PRO diagramming and vector drawing software extended with the Cross-Functional Flowcharts solution from the Business Processes area of ConceptDraw Solution Park.
Flowchart
The Flowcharts are widespread in various fields and include the multitude of types. They are dedicated to representation the algorithms, processes, workflows of any complexity in a clear and intuitive format. The Flowcharts are commonly used in software development as a visual tool for illustration algorithms and logic of computer programs, in business for illustration business scenarios, in education, and so on. For drawing the Flowchart are used the special object blocks, among them rectangle or box used to represent an activity or step, rounded box or oval to depict Start / End, diamond to represent the decision point (involves the branching yes/no), circle used to represent the point of connection, parallelogram to represent the Input / Output, and some others. With ConceptDraw PRO including Flowcharts solution it is easy to create professional-looking Flowchart diagrams of any complexity and any degree of detailing. Succeed in drawing the Flowcharts using quick-start templates, predesigned samples and extensive libraries of ready-made flowchart symbols, blocks and icons.HelpDesk
How to Create a SWOT Matrix Quickly
ConceptDraw PRO allow create SWOT Matrix in just one click for presenting analysis results preformed in mimd map structure using ConceptDraw MINDMAP.- Sample Flow Chart In Account Analysis
- Process Flowchart | Structured Systems Analysis and Design ...
- Flowchart Example: Flow Chart of Marketing Analysis | Marketing ...
- SWOT Analysis | SWOT Analysis Software | Flowchart Example ...
- Structured Systems Analysis and Design Method (SSADM) with ...
- Flowchart Example: Flow Chart of Marketing Analysis | Flowchart ...
- Process Analysis Flowchart
- Flowchart Analysis Types
- Pie Chart Software | Marketing Analysis Diagram | Flowchart ...
- Marketing Analysis Diagram | Flowchart Example: Flow Chart of ...
- Structured Systems Analysis and Design Method (SSADM) with ...
- Flowchart Example: Flow Chart of Marketing Analysis
- Process Flowchart | Cross-Functional Flowcharts | Data Flow ...
- Flow Chart of Marketing Analysis
- Flowchart Example: Flow Chart of Marketing Analysis | Cross ...
- Audit failure - Fault tree analysis diagram | Linux Audit Flowchart ...
- Flowchart Example: Flow Chart of Marketing Analysis | Scatter Chart ...
- Marketing | Flowchart Example: Flow Chart of Marketing Analysis ...
- Flowchart Example: Flow Chart of Marketing Analysis | Flow ...


