This site uses cookies. By continuing to browse the ConceptDraw site you are agreeing to our Use of Site Cookies.

Process Flowchart

The main reason of using Process Flowchart or PFD is to show relations between major parts of the system. Process Flowcharts are used in process engineering and chemical industry where there is a requirement of depicting relationships between major components only and not include minor parts. Process Flowcharts for single unit or multiple units differ in their structure and implementation. ConceptDraw PRO is Professional business process mapping software for making Process flowcharts, Process flow diagram, Workflow diagram, flowcharts and technical illustrations for business documents and also comprehensive visio for mac application. Easier define and document basic work and data flows, financial, production and quality management processes to increase efficiency of your business with ConcepDraw PRO. Business process mapping software with Flowchart Maker ConceptDraw PRO includes extensive drawing tools, rich examples and templates, process flowchart symbols and shape libraries, smart connectors that allow you create the flowcharts of complex processes, process flow diagrams, procedures and information exchange. Process Flowchart Solution is project management workflow tools which is part ConceptDraw Project marketing project management software. Drawing charts, diagrams, and network layouts has long been the monopoly of Microsoft Visio, making Mac users to struggle when needing such visio alternative like visio for mac, it requires only to view features, make a minor edit to, or print a diagram or chart. Thankfully to MS Visio alternative like ConceptDraw PRO software, this is cross-platform charting and business process management tool, now visio alternative for making sort of visio diagram is not a problem anymore however many people still name it business process visio tools.
How To Create a Process Flow Chart (business process modelling techniques)

entity-relationship diagram, ER-diagram, database ERD Entity-Relationship Diagram (ERD)

entity-relationship diagram, ER-diagram, database ERD
Entity-Relationship Diagram (ERD) solution extends ConceptDraw PRO software with templates, samples and libraries of vector stencils from drawing the ER-diagrams by Chen's and crow’s foot notations.

cross-functional flowchart template, flowchart, example business process flow Cross-Functional Flowcharts

cross-functional flowchart template, flowchart, example business process flow
Cross-functional flowcharts are powerful and useful tool for visualizing and analyzing complex business processes which requires involvement of multiple people, teams or even departments. They let clearly represent a sequence of the process steps, the order of operations, relationships between processes and responsible functional units (such as departments or positions).

Types of Flowchart - Overview

When designing a process or an instruction in clear and understandable way, you should consider creating a flowchart. You can avoid spending a lot of time understanding complex concepts as they get clear with different diagrams. The flowcharts are very popular diagram type, they are useful at different fields from the description business processes to the presentation of cooking recipes. Basic Flowchart, Business Process Modeling Diagram, Process Flowchart, Cross Functional Flowchart, Procedure Flowchart, Data Flow Diagram, IDEF Flowchart, SDL Diagram, Workflow Diagram, Document Flowchart, Program Flowchart, Value Stream Map, System Flowchart, Highlight Flowchart, Sales Flowchart are the main types flowchart. The ConceptDraw PRO is one of the professional applications which has great advantages and using which you can create different types of Flowcharts easy and fast. Try to draw an illustrative and comprehensible diagram in ConceptDraw PRO describing the processes instead of writing complex long text and make sure how it is convenient. Visio is expensive, and if you use it in a team environment, these costs are compounded. ConceptDraw PRO is an affordable alternative to Visio and luckily, it comes with a team plan. ConceptDraw PRO can import and export Visio files, so Mac users can collaborate with PC users stuck on Microsoft's software.
How to Simplify Flow Charting
HelpDesk

How to Create an ERD Diagram

ERD (entity relationship diagram) is used to show the logical structure of databases. It represents the interrelationships between components of database (entities). Entity relationship diagrams are a widely used in software engineering. Using ERD software engineers can control the every aspect of database development. ER diagram can be used as guide for testing and communicating before the release of software product. ERD displays data as entities that are connected with connections that show the relationships between entities. There is some ERD notations used by data bases developers for representing the relationships between the data objects. ConceptDraw PRO and its ERD solution allow you to build ERD diagram of any notation.
HelpDesk

How to Create a Data Flow Diagram

Data flow diagramming is a highly effective technique for showing the flow of information through a system. Data flow diagrams reveal relationships among and between the various components in a program or system. DFD is an important technique for modeling a system’s high-level detail by showing how input data is transformed to output results through a sequence of functional transformations. The set of standard symbols is used to depict how these components interact in a system. ConceptDraw PRO allows you to draw a simple and clear Data Flow Diagram using special libraries.

Flow chart Example. Warehouse Flowchart

Warehouse Flowcharts are various diagrams that describe the warehousing and inventory management processes on the warehouses. Typical purposes of Warehouse Flowcharts are evaluating warehouse performance, measuring efficiency of customer service and organizational performance. This type of Workflow diagrams can be used for identifying any disconnection between business activities and business objectives. They are effectively used by warehouse-related people and organizations, manufacturers, wholesalers, exporters, importers, transporters, and others. Standard Warehousing process flow diagram and standard Workflow diagram are used for process identification for further evaluating effectiveness and profitability of overall business process. Use the ConceptDraw PRO vector graphic software extended with Flowcharts solution to design your own professional-looking Workflow diagrams and Flowcharts of any types, including the Warehouse flowchart, Process flow diagrams which depict in details all steps of Warehouse packages flow. Microsoft Visio, designed for Windows users, can’t be opened directly on Mac. But fortunately, there are several Visio alternatives for Mac which will help Mac users to work Visio files. With ConceptDraw PRO, you may open, edit and save files in Visio format.
ConceptDraw Arrows10 Technology
HelpDesk

How to Create an Entity-Relationship Diagram Using ConceptDraw Solution Park

An entity-relationship diagram (ERD)is used in a database modeling process. ERD diagram shows a graphical representation of objects or concepts within an information system and their relationships.The ability to  describe a database using the Entity-Relationship model is delivered by the ConceptDraw ERD solution.

Business diagrams & Org Charts with ConceptDraw PRO

The business diagrams are in great demand, they describe the business processes, business tasks and activities which are executed to achieve specific organizational and business goals, increase productivity, reduce costs and errors. They let research and better understand the business processes. ConceptDraw PRO is a powerful professional cross-platform business graphics and business flowcharting tool which contains hundreds of built-in collections of task-specific vector stencils and templates. They will help you to visualize and structure information, create various Business flowcharts, maps and diagrams with minimal efforts, and add them to your documents and presentations to make them successful. Among them are Data flow diagrams, Organization charts, Business process workflow diagrams, Audit flowcharts, Cause and Effect diagrams, IDEF business process diagrams, Cross-functional flowcharts, PERT charts, Timeline diagrams, Calendars, Marketing diagrams, Pyramids, Target diagrams, Venn diagrams, Comparison charts, Analysis charts, Dashboards, and many more. Being a cross-platform application, ConceptDraw PRO is very secure, handy, free of bloatware and one of the best alternatives to Visio for Mac users.
Draw Business Process Diagrams

fishbone diagram, Ishikawa diagram, cause and effect analysis Fishbone Diagrams

fishbone diagram, Ishikawa diagram, cause and effect analysis
The Fishbone Diagrams solution extends ConceptDraw PRO v10 software with the ability to easily draw the Fishbone Diagrams (Ishikawa Diagrams) to clearly see the cause and effect analysis and also problem solving. The vector graphic diagrams produced using this solution can be used in whitepapers, presentations, datasheets, posters, and published technical material.

workflow diagram software, workflow patterns Workflow Diagrams

workflow diagram software, workflow patterns
Workflow Diagrams solution extends ConceptDraw PRO software with samples, templates and vector stencils library for drawing the work process flowcharts.
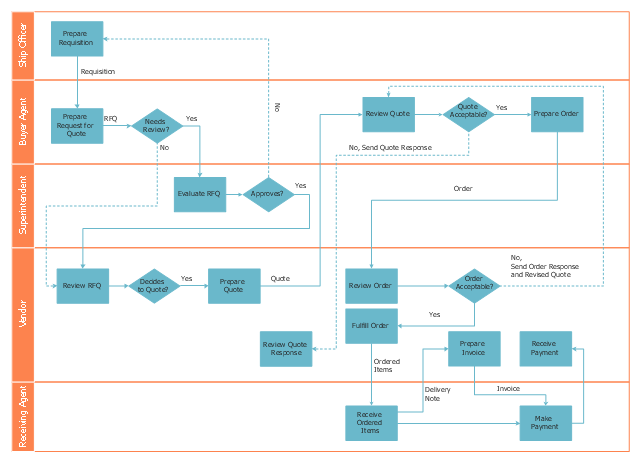
"Trade, also called goods exchange economy, is to transfer the ownership of goods from one person or entity to another by getting something in exchange from the buyer. Trade is sometimes loosely called commerce or financial transaction or barter. A network that allows trade is called a market. ...
Modern traders ... generally negotiate through a medium of exchange, such as money. As a result, buying can be separated from selling, or earning. ...
Retail trade consists of the sale of goods or merchandise from a very fixed location, such as a department store, boutique or kiosk, or by mail, in small or individual lots for direct consumption by the purchaser. Wholesale trade is defined as the sale of goods that are sold merchandise to retailers, to industrial, commercial, institutional, or other professional business users, or to other wholesalers and related subordinated services." [Trade. Wikipedia]
The deployment flow chart example "Trading process diagram" was created using the ConceptDraw PRO diagramming and vector drawing software extended with the Cross-Functional Flowcharts solution from the Business Processes area of ConceptDraw Solution Park.
Deployment flowchart
Deployment flowchart, process, horizontal swimlanes, decision,

ConceptDraw Solution Park ConceptDraw Solution Park

ConceptDraw Solution Park
ConceptDraw Solution Park collects graphic extensions, examples and learning materials

interactive voice response system, IVR Interactive Voice Response Diagrams

interactive voice response system, IVR
Interactive Voice Response Diagrams solution extends ConceptDraw PRO v10 software with samples, templates and libraries of ready-to-use vector stencils that help create Interactive Voice Response (IVR) diagrams illustrating in details a work of interactive voice response system, the IVR system’s logical and physical structure, Voice-over-Internet Protocol (VoIP) diagrams, and Action VoIP diagrams with representing voice actions on them, to visualize how the computers interact with callers through voice recognition and dual-tone multi-frequency signaling (DTMF) keypad inputs.

Types of Flowcharts

A Flowchart is a graphical representation of process, algorithm, workflow or step-by-step solution of the problem. It shows the steps as boxes of various kinds and connects them by arrows in a defined order depicting a flow. There are twelve main Flowchart types: Basic Flowchart, Business Process Modeling Diagram (BPMN), Cross Functional Flowchart, Data Flow Diagram (DFD), IDEF (Integrated DEFinition) Flowchart, Event-driven Process Chain (EPC) Diagram, Influence Diagram (ID), Swimlane Flowchart, Process Flow Diagram (PFD), Specification and Description Language (SDL) Diagram, Value Stream Mapping, Workflow Diagram. Using the Flowcharts solution from the Diagrams area of ConceptDraw Solution Park you can easy and quickly design a Flowchart of any of these types. This solution offers a lot of special predesigned vector symbols for each of these widely used notations. They will make the drawing process of Flowcharts much easier than ever. Pay also attention for the included collection of ready Flowchart examples, samples and quick-start templates. This is business process improvement tools. If you are looking for MS Visio for your Mac, then you are out of luck, because it hasn't been released yet. However, you can use Visio alternatives that can successfully replace its functions. ConceptDraw PRO is an alternative to MS Visio for Mac that provides powerful features and intuitive user interface for the same.
How to Simplify Flow Charting

Business Diagram Software

When managing the projects, people, or networks, there are daily designed and used different types of Business diagrams, so the powerful drawing software will be very useful for this. ConceptDraw PRO with large quantity of business solutions will meet your needs and will help you convey your ideas successful and rapidly, no matter are you professional or beginner. It is the best choice for business specialists and technical professionals who need quickly and easily explore, visualize, and communicate information. ConceptDraw PRO business diagram software is the most powerful business software and relational charting software. Create advanced, completely customizable Business Process Diagrams, Business Flow Charts, Work Flow Diagrams, Organizational Charts, Audit diagrams, Marketing diagrams, Value Stream Maps, TQM diagrams, ERD diagrams, EPC diagrams, Cause and Effect diagrams, Infographics, Dashboards, and other Relational business diagrams from your data using the powerful drawing tools of ConceptDraw Solution Park.
Business Process Modeling

fishbone diagram, Ishikawa diagram, cause and effect analysis Fishbone Diagram

fishbone diagram, Ishikawa diagram, cause and effect analysis
Fishbone Diagrams solution extends ConceptDraw PRO software with templates, samples and library of vector stencils for drawing the Ishikawa diagrams for cause and effect analysis.

audit flowchart, fiscal flowchart, audit steps, chart audits, chart auditor, auditing process, audit process flowchart, audit planning process Audit Flowcharts

audit flowchart, fiscal flowchart, audit steps, chart audits, chart auditor, auditing process, audit process flowchart, audit planning process
Audit flowcharts solution extends ConceptDraw PRO software with templates, samples and library of vector stencils for drawing the audit and fiscal flow charts.

microsoft azure, windows azure, azure management, azure storage, azure blob storage, azure services Azure Architecture

microsoft azure, windows azure, azure management, azure storage, azure blob storage, azure services
Azure Architecture solution bundles into one handy tool everything you need to create effective Azure Architecture diagrams. It adds the extra value to versatile ConceptDraw PRO software and extends the users capabilities with comprehensive collection of Microsoft Azure themed graphics, logos, preset templates, wide array of predesigned vector symbols that covers the subjects such as Azure management, Azure storage, and Azure services, amongst others, and allow you to illustrate Azure Architecture diagrams at any degree of complexity, to present visually your Azure cloud system architecture with professional style, to design Azure cloud topology, to document Windows Azure Architecture and Azure Cloud System Architecture, to visualize the great abilities and work of Microsoft Azure Cloud System and Azure services.

social media flow chart, social media marketing Social Media Response

social media flow chart, social media marketing
This solution extends ConceptDraw DIAGRAM and ConceptDraw MINDMAP with the ability to draw interactive flow charts with action mind map templates, to help create an effective response to applicable social media mentions.