Accounting Cycle Example
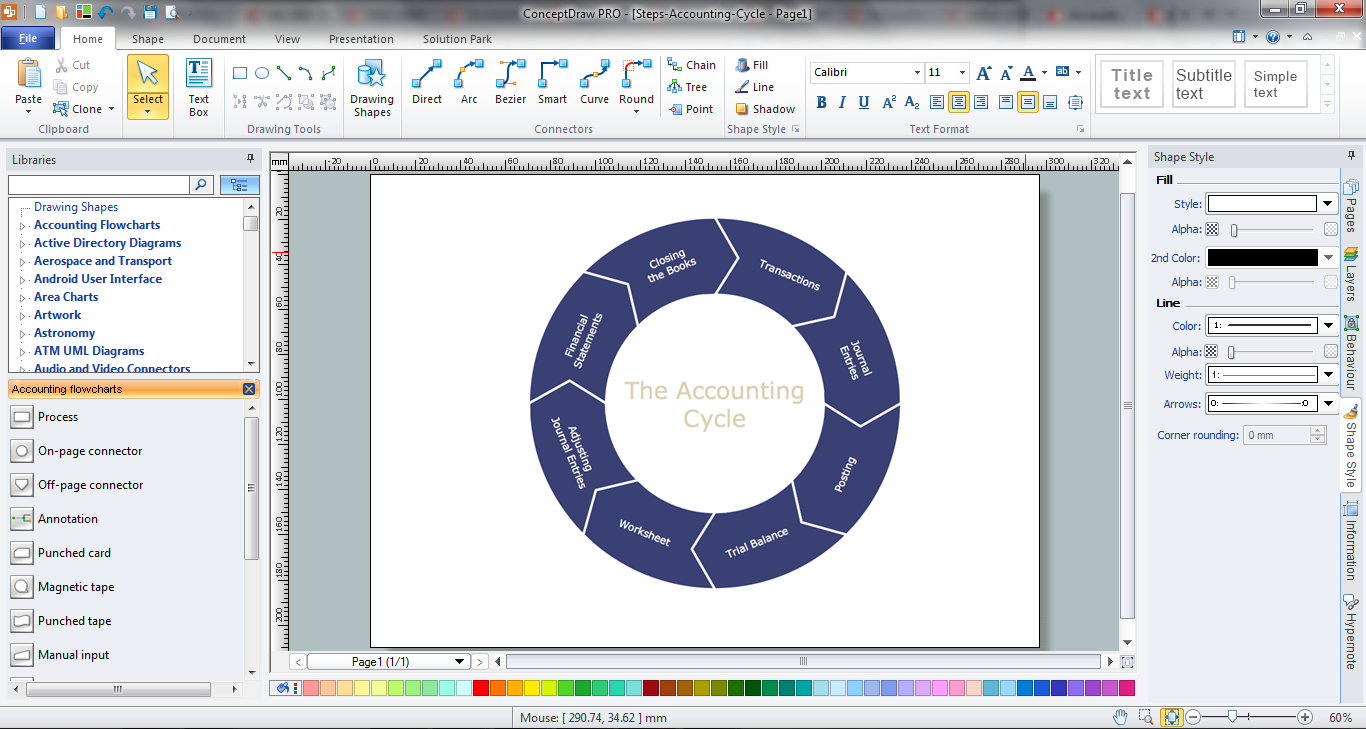
Accounting cycle is a sequence of activities which are involved in completing an accounting process. The length of an accounting cycle is changed from organization to organization, this can be month, quarter, half-year, or year. ConceptDraw DIAGRAM diagramming and vector drawing software extended with Accounting Flowcharts Solution from the Finance and Accounting Area of ConceptDraw Solution Park offers the extensive drawing tools, library with ready-to-use vector elements which will help you design any accounting cycle example you need.Account Flowchart. Flowchart Examples
Create your own flow charts of computer or network system account processing using the ConceptDraw DIAGRAM diagramming and vector drawing software extended with the Cross-Functional Flowcharts solution from the Business Processes area of ConceptDraw Solution Park. The flow chart example shows the computer network system account processing.Entity Relationship Diagram Symbols
The semantic modeling method nowadays is successfully applied in database structure design. It is effective method of modeling the data structures, which is based on the meaning of these data. As a tool of semantic modeling, there are used different types of Entity-Relationship Diagrams. Entity Relationship Diagram (ERD) is applied to visually and clearly represent a structure of a business database. The main components of ERDs are: entity, relation and attributes. An entity is a class of similar objects in the model, each entity is depicted in the form of rectangle and has the name expressed by a noun. Relation is shown in the form of non-directional line that connects two entities. There are several notation styles used for ERDs: information engineering style, Chen style, Bachman style, Martin Style. The Entity Relationship Diagram symbols used for professional ERD drawing are predesigned by professionals and collected in the libraries of the Entity-Relationship Diagram (ERD) solution for ConceptDraw DIAGRAM software.Management - Design Elements
When you need to draw a professional management drawing, these management design elements, samples, templates and libraries with vector clip art for drawing the Marketing Illustrations. Conceptdraw symbols and signs you can use in your design for Strategic Management, Graphic Design, Planning implementation and more. You can create and view impact analysis drawings from specific design elements to examine the tasks.Business People Clipart
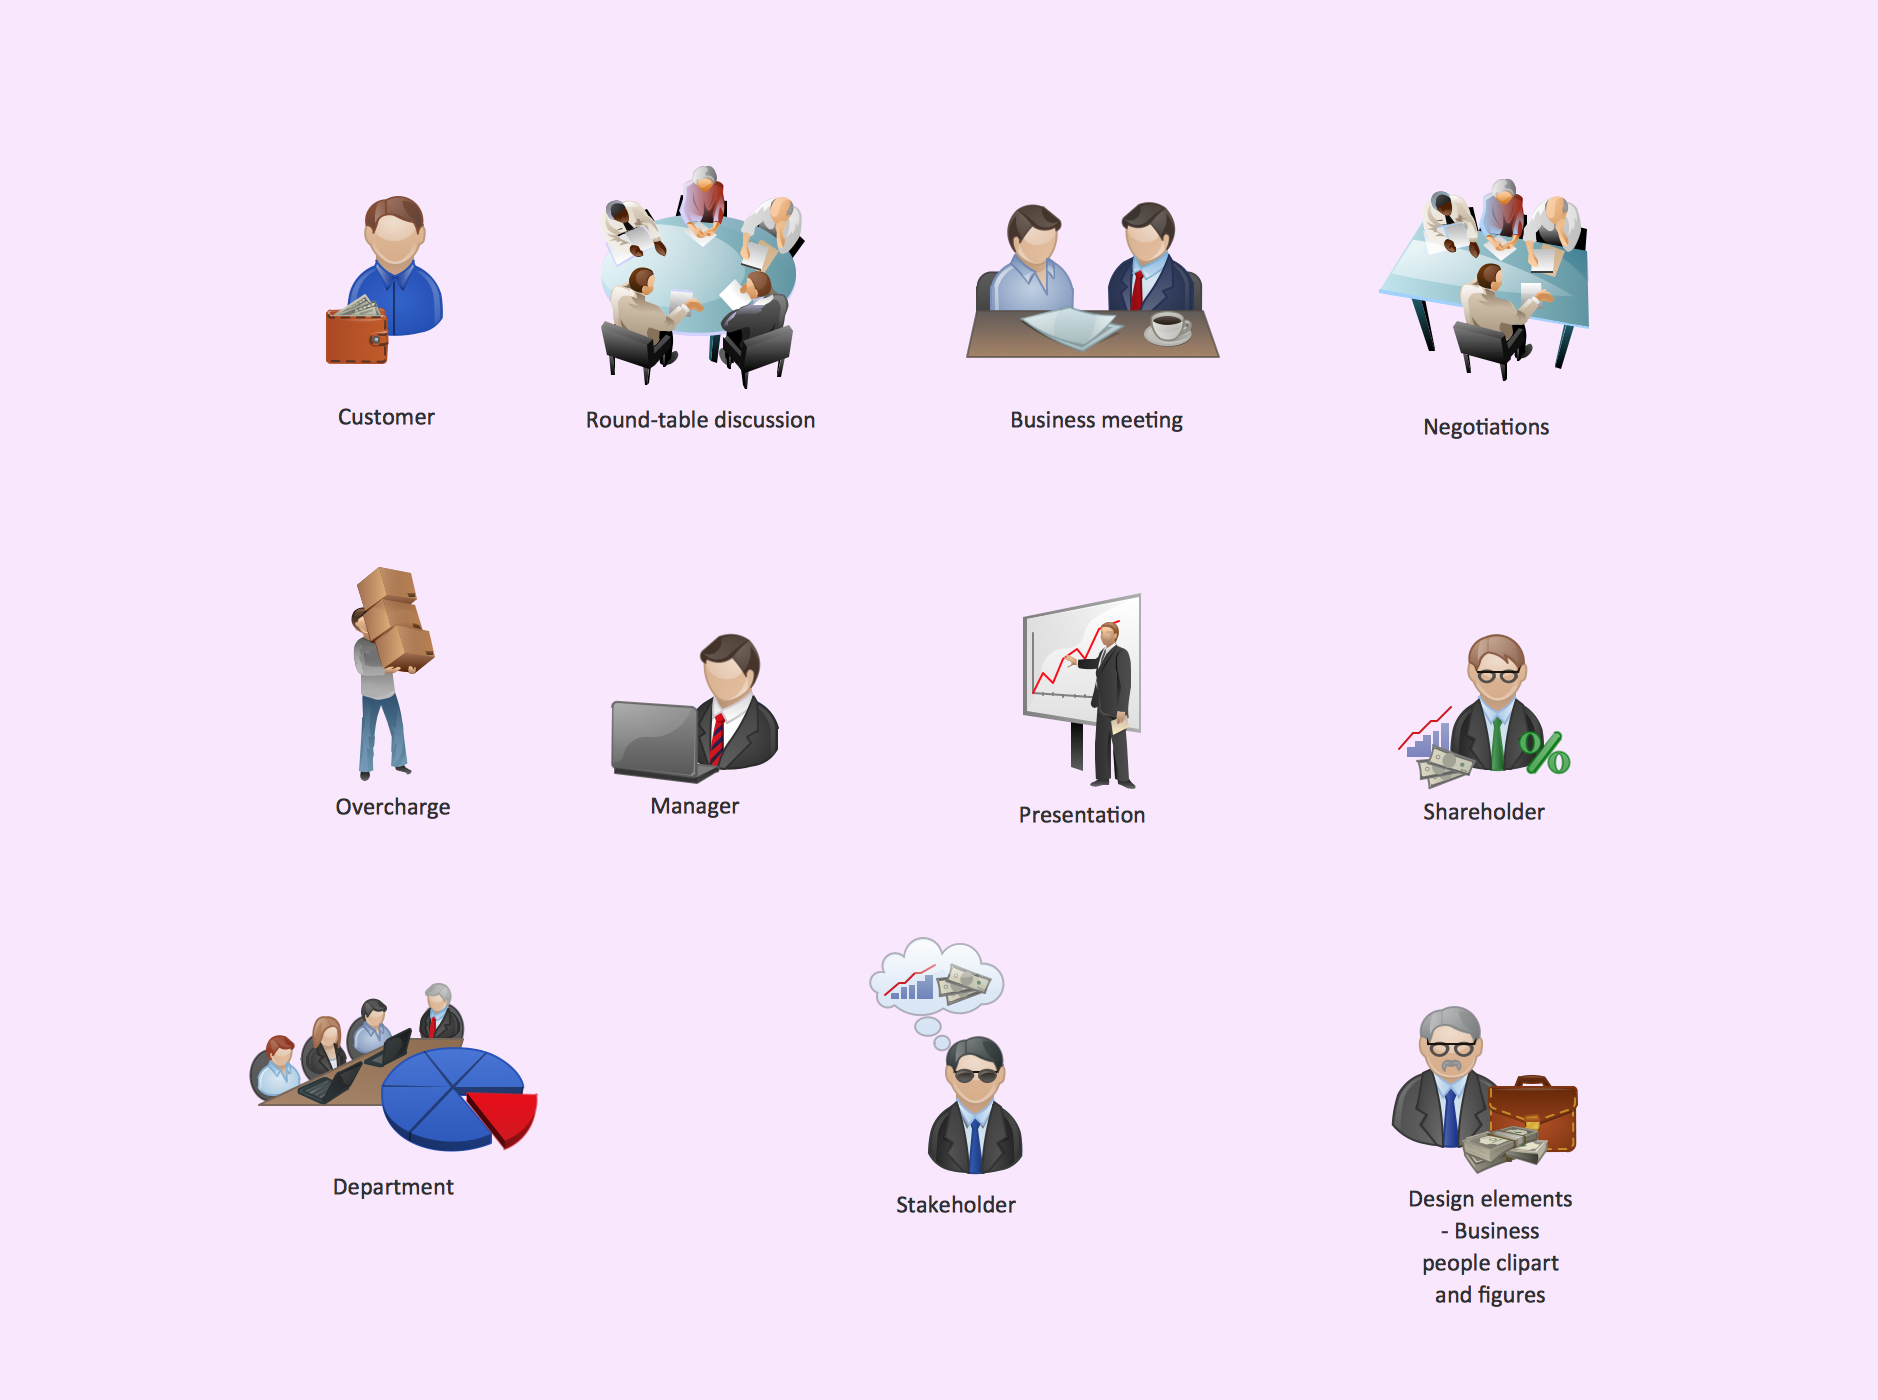
Business People Clipart - Business and Finance solution from Illustration area of ConceptDraw Solution Park. Use it to quick draw illustrations, diagrams and infographics for your business documents, presentations and websites. The vector stencils library Business People Clipart includes 12 images.Business and Finance Illustrations
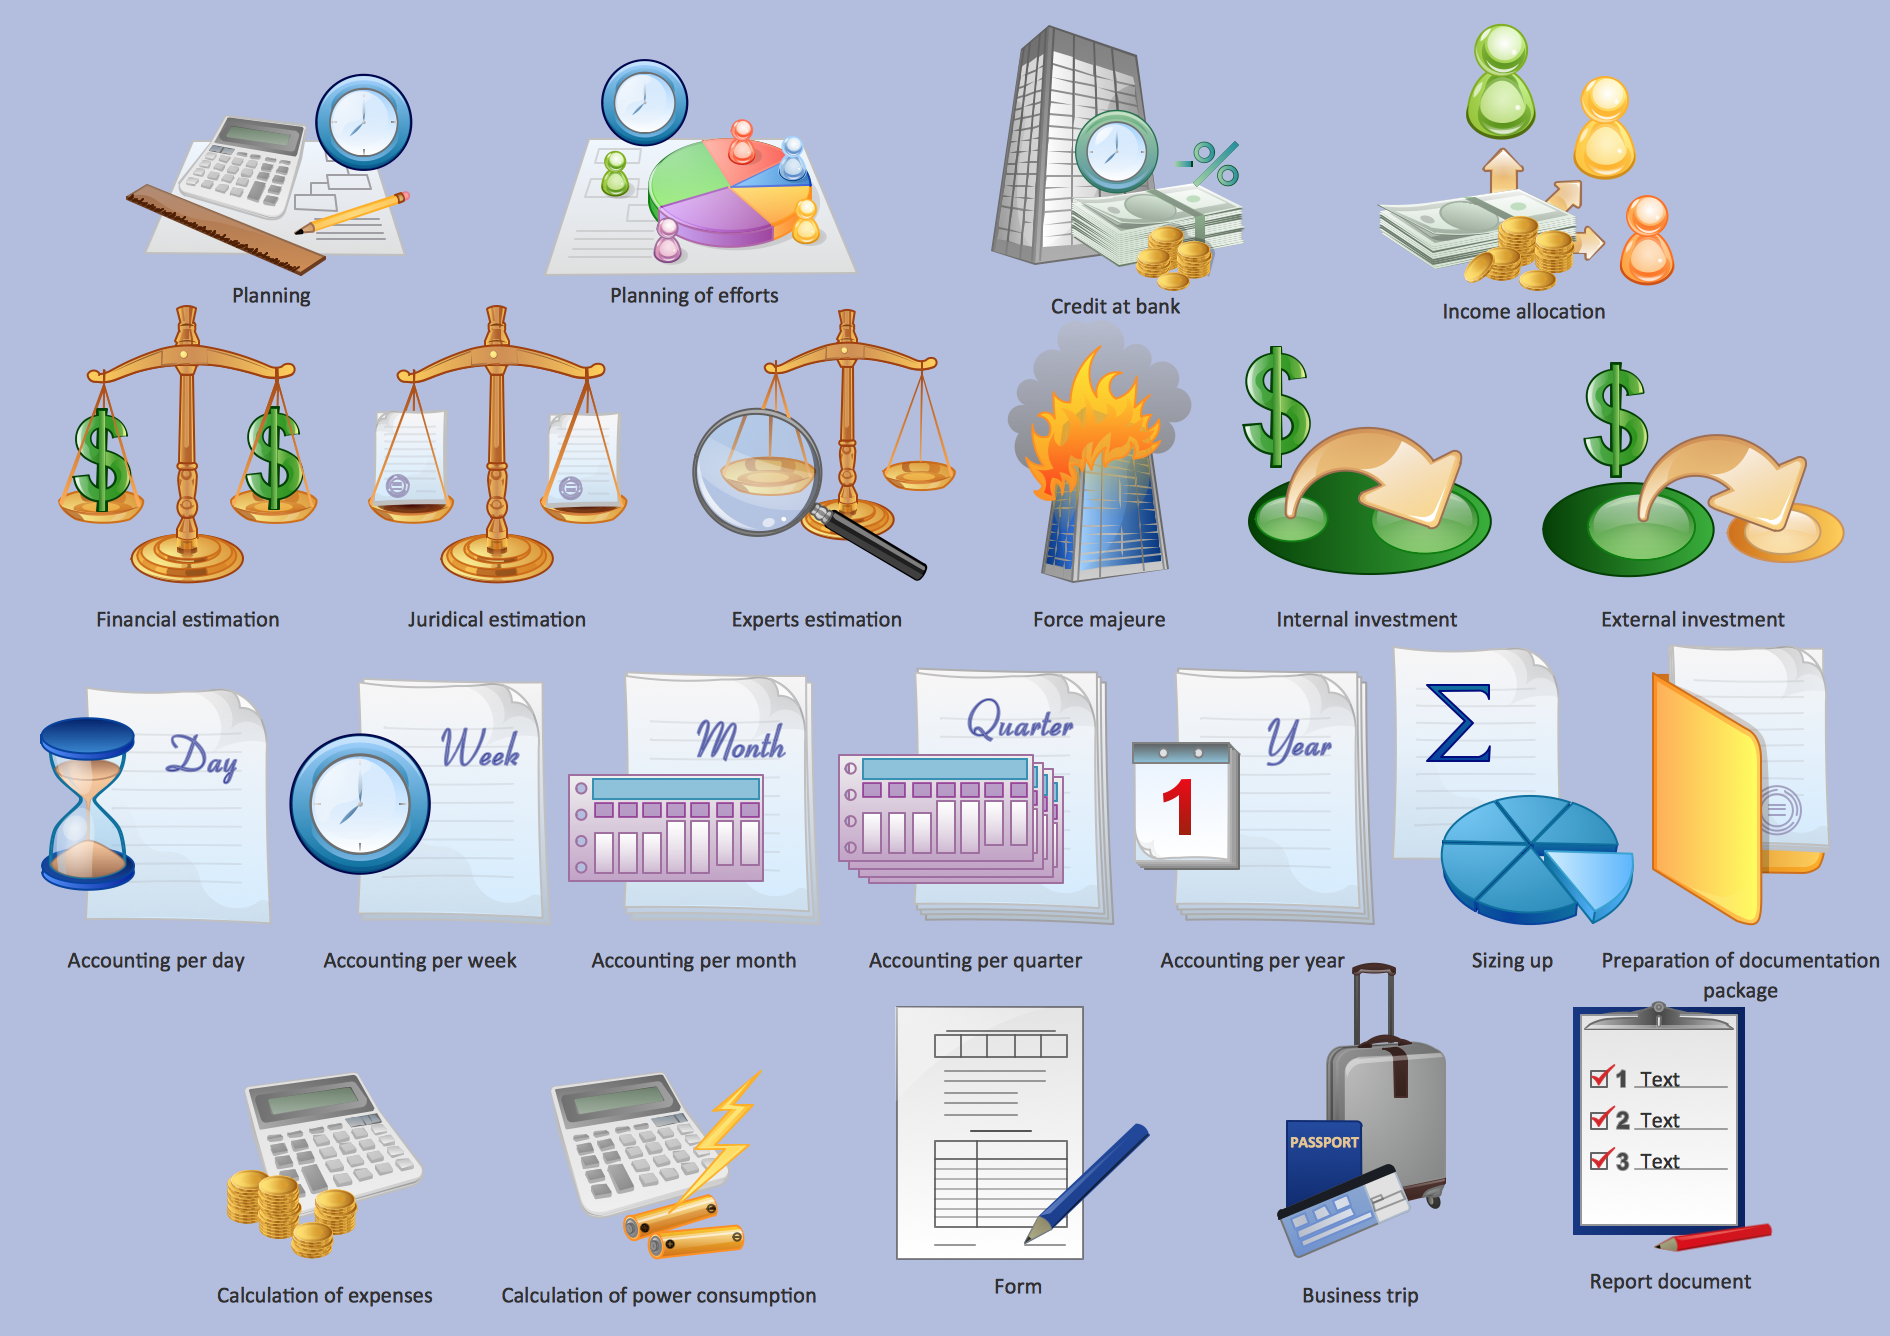
Choose the business illustration design you love best, and sign our design your own style with Business and Finance Illustrations library from ConceptDraw DIAGRAM. The Business and Finance solution contains 12 vector clipart libraries: Advertising, Business, Business people clipart, Business people figures, Currency, Mail and post, Management, Marketing, Money, Office, Project management, Time
 House of Quality
House of Quality solution provides the powerful drawing tools, numerous specific samples and examples, and set of vector design elements of House of Quality shapes and symbols, which will help you in application the Quality function deployment (QFD) methodology and in easy creation the House of Quality Matrices intended for satisfaction the consumers' desires and requirements, for representing them in a visual way and then transformation into the targets and technical requirements to be followed for development the best products.
This bank account UML package diagram was redesigned from the Wikimedia Commons file: Package diagram1.jpg.
[commons.wikimedia.org/ wiki/ File:Package_ diagram1.jpg]
This file is licensed under the Creative Commons Attribution-Share Alike 3.0 Unported license. [creativecommons.org/ licenses/ by-sa/ 3.0/ deed.en]
"A very important concept in object-oriented design, inheritance, refers to the ability of one class (child class) to inherit the identical functionality of another class (super class), and then add new functionality of its own. (In a very non-technical sense, imagine that I inherited my mother's general musical abilities, but in my family I'm the only one who plays electric guitar.) To model inheritance on a class diagram, a solid line is drawn from the child class (the class inheriting the behavior) with a closed, unfilled arrowhead (or triangle) pointing to the super class. Consider types of bank accounts: Figure 4 shows how both CheckingAccount and SavingsAccount classes inherit from the BankAccount class.
Figure 4: Inheritance is indicated by a solid line with a closed, unfilled arrowhead pointing at the super class." [ibm.com/ developerworks/ rational/ library/ content/ RationalEdge/ sep04/ bell/ index.html]
This bank account UML package diagram example was created using the ConceptDraw PRO diagramming and vector drawing software extended with the ATM UML Diagrams solution from the Software Development area of ConceptDraw Solution Park.
- How to Create a Bank ATM Use Case Diagram | Data Flow ...
- How to Add a Mind Map into a Given Notebook in Your Evernote ...
- Design elements - Accounting flowcharts | Flowchart Symbols ...
- Process Flowchart | Flowchart on Bank. Flowchart Examples | Data ...
- Flowchart on Bank. Flowchart Examples | Process Flowchart | Data ...
- Types Of Bank Flow Chart
- Basic Flowchart Symbols and Meaning | Types of Flowchart ...
- Bank System | Banking System | Class UML Diagram for Bank ...
- Flowchart on Bank. Flowchart Examples | Process Flowchart ...
- Data Flow Diagram For Facebook Application
- Data Flow Diagrams (DFD) | How to Create a Data Flow Diagram ...
- Cross-Functional Flowcharts | Business Process Diagrams ...
- UML Business Process | Basic Flowchart Symbols and Meaning ...
- Entity-Relationship Diagram (ERD) | How to Create an Entity ...
- Process Flowchart | Sequence Diagram for Cloud Computing ...
- ATM UML Diagrams | Rapid UML | Free Download Bank System Uml
- Class UML Diagram for Bank Account System | UML package ...
- Presentation Clipart | Business Process Workflow Diagrams ...
- Presentation Clipart | Illustration | ATM UML Diagrams | Banking ...
- Business People Clipart | Business and Finance Illustrations ...


