HelpDesk
How to Make an Ansoff Matrix Template in ConceptDraw PRO
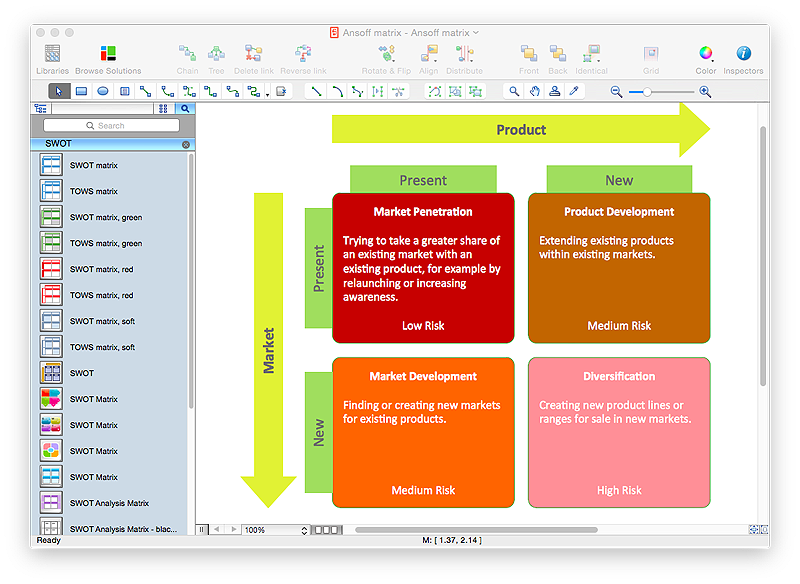
Ansoff Matrix is a business strategic management tool that helps a business determine its product and market growth strategy. Ansoff matrix has four sections to show each impacting ways that businesses can grow. Using Ansoff Matrix enables determining the current position of any business in the industry and choose the direction of its growth, which would provide the most competitive position. While Ansoff Matrix is most commonly used as a business planning tool it can be used also for personal development. You can make Ansoff Matrix template for your organization using ConceptDraw PRO Matrices solution.
 Marketing
This solution extends ConceptDraw PRO v9 and ConceptDraw MINDMAP v7 with Marketing Diagrams and Mind Maps (brainstorming, preparing and holding meetings and presentations, sales calls).
Fundraising Pyramid
ConceptDraw Pyramid Diagram software allows drawing column charts using predesigned objects or drawing tool.Bar Diagrams for Problem Solving. Create event management bar charts with Bar Graphs Solution
Create bar charts for event management problem solving and visual data comparison using the ConceptDraw PRO diagramming and vector drawing software extended with the Bar Graphs Solution from the Graphs and Charts area of ConceptDraw Solition Park.
 Matrices
This solution extends ConceptDraw PRO software with samples, templates and library of design elements for drawing the business matrix diagrams.
 Computer and Networks Area
The solutions from Computer and Networks Area of ConceptDraw Solution Park collect samples, templates and vector stencils libraries for drawing computer and network diagrams, schemes and technical drawings.
Sales Dashboard
Sales Dashboard is a useful and visual way of representing sales performances, tracking and analyzing sales. It gives a clear picture about the business development success and sales growth progress.ConceptDraw PRO software extended with Sales Dashboard solution from the Marketing area of ConceptDraw Solution Park is effective for visualizing sales data, all set of KPIs on the Sales Dashboard with purpose to see how your business develops and to make conclusions for improvement the sales.
 Line Graphs
How to draw a Line Graph with ease? The Line Graphs solution extends the capabilities of ConceptDraw PRO v10 with professionally designed templates, samples, and a library of vector stencils for drawing perfect Line Graphs.
 Picture Graphs
Typically, a Picture Graph has very broad usage. They many times used successfully in marketing, management, and manufacturing. The Picture Graphs Solution extends the capabilities of ConceptDraw PRO v10 with templates, samples, and a library of professionally developed vector stencils for designing Picture Graphs.
 Area Charts
Area Charts are used to display the cumulative totals over time using numbers or percentages; or to show trends over time among related attributes. The Area Chart is effective when comparing two or more quantities. Each series of data is typically represented with a different color, the use of color transparency in an object’s transparency shows overlapped areas and smaller areas hidden behind larger areas.
 Frequency Distribution Dashboard
Frequency distribution dashboard solution extends ConceptDraw PRO software with samples, templates and vector stencils libraries with histograms and area charts for drawing the visual dashboards showing frequency distribution of data.
 Collaboration Area
The solutions from Collaboration area of ConceptDraw Solution Park extend ConceptDraw PRO and ConceptDraw MINDMAP software with features, samples, templates and vector stencils libraries for drawing diagrams and mindmaps useful for collaboration.
- Human Resource Development | Basic Flowchart Symbols and ...
- Venn Diagram Of Growth And Development
- Human Resource Development | HR Flowcharts | Block diagram ...
- Human Resource Development | Basic Flowchart Symbols and ...
- Area Charts | Computer and Networks Area | Growth And ...
- Process Flowchart | How to Create a Bubble Diagram Using ...
- Human Resource Development | HR Flowcharts | ConceptDraw ...
- Research And Development Department
- Flowchart Examples and Templates | Basic Flowchart Symbols and ...
- Entity-Relationship Diagram (ERD) | Sales Process Flowchart ...
- Venn diagram - Path to sustainable development | ConceptDraw ...
- Venn diagram - Path to sustainable development | Process ...
- Flow Chart On Industrial Development
- Basic Flowchart Symbols and Meaning | Nature | Types of Flowchart ...
- Process Flowchart | Human Resource Development | ConceptDraw ...
- Research And Development Process Flowchart
- Sales Growth . Bar Graphs Example | Event-driven Process Chain ...
- In Flow Chart Business Development Plan
- Flowchart - Product life cycle process
- Basic Flowchart Symbols and Meaning | Entity Relationship ...


