How to Create a Social Media DFD Flowchart
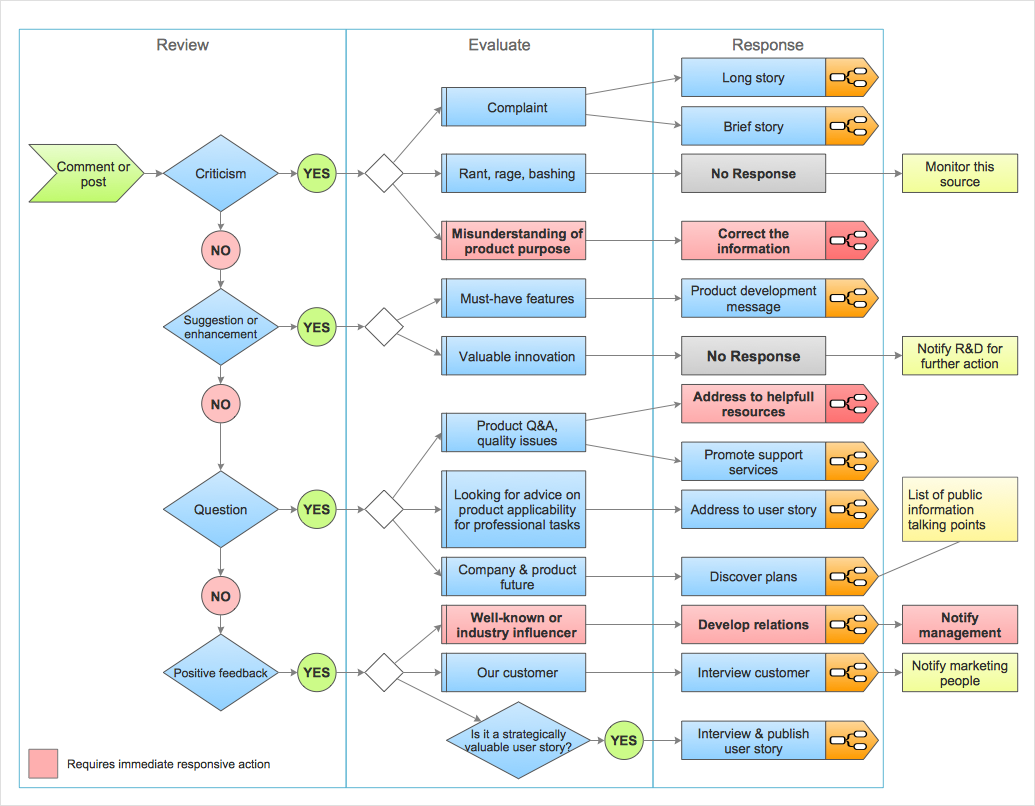
The use of social media in modern conditions helps the companies to be more effective in timely messaging - actively and rapidly response to a customer posts in social media, to find quickly the appropriate response to social media mentions, to save greatly the budget. Many companies even use the social media as a lead tool for promotion. But how to create a Social Media DFD Flowchart, Social Media Response Flowchart or Action Mind Map fast and easy? ConceptDraw DIAGRAM ector graphical software and Social Media Response solution included to ConceptDraw Solution Park assist greatly in their creation. This solution improves the quality of content in social media and helps to build an active customer community. The samples and examples included to Social Media Response solution are helpful for social media teams in developing a social media strategy, in refining and organizing the response process, in creation training materials by trainers and consultants for education the social media groups on how to accomplish the most effectiveness in their daily work.Create Response Charts
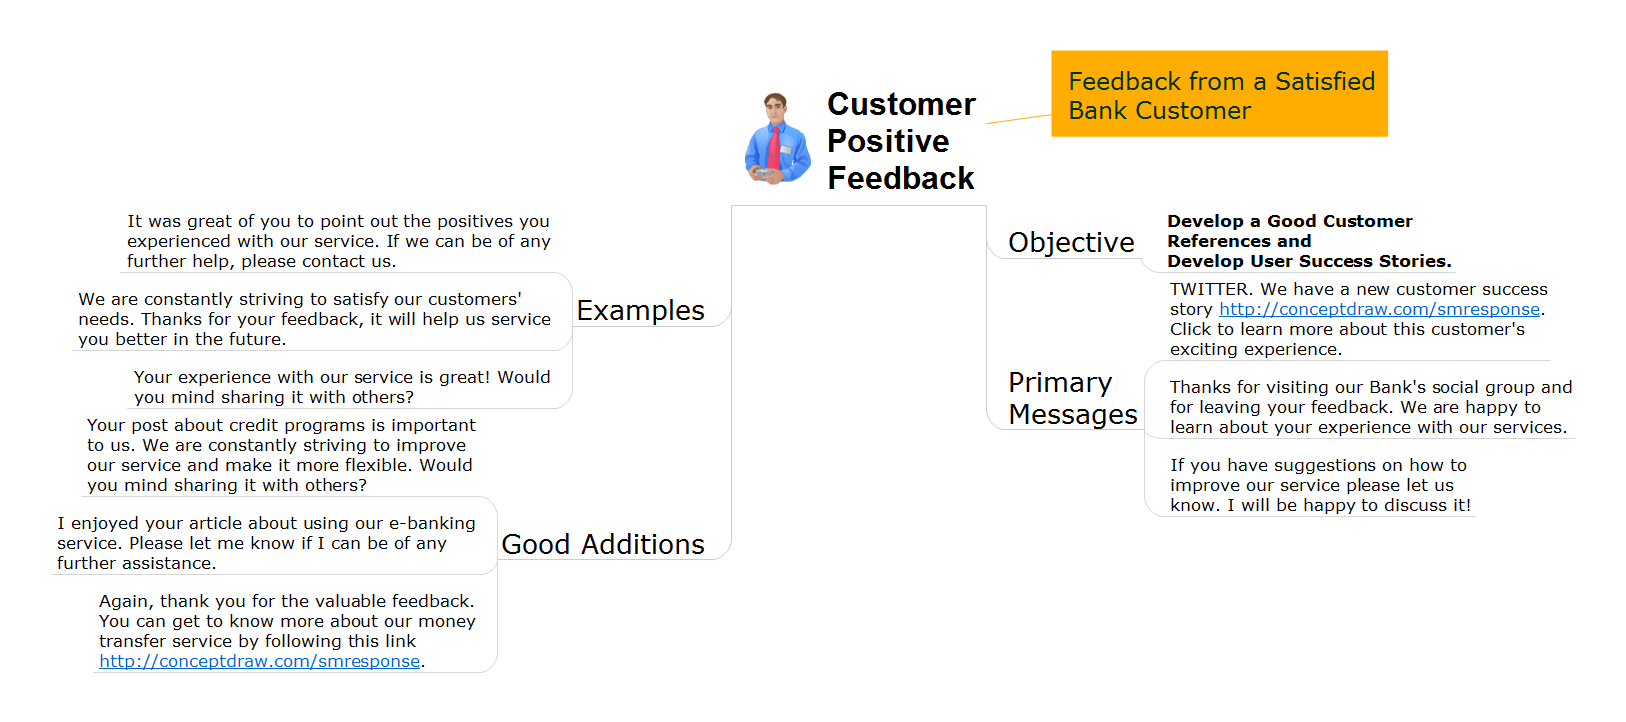
Visual navigation through the stages of a response process helps you locate specific actions to be taken via Action Mind Maps. Use ConceptDraw DIAGRAM and ConceptDraw MINDMAP for organize the process of response for interactions occurring in social media.HelpDesk
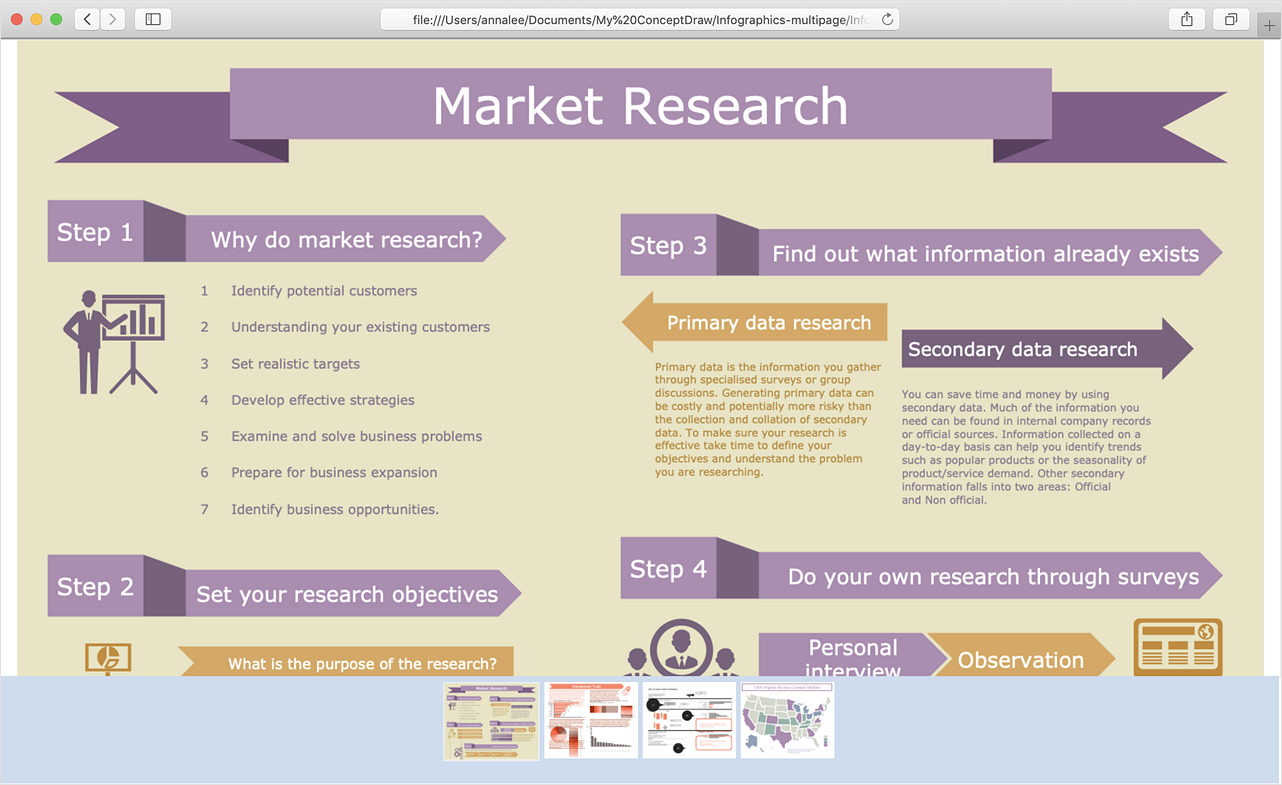
How to Make a Web Page from Infographics
Create your own original marketing illustrations and infographics, presentation slides, website, and blog pages using ConceptDraw DIAGRAM.HelpDesk
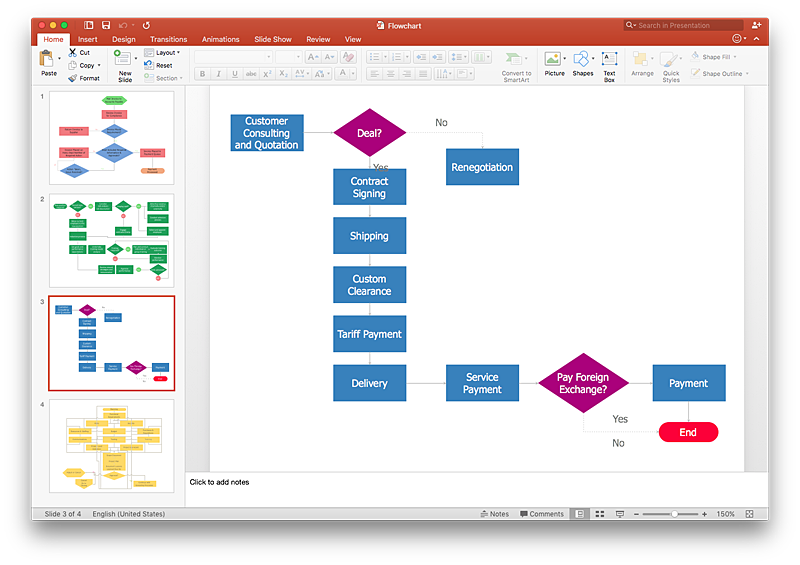
How To Make a PowerPoint Presentation of Flowcharts
ConceptDraw DIAGRAM allows you to create professional flowchart quickly and easily. The ability to create flowcharts is contained in the Flowcharts solution. To submit flowcharts for the audience, you can use export to MS PowerPoint.HelpDesk
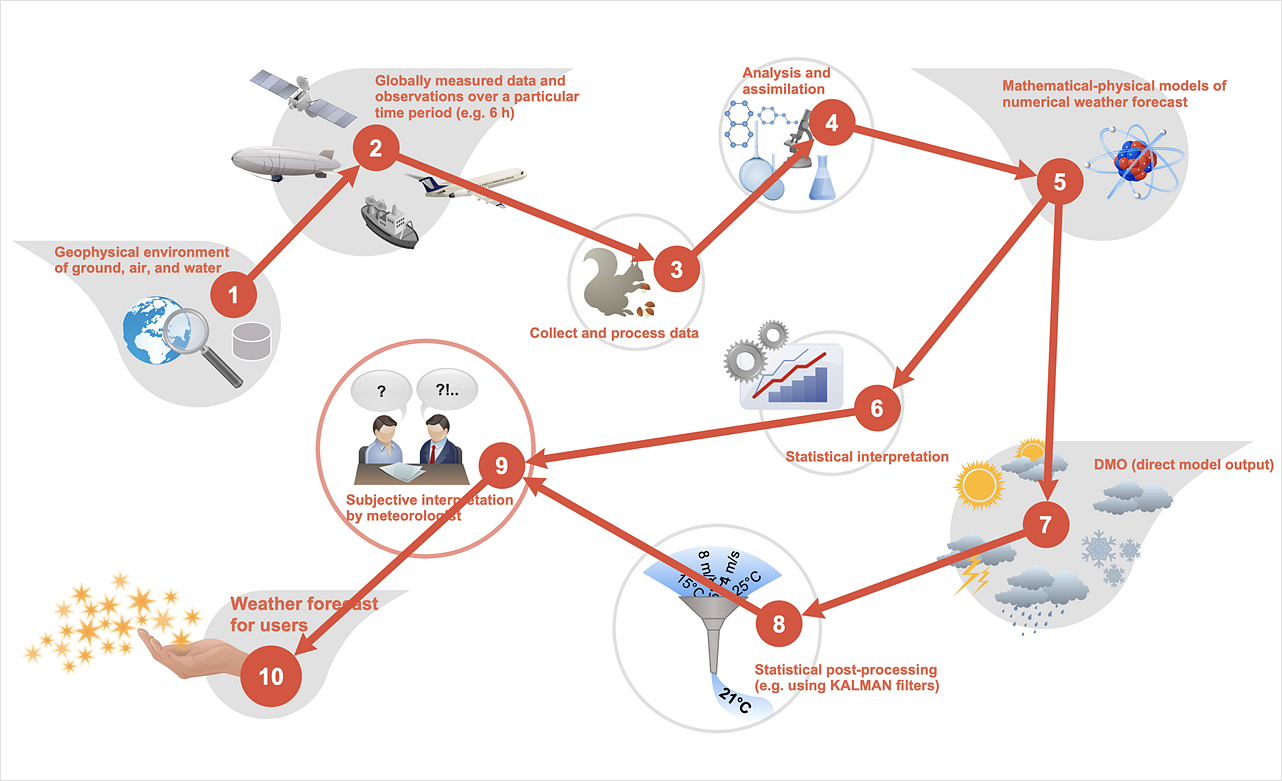
How to Make a Workflow Diagram
With the help of a workflow diagram, you can visually describe the tasks, documents, people responsible for execution at each stage of the workflow. Modern workflow diagrams have a specific focus on quality control. This can apply to the quality of inputs and outputs related to a process, or to the actual efficiency of the workflow itself. Different sectors of business use different diagramming techniques, and this has given rise to a number of methods that have become recognized in their own right as industry standards. ConceptDraw DIAGRAM, with the Workflow Diagrams solution, is ideal for creating diagrams of this type. Its RapidDraw technology takes the strain from diagram arrangement, allowing users to create their process steps with a single click, ideal for generating the many repeatable tasks that can make up a workflow. The Workflow Diagrams solution complements this feature with a library of selected icons to represent various steps.HelpDesk
How to Organize a Social Media Activity
Interactive Flowcharts describes the social media response process. The Action mind map shows examples of messages, and also defines the main objective of messaging for a specific situation. ConceptDraw Social Media Response solution helps to organize the process of response for interactions occurring in social media.
 Audit Flowcharts
Audit flowcharts solution extends ConceptDraw DIAGRAM software with templates, samples and library of vector stencils for drawing the audit and fiscal flow charts.
What is Interactive Flowcharts
Organizing and Selecting Social Media Response Messages. Interactive Flowcharts can change the way one creates and organizes their social media response process.HelpDesk
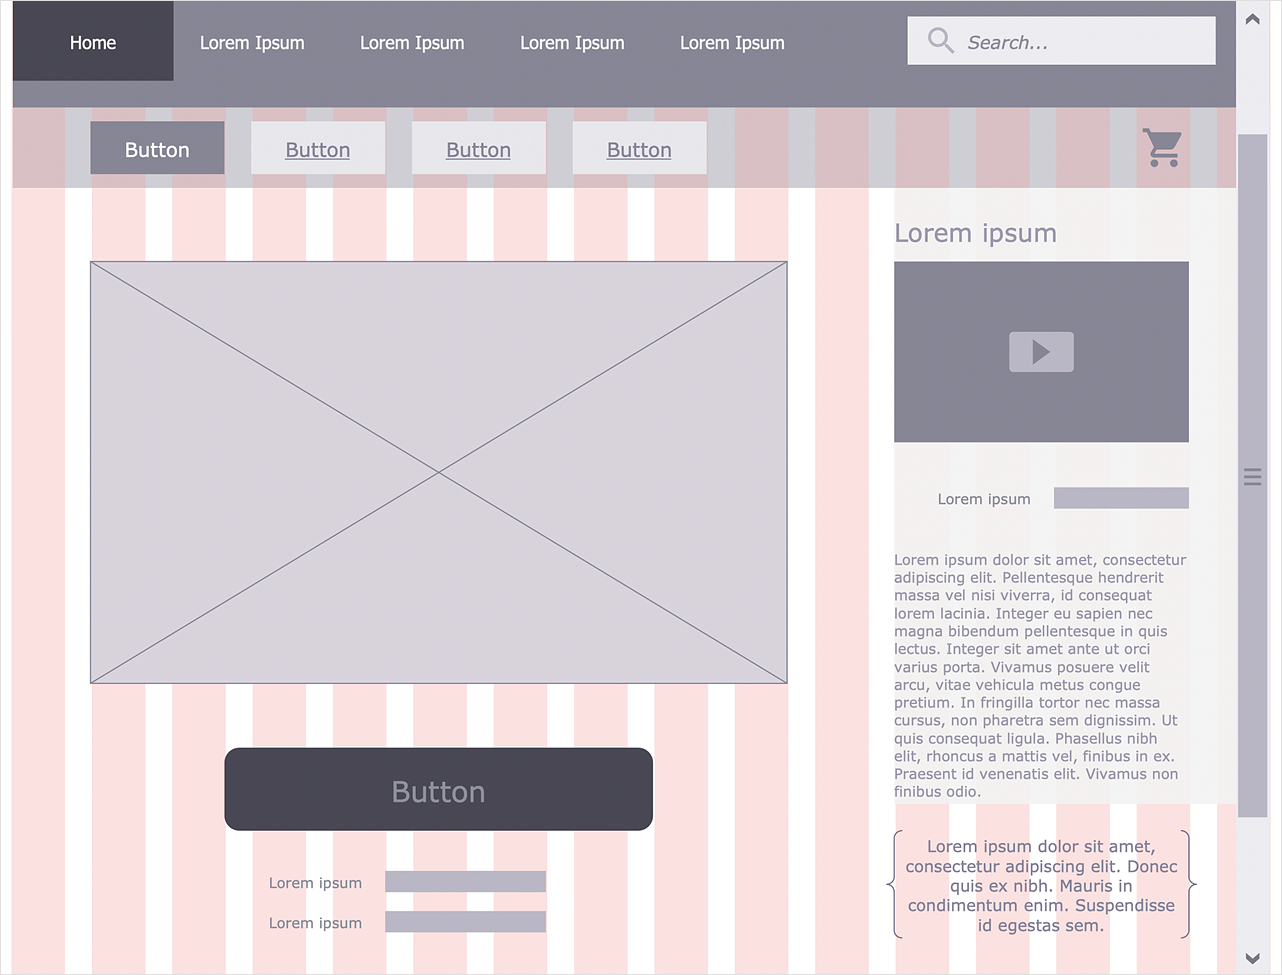
How to Develop Website Wireframes
Website design is a rather complicated process. The development of a website wireframe is an important step in any screen design process. The first step of this process before coding can start, a web designer creates a website wireframe — a mock-up for what will be displayed on the screen when navigating through the web site pages. A wireframe design always includes three components: Information design, navigation design, and interface design. The configuration of these components depends on the business model of the website. The Website Wireframing tools provided with ConceptDraw Website Wireframe solution helps to define the information hierarchy of website design, making it easier for web-developers to plan the layout according to how a site visitor has to process the information.Social Media Response Management DFD Charts - software tools
ConceptDraw is your tool for driving social integration and managing change across and streamline social media processes of your organisation.This tool keeps the entire team on the same page allowing you to realize your social media strategy, improve the quality of your answers, and minimize the time it takes to respond.
HelpDesk
How to Change the Startup Page in ConceptDraw DIAGRAM
There are several tips for the ConceptDraw DIAGRAM startup page. This article describes how to set your desired start page.The Means to Respond to Social Media Mentions
Which trends are on the horizont of social media? What’s we have to prepare for? Look into the future with ConceptDraw products.HelpDesk
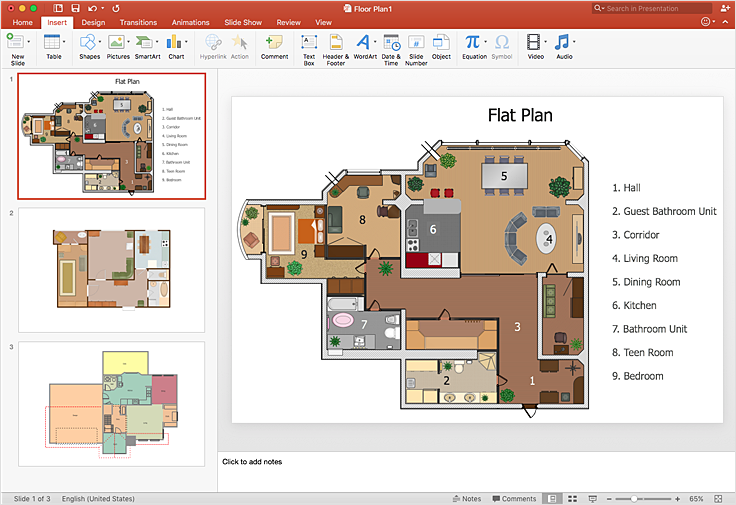
How To Make a PowerPoint Presentation of a Floor Plan
You can use ConceptDraw DIAGRAM to perform amazing PowerPoint presentation of the floor plan that includes the sizes, corners, squares, and other important technical and design details.HelpDesk
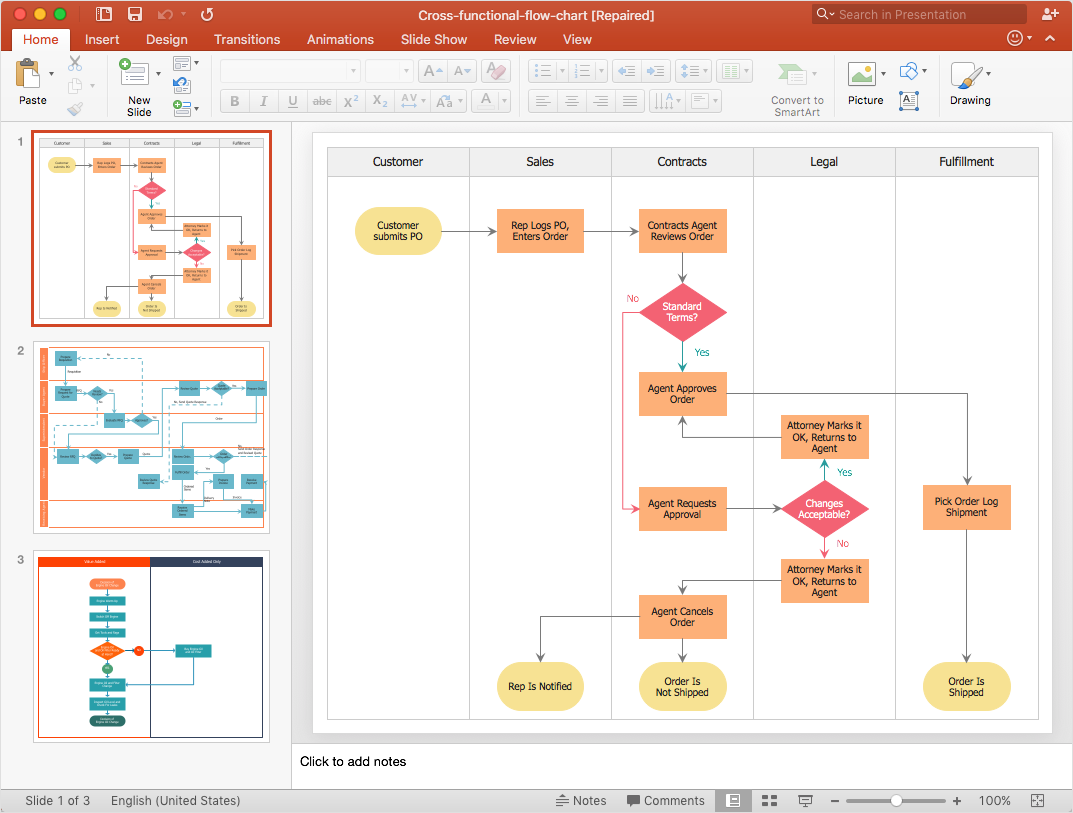
How to Add a Cross-Functional Flowchart to a PowerPoint Presentation
Using a Cross-Functional flowchart is a clear way of showing how business processes get shared or transferred between different teams and departments. ConceptDraw DIAGRAM allows you to make an MS PowerPoint Presentation from your flowcharts in a few simple steps.HelpDesk
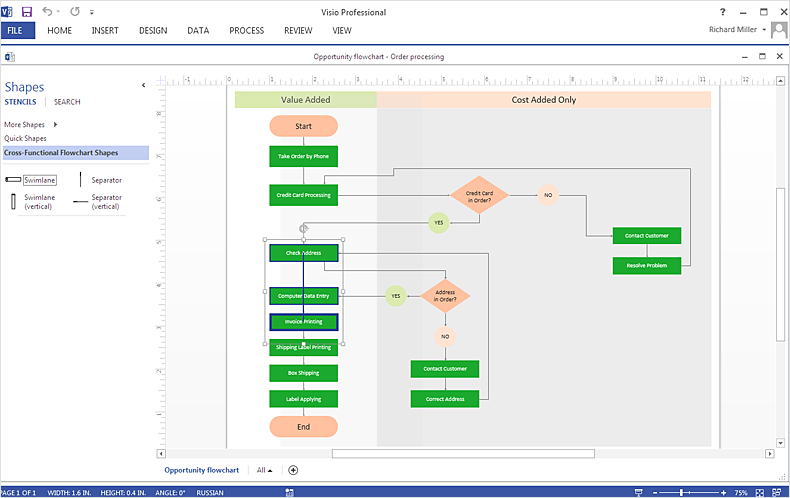
How To Create MS Visio Cross-Functional Flowchart
Cross-functional is a process involving several functional layers. Such processes typically cause the most problems, and therefore, is the most potential for improvement. Cross-functional business processes usually illustrate the processes of product development, commercial proposal development, the order execution process - everything, that involves several departments. The package of possible improvements - is the task of re-engineering. To illustrate the cross-functional processes often use cross-functional flowchart is often used to illustrate the cross-functional processes. ConceptDraw DIAGRAM allows you to easily create a cross-functional flowchart. Then, you can export it to MS Visio VSDX or VDX format and successfully share it with your colleagues still using MS Visio.HelpDesk
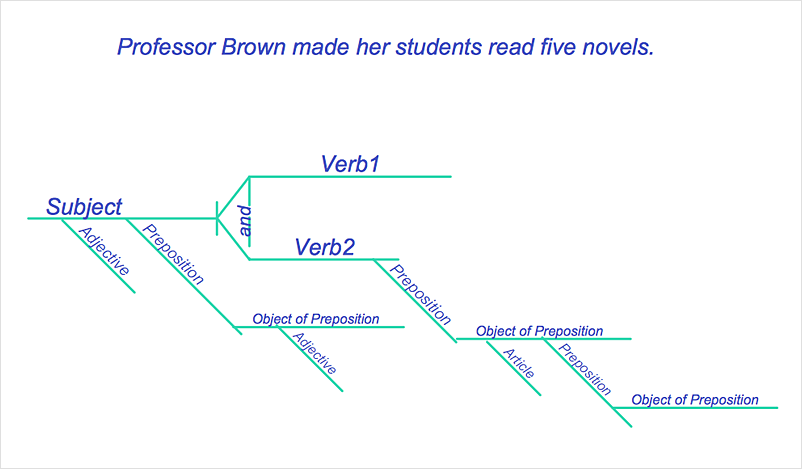
How to Diagram Sentences
Diagramming sentences is a playful, fun way to learning English Grammer. Sentences can be very complex, and can contain many different parts of speech which implicate many different grammatical rules. Diagramming sentences will help you to make sure every parts of your sentence are grammatically correct, and provides you with more comprehensive understanding of the English Language. A Sentence Diagram displays the parts of a sentence as a diagram in order to show the relationship of words and groups of words within the sentence. Sentence Diagram shows the relationship between the proposal of its parts. This is a good way to teach grammar! Sentence Diagram helps to make the writing more coherent as well as more interesting to read. ConceptDraw DIAGRAM allows you to create clear sentence diagrams using the special templates and vector stencils library.Social Media Response DFD Flowcharts - diagramming software ( Mac PC )
Diagramming software for Mac and PC - create flowcharts and presentations for Social Media Organizing.
HelpDesk
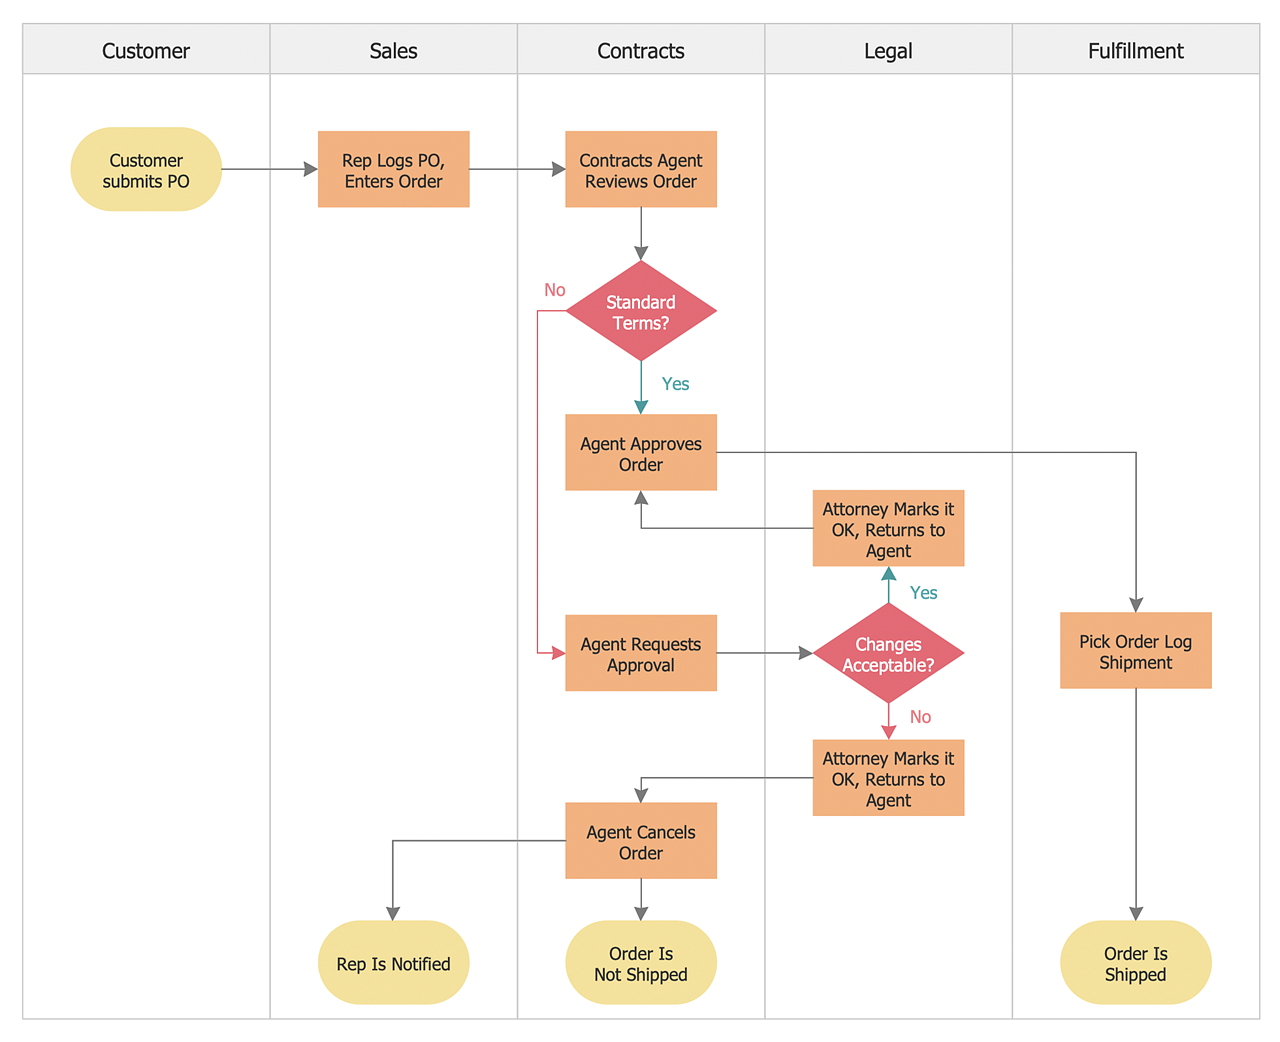
How to Create a Cross-Functional Flowchart
Cross-functional flowcharts are used to visualize cross-functional processes. A cross-functional process is a process that involves multiple divisions, each of which makes its part of the entire company workflow. For example product development, lead management, client orders processing – and other critical processes. All of them are important both for business and customers, but the workflow and responsibilities distribution within these processes are divided between multiple departments and services. Cross-functional processes cannot be depicted with simple workflow diagrams, because of the specific interactions between company departments. ConceptDraw DIAGRAM has released a specialized solution to create cross-functional diagrams. Cross-Functional Flowcharts solution includes a special set of templates and libraries to depict the cross-functional processes.- How to Create a Social Media DFD Flowchart | Business Diagram ...
- How to Create a Social Media DFD Flowchart | Social Media ...
- Activity Diagram For Social Media Site
- Social Media Response | How to Create a Social Media DFD ...
- Flowchart Marketing Process. Flowchart Examples | Flowchart ...
- Social Media Response | How to Create a Social Media DFD ...
- UML Class Diagram Example - Social Networking Site | UML Use ...
- Social Media Response DFD Flowcharts - diagramming software
- Online store social media response flowchart | Cross-Functional ...
- UML Use Case Diagram Example Social Networking Sites Project ...
- How to Create a Social Media DFD Flowchart
- Gantt Chart For Social Networking Site
- Bank social media response flowchart | ConceptDraw PRO: Able to ...
- UML Use Case Diagram Example Social Networking Sites Project ...
- Social strategy - Pyramid diagram | Online store social media ...
- UML Use Case Diagram Example Social Networking Sites Project ...
- UML Class Diagram Example - Social Networking Site | UML Use ...
- Social Media Response Plan Example
- Social Media Response
- Website Flowchart Example


