Pyramid Chart Examples
Pyramid Charts and Triangle Diagrams are used to visually structure the topics and progressively order the quantitative data. They allow to illustrate hierarchical structure of the topics, proportional, interconnected and containment relations among the topics. The multilevel Pyramids and Triangle diagrams are constructed oriented up or down and divided into several horizontal slices. They are effectively used to represent marketing strategies, social strategies, information systems, market value, etc., to illustrate presentations, websites, documents, reports in business, finances, sales, management, marketing, media, training, consulting, and many other fields. To maximize the efficiency in drawing the Pyramid Charts, use the ConceptDraw DIAGRAM diagramming and vector drawing software extended with Pyramid Diagrams solution from Marketing area, which contains the set of Pyramid Chart examples, samples, templates and vector design elements of triangular diagrams and pyramids with different quantity of levels for various needs.Diagram of a Pyramid
Pyramid diagram is a convenient way of representing data hierarchical structure and visualization relationships between hierarchy levels. You need create the diagram of a pyramid? ConceptDraw diagramming and vector drawing software supplied with Pyramid Diagrams Solution from the Marketing Area of ConceptDraw Solution Park is the best tool for drawing attractive and successful diagram of a pyramid.
 Target and Circular Diagrams
This solution extends ConceptDraw DIAGRAM software with samples, templates and library of design elements for drawing the Target and Circular Diagrams.
Bar Diagrams for Problem Solving. Create event management bar charts with Bar Graphs Solution
Create bar charts for event management problem solving and visual data comparison using the ConceptDraw DIAGRAM diagramming and vector drawing software extended with the Bar Graphs Solution from the Graphs and Charts area of ConceptDraw Solition Park.Energy Pyramid Diagram
Energy Pyramid Diagram is a visual graphical representation of the biomass productivity on the each trophic level in a given ecosystem. Its designing in ConceptDraw DIAGRAM will not take much time thanks to the unique Pyramid Diagrams solution from the Marketing area of ConceptDraw Solution Park. Energy Pyramid Diagram begins from the producers (plants) and proceeds through a few trophic levels of consumers (herbivores which eat these plants, the carnivores which eat these herbivores, then carnivores which eat those carnivores, and so on) to the top of the food chain.
 Pyramid Diagrams
Pyramid Diagrams solution extends ConceptDraw DIAGRAM software with templates, samples and library of vector stencils for drawing the marketing pyramid diagrams.
Geo Map - Africa - Madagascar
Madagascar, officially the Republic of Madagascar, is an island country in the Indian Ocean, off the coast of Southeast Africa. The vector stencils library Madagascar contains contours for ConceptDraw DIAGRAM diagramming and vector drawing software. This library is contained in the Continent Maps solution from Maps area of ConceptDraw Solution Park.Geo Map - South America - Nicaragua
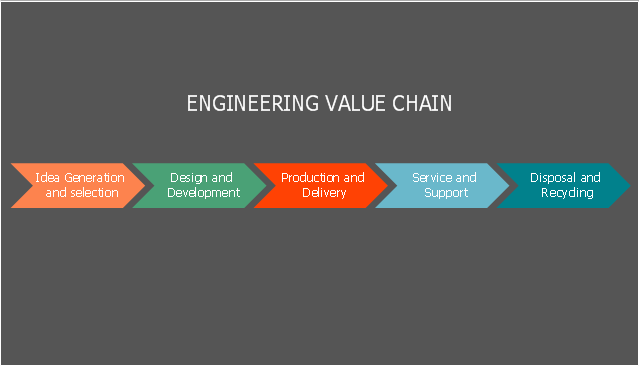
Nicaragua, officially the Republic of Nicaragua, is the largest country in the Central American isthmus, bordering Honduras to the north and Costa Rica to the south. The vector stencils library Nicaragua contains contours for ConceptDraw DIAGRAM diagramming and vector drawing software. This library is contained in the Continent Maps solution from Maps area of ConceptDraw Solution Park.This step chart sample shows engineering value chain. It was designed on the base of the Wikimedia Commons file: The engineering value chain.png. "The engineering value chain (EVC) refers to a series of engineering activities and capabilities contributing to value creation encompassing essential elements such as idea generation & selection, design & development, production & delivery, service & support, and disposal & recycling for example." [commons.wikimedia.org/ wiki/ File:The_ engineering_ value_ chain.png]
This file is licensed under the Creative Commons Attribution-Share Alike 3.0 Unported license. [creativecommons.org/ licenses/ by-sa/ 3.0/ deed.en]
The diagram example "Step chart - Value chain" was created using the ConceptDraw PRO diagramming and vector drawing software extended with the Marketing Diagrams solution from the Marketing area of ConceptDraw Solution Park.
- Food security assessment - Flowchart | Weather - Vector stencils ...
- Service-goods continuum diagram | Pyramid Chart Examples ...
- Social media activity of a real estate agent | Work Order Process ...
- Event-driven Process Chain (EPC) Diagram Software | Forces ...
- Draw Flowcharts with ConceptDraw | Use the Best FlowChart Tool ...
- Ecosystem Easy Diagrams
- How To Create Restaurant Floor Plan in Minutes | Basic Flowchart ...
- Venn Diagram | Pyramid Chart Examples | Ecosystem goods and ...
- LLNL Flow Charts | USA Maps | Forces shaping the broadband ...
- Pyramid Chart Examples | Service-goods continuum diagram ...
- Pyramid Diagram | Flowchart design. Flowchart symbols, shapes ...
- Ecosystem goods and services - Segmented pyramid diagram ...
- Ecosystem goods and services - Segmented pyramid diagram ...
- Pyramid Chart Examples | Pyramid Diagram and Pyramid Chart ...
- Sustainable development - Venn diagram | Venn diagram - Path to ...
- Diagram of a Pyramid | Process Flowchart | Service-goods ...
- Water cycle diagram | Drawing a Nature Scene | Drawing Illustration ...
- Service-goods continuum diagram | Ecosystem goods and services ...
- Process Flowchart | A Pyramid Diagram Indicating The Levels Of ...
- Service-goods continuum diagram | Ecosystem goods and services ...


