Process Flowchart
The main reason of using Process Flowchart or PFD is to show relations between major parts of the system. Process Flowcharts are used in process engineering and chemical industry where there is a requirement of depicting relationships between major components only and not include minor parts. Process Flowcharts for single unit or multiple units differ in their structure and implementation. ConceptDraw PRO is Professional business process mapping software for making Process flowcharts, Process flow diagram, Workflow diagram, flowcharts and technical illustrations for business documents and also comprehensive visio for mac application. Easier define and document basic work and data flows, financial, production and quality management processes to increase efficiency of your business with ConcepDraw PRO. Business process mapping software with Flowchart Maker ConceptDraw PRO includes extensive drawing tools, rich examples and templates, process flowchart symbols and shape libraries, smart connectors that allow you create the flowcharts of complex processes, process flow diagrams, procedures and information exchange. Process Flowchart Solution is project management workflow tools which is part ConceptDraw Project marketing project management software. Drawing charts, diagrams, and network layouts has long been the monopoly of Microsoft Visio, making Mac users to struggle when needing such visio alternative like visio for mac, it requires only to view features, make a minor edit to, or print a diagram or chart. Thankfully to MS Visio alternative like ConceptDraw PRO software, this is cross-platform charting and business process management tool, now visio alternative for making sort of visio diagram is not a problem anymore however many people still name it business process visio tools.
HelpDesk
How to Draw a Chemical Process Flow Diagram
Process Flow Diagram widely used in modeling of processes in the chemical industry. A Chemical Process Flow diagram (PFD) is a specialized type of flowchart. With the help of Chemical Process Flow Diagram engineers can easily specify the general scheme of the processes and chemical plant equipment. Chemical Process Flow Diagram displays the real scheme of the chemical process, the relationship between the equipment and the technical characteristics of the process. Chemical Process Flow Diagram illustrates the connections between the basic equipment as well as the overall structure of pipelines and other supporting equipment. The purpose of the PFD is to build the image of the basic idea of the chemical process. ConceptDraw PRO together with its Chemical and Process Engineering solution delivers the possibility to design Chemical Process Flow diagrams. It is designed for chemical industry engineers and designers.HelpDesk
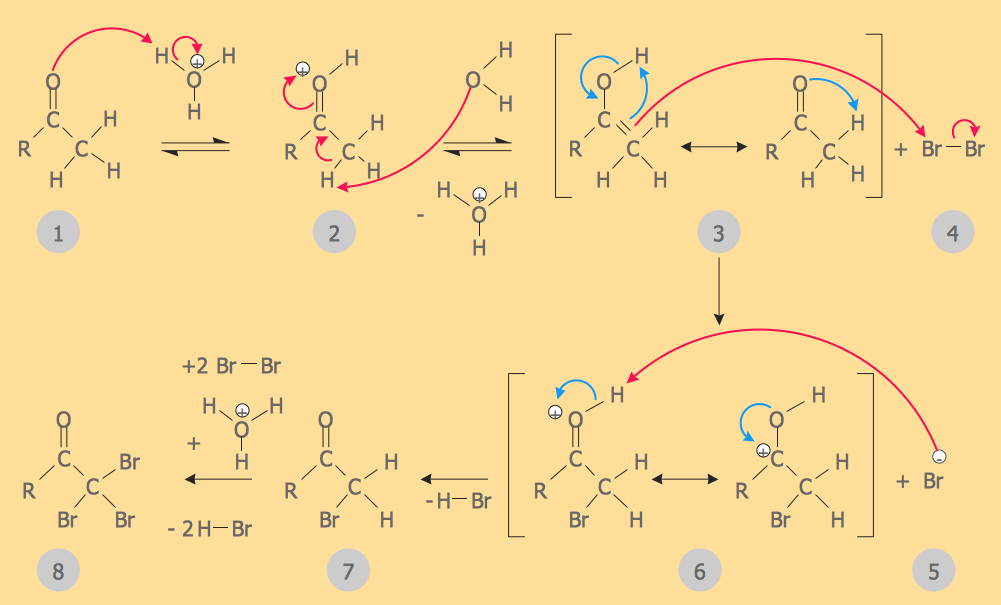
How to Draw Chemistry Structures
Making chemistry drawings for science and education purposes involves many different elements that can be managed using ConceptDraw PRO. ConceptDraw Chemistry solution can be used as a tool for creating chemical schemes and diagrams of chemical lab set-ups and labware, formulas, reaction schemes, and molecular structures. With ConceptDraw PRO you can easily create and communicate chemistry drawings of any complexity.
 Flowcharts
The Flowcharts solution for ConceptDraw PRO is a comprehensive set of examples and samples in several varied color themes for professionals that need to represent graphically a process. Solution value is added by the basic flow chart template and shapes' libraries of flowchart notation. ConceptDraw PRO flow chart creator lets one depict the processes of any complexity and length, as well as design the Flowchart either vertically or horizontally.
 HR Flowcharts
Human resource management diagrams show recruitment models, the hiring process and human resource development of human resources.
 Audit Flowcharts
Audit flowcharts solution extends ConceptDraw PRO software with templates, samples and library of vector stencils for drawing the audit and fiscal flow charts.
HelpDesk
How to Draw a Process Flow Diagram in ConceptDraw PRO
Process Flow diagrams are used in chemical and process engineering to show the flow of chemicals and the equipment involved in the process. When it comes to creating a process flow diagram, it's important to use software that is capable of describing a wide range of processes, using techniques and graphical notation that are easily recognized by engineering workers. An ideal drawing platform will utilize functions that can cope with the output of a high volume of engineering processes, that may change rapidly from development to implementation stages. ConceptDraw PRO, with the extended functionality of the Chemical and Process Engineering Diagrams solution, is the ideal medium for creating designs of this type. The Chemical and Process Engineering Diagrams solution complements this feature with a library of selected icons to represent various steps — all instantly recognizable and applicable to a wide user base. ConceptDraw PRO allows you to draw the Process Flow diagram easily using the set of special libraries.HelpDesk
How to Draw a Circular Arrows Diagram Using ConceptDraw PRO
The cyclic recurrence is a fundamental property of multiple systems. The cycle is a process which consists from elements (phases, stages, stages) following each other. Many processes in astronomy, biology, chemistry, physics, mathematics, etc. have a cycle properties. It is also widely used in information technologies and marketing analysis. Graphical representation of cyclic processes can have many forms. It can be a circle, parabola, hyperbola, ellipse and others. A Circular Arrows Diagram is used as one of the statistical charts in the business, mass media and marketing. ConceptDraw PRO provides its users tools for making easy drawing Circular Arrows Diagrams.
 ConceptDraw Solution Park
ConceptDraw Solution Park collects graphic extensions, examples and learning materials
 Accounting Flowcharts
Accounting Flowcharts solution extends ConceptDraw PRO software with templates, samples and library of vector stencils for drawing the accounting flow charts.
HelpDesk
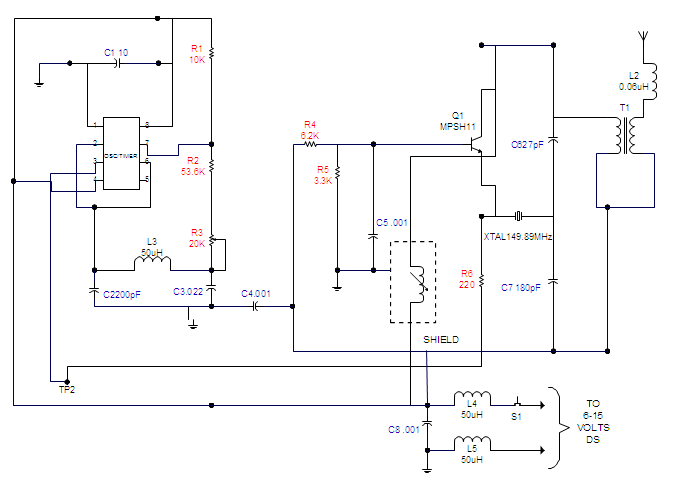
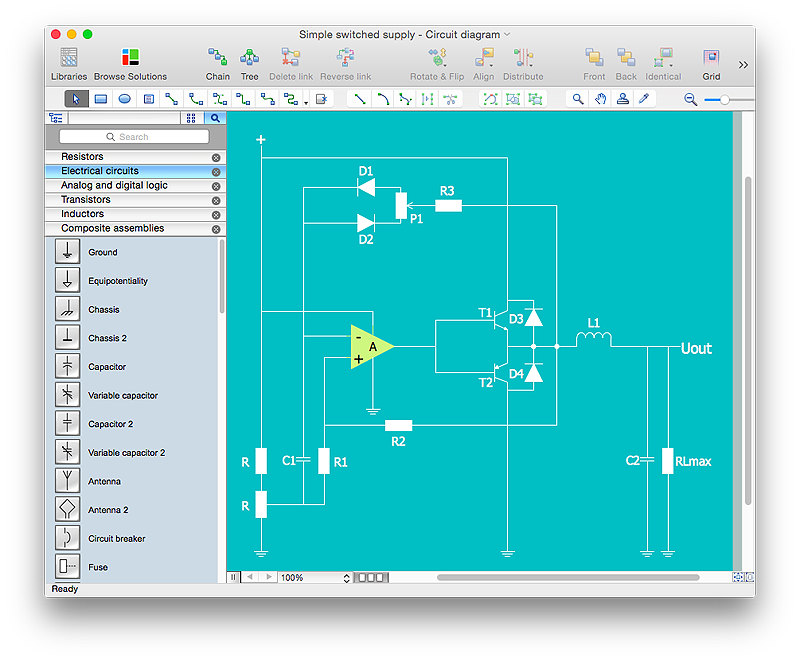
How to Create an Electrical Diagram Using ConceptDraw PRO
There are many of different electric circuit symbols that can be used in a circuit diagram. Knowing how to read circuit diagrams is a useful skill not only for professionals, but for any person who can start creating his own small home electronic projects. The circuit diagram shows the scheme of a location of components and connections of the electrical circuit using a set of standard symbols. It can be use for graphical documentation of an electrical circuit components. The ability to create electrical diagrams and schematic using ConceptDraw PRO is delivered by the Electrical Engineering solution. The solution supplied with samples, templates and libraries of design elements for drawing electrical schematics, digital and analog logic, circuit and wiring schematics and diagrams, power systems diagrams, maintenance and repair diagrams for electronics and electrical engineering.Process Flow Chart
A Process Flow Chart is a type of flowchart which is mostly used in industrial, chemical and process engineering for illustrating high-level processes, major plant processes and not shows minor details. ConceptDraw PRO diagramming and vector drawing software extended with Flowcharts Solution from the "Diagrams" Area of ConceptDraw Solution Park is the best way to create Process Flow Chart and other types of flowcharts.HelpDesk
How to Draw an Electrical Scheme Using ConceptDraw Solution Park
The ability to visualize industrial systems in electronics, electrical, chemical, process, and mechanical engineering is delivered by the ConceptDraw Engineering solution.- Scientific Symbols Chart | Basic Flowchart Symbols and Meaning ...
- Basic Flowchart Symbols and Meaning | Process Flowchart | Flow ...
- Basic Flowchart Symbols and Meaning | Process Flowchart | Design ...
- Basic Flowchart Symbols and Meaning | Process Flowchart | How to ...
- Basic Flowchart Symbols and Meaning
- Sales Flowcharts | Chemistry | Winter Sports | Draw 20 Flowchart ...
- Basic Flowchart Symbols and Meaning | Chemistry Drawings ...
- Basic Flowchart Symbols and Meaning | How to Draw Chemistry ...
- Basic Flowchart Symbols and Meaning | Process Flowchart ...
- Basic Flowchart Symbols and Meaning | Process Flowchart | Entity ...
- Design elements - Chemical engineering | Piping and ...
- Basic Flowchart Symbols and Meaning
- Process Flowchart | Basic Flowchart Symbols and Meaning | How to ...
- Process Flowchart | Process flow diagram (PFD) template | Cross ...
- Basic Flowchart Symbols and Meaning | Process Flowchart ...
- Basic Flowchart Symbols and Meaning | Entity Relationship ...
- Basic Flowchart Symbols and Meaning | Entity Relationship ...
- Flowcharts | Cross-Functional Flowcharts | Chemistry | State 20 ...
- Process Flowchart | Basic Flowchart Symbols and Meaning | How to ...
- Basic Flowchart Symbols and Meaning | Flowchart design ...


