HelpDesk
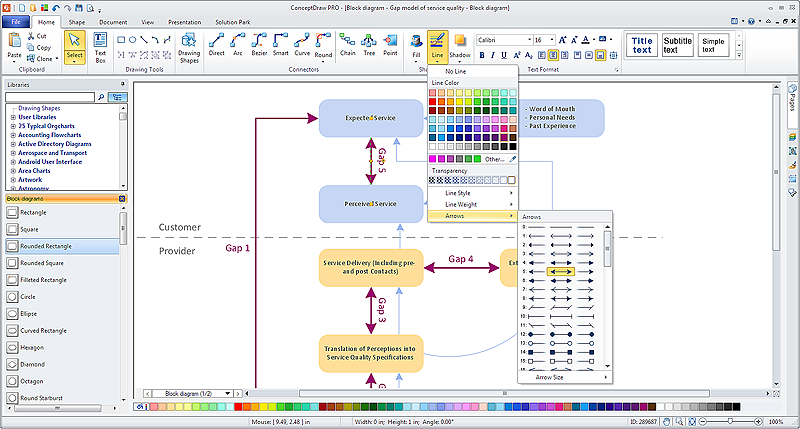
How to Connect Objects in ConceptDraw PRO on PC
ConceptDraw PRO provides a few options for drawing connections between objects: Direct Connectors, Smart, Arc, Bezier, Curve and Round Connectors. You can connect objects in your ConceptDraw diagram with proper connectors using the embedded automatic connection modes. This article describes how you can connect objects with connectors and how you can ascribe different types and behaviors.
 ConceptDraw Solution Park
ConceptDraw Solution Park collects graphic extensions, examples and learning materials
HelpDesk
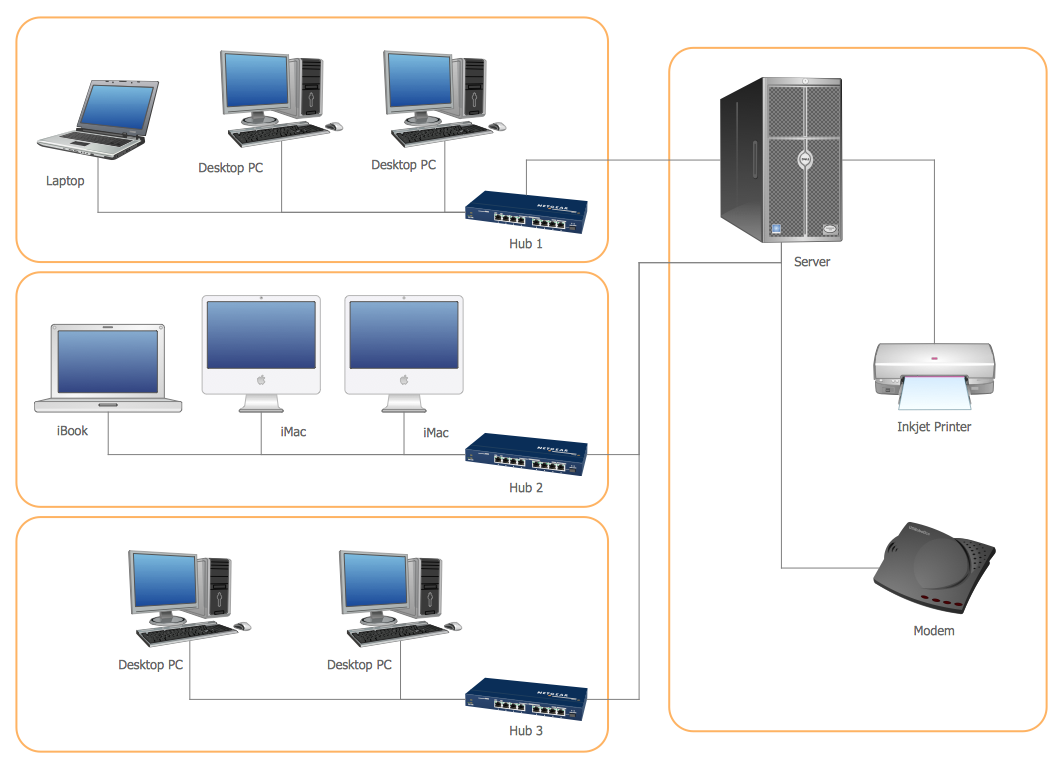
How to Make Network Diagram
ConceptDraw PRO allows you to represent and communicate network architecture, topology, and design to engineers, stakeholders and end-users.HelpDesk
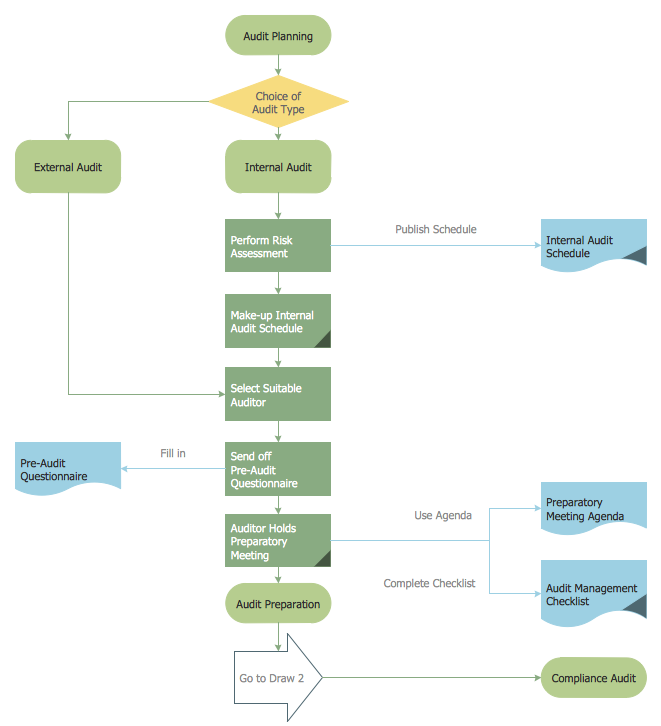
How to Create an Audit Flowchart Using ConceptDraw PRO
Audit flowcharts are often used in auditors activity. This is the most effective way of preparation and documentation of the audit process. Financial audit process has a clear structure, and therefore audit flowchart is often used to denote an audit process. This is the most effective way of preparation and documentation of the audit process. Flowcharts are often used in auditors activity. A flowchart may be created at any stage of an audit process as an aid in the determination and evaluation of a client's accounting system. ConceptDraw PRO allows you to create professional accounting flowchart quickly using the professional Audit Flowcharts solution.HelpDesk
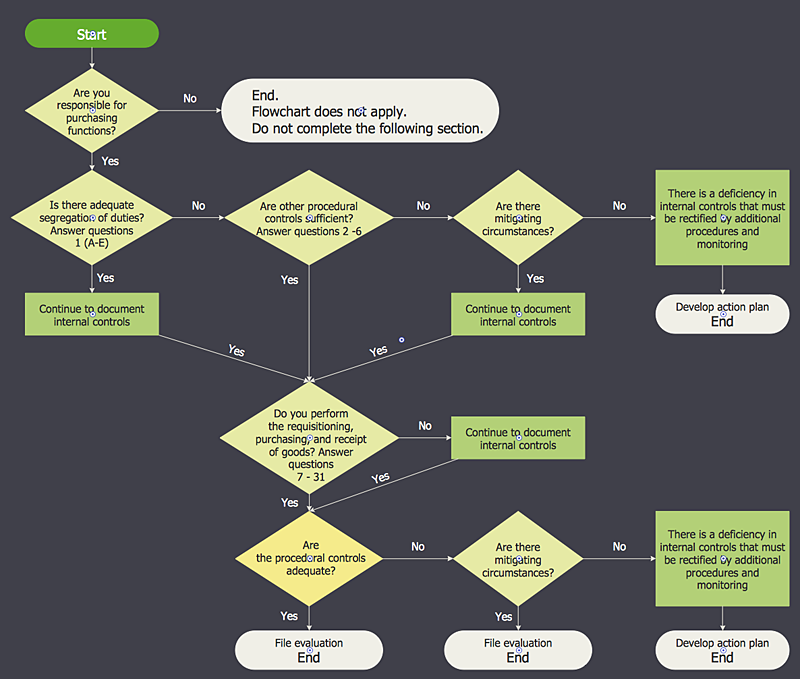
How to Create an Accounting Flowchart Using ConceptDraw Solution Park
An Accounting flowchart is a specialized type of flowchart. With the help of an accounting flowchart you can visually describe tasks, documents, people responsible for execution at each stage of accounting workflow. Find out how you can easily create an accounting flowchart of any complexity using Accounting Flowchart Solution from the ConceptDraw Solution Park.HelpDesk
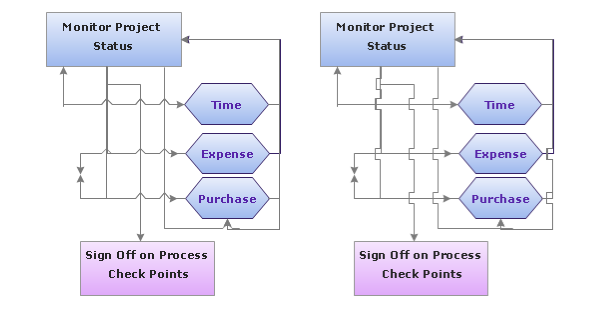
How to Set Line Jumps for Smart Connectors in ConceptDraw PRO
Connecting objects in ConceptDraw PRO is an easy task. You can use Chain, or Tree connection mode for automatic connection of multiple objects. Besides the automatic connection modes, ConceptDraw PRO offers few options to connect objects manually: Direct, Arc, Bezier, Smart, Curve and Round Connectors. You can make them square, arched or angled and also set vertical or horizontal orientation Thus, you can control how the jumps and orientation occurs on smart connectors. When two smart connectors cross each other you can control how the two intersecting lines look.HelpDesk
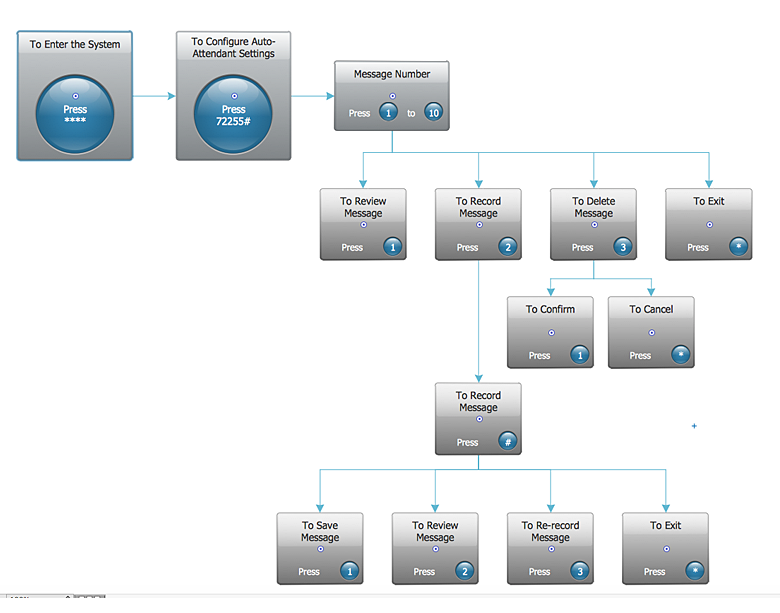
How to Create an Interactive Voice Response (IVR) Diagram in ConceptDraw PRO
Interactive Voice Response (IVR) Diagram is used to create and conduct the Interactive Voice Response systems for call-centers and voice mail services. IVR diagrams intended to visualize the logical and physical structure of Interactive voice response systems. ConceptDraw solution for Interactive Voice Response (IVR) Diagram allows you to create and communicate the Interactive Voice Response diagram of any complexity. Interactive Voice Response (IVR) System is a telecommunication technology that enables a computer to automatically process voice and touch phone signals. IVR systems allows users to interact through a computer with various service systems, available by telephone. The objective of IVR system is to reduce customer service costs by delivering self service to customers and guiding them to the information that they look for.HelpDesk
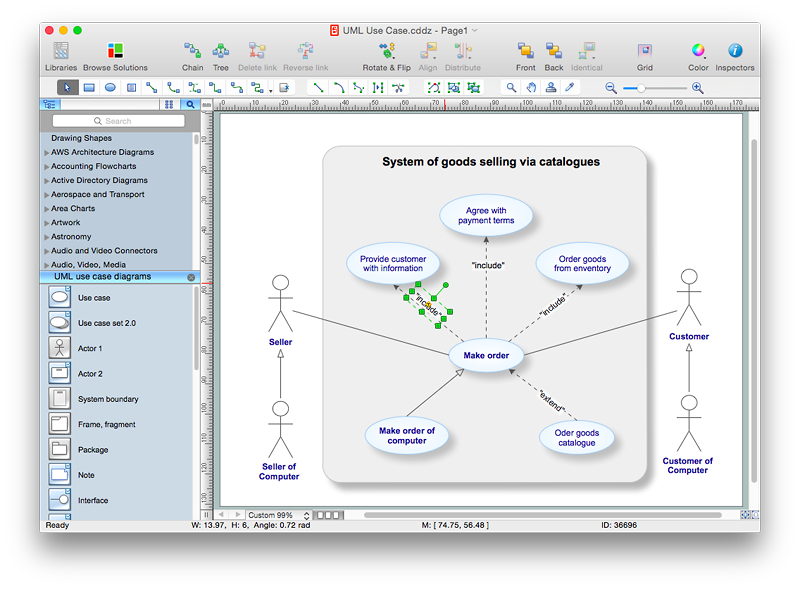
How to Add Text to a Connector in ConceptDraw PRO
The new ConceptDraw Arrows10 Technology is a powerful diagramming technique that powered the way business drawing created. ConceptDraw PRO gives you some tools for connecting shapes: Direct Connectors, Smart, Arc, Bezier, Curve and Round Connectors.Direct Connectors are direct lines from the point to the point. Smart , Arc, Bezier, Curve and Round Connectors are almost the same as Direct Connectors. However, they automatically move around other objects. You can use Chain, or Tree connection mode for connection of multiple objects with any type of connectors. ConceptDraw PRO allows you to add and move text on a connector the same way that you add and move text on other any object.
 Flowcharts
The Flowcharts Solution for ConceptDraw PRO v10 is a comprehensive set of examples and samples in several different color themes for professionals that need to graphically represent a process. Solution value is added by basic flow chart template and shapes' library of Flowchart notation. ConceptDraw PRO flow chart creator lets one depict a processes of any complexity and length, as well design of the flowchart either vertically or horizontally.
HelpDesk
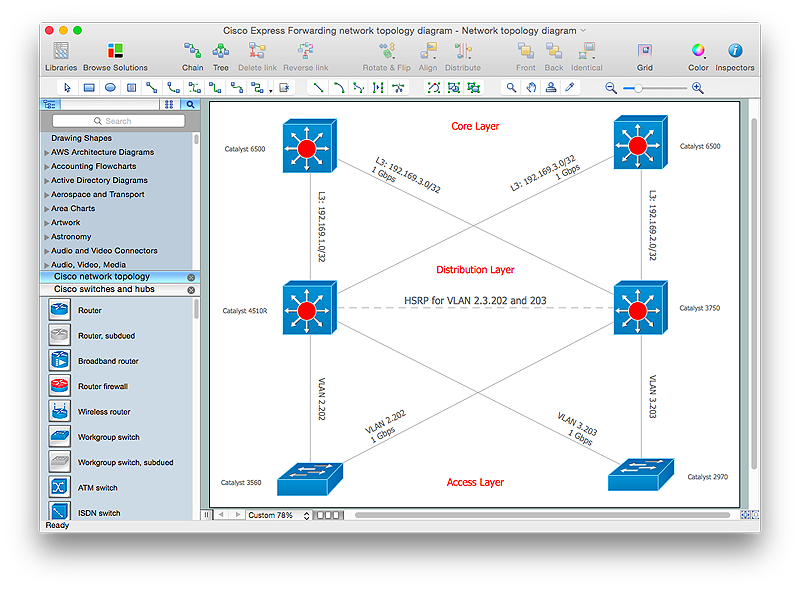
How to Create Cisco Network Diagrams
The easiest way to design Cisco Network diagram using standard Cisco product symbols is using ConceptDraw PRO powered by Cisco Network Diagrams solution. The Cisco Network Diagrams solution uses Cisco network symbols to to visually document the topology and design of Cisco networks.- Basic Flowchart Symbols and Meaning | Process Flowchart ...
- Basic Flowchart Symbols and Meaning | Audio and Video ...
- Basic Flow Chart In Computer With Connector
- Basic Flowchart Symbols and Meaning | Process Flowchart | Cross ...
- Computer Network Diagrams | Audio and Video Connectors | DVI ...
- Basic Flowchart Symbols and Meaning | Process Flowchart ...
- Can Flowchart Connectors Cross
- Draw A Computer Connection Flow Diagram
- Basic Flowchart Symbols and Meaning | Design elements ...
- Basic Flowchart Symbols and Meaning | Local area network (LAN ...
- Basic Flowchart Symbols and Meaning | Cross-Functional Flowchart ...
- Audio and Video Connectors | Process Flowchart | Computer ...
- Process Flowchart | Draw A Computer Connection Flow Diagram ...
- Process Flowchart | Basic Flowchart Symbols and Meaning | Types ...
- Data Flow Diagram Symbols . DFD Library | Entity Relationship ...
- Basic Flowchart Symbols and Meaning | Process Flowchart | Types ...
- Process Flowchart | Basic Flowchart Symbols and Meaning ...
- How to Draw a Computer Network Diagrams | Process Flowchart ...
- Simple Sketch Of A Computer File Structure
