This site uses cookies. By continuing to browse the ConceptDraw site you are agreeing to our Use of Site Cookies.
This business process flowchart example was redesigned from the Wikimedia Commons file: SMGULP-distribution-flowchart.png.
[commons.wikimedia.org/ wiki/ File:SMGULP-distribution-flowchart.png]
"Shri Mahila Griha Udyog Lijjat Papad, popularly known as Lijjat, is an Indian women's cooperative involved in manufacturing of various fast moving consumer goods." [Shri Mahila Griha Udyog Lijjat Papad. Wikipedia]
The business process map example "Distribution flowchart example" was drawn using the ConceptDraw PRO diagramming and business graphics software extended with the Business Process Mapping solution from the Business Processes area of ConceptDraw Solution Park.
Business process map
Business process map, process, step, operation, flow line, arrow, connector,
This cross-functional (deployment) flowchart example was redesigned from the Wikimedia Commons file: Approvals.svg.
[commons.wikimedia.org/ wiki/ File:Approvals.svg]
This file is made available under the Creative Commons CC0 1.0 Universal Public Domain Dedication. [creativecommons.org/ publicdomain/ zero/ 1.0/ deed.en]
"The swim lane flowchart differs from other flowcharts in that processes and decisions are grouped visually by placing them in lanes. Parallel lines divide the chart into lanes, with one lane for each person, group or subprocess. Lanes are labelled to show how the chart is organized." [Swim lane. Wikipedia]
The swimlane diagram example "Business process swim lane flowchart - Approvals" was drawn using the ConceptDraw PRO diagramming and business graphics software extended with the Business Process Mapping solution from the Business Processes area of ConceptDraw Solution Park.
Cross-functional flowchart
Cross-functional flowchart, swim lanes, stop, start, terminator, process, step, operation, flow line, arrow, connector, decision,
HR flowchart "UK Labour Market Categories" was redesigned from the Wikipedia file: UK Labour Market Categories.png.
"Flow chart showing the different categories in the UK labour market such as employed, unemployed and economically inactive." [commons.wikimedia.org/ wiki/ File:UK_ Labour_ Market_ Categories.png]
This file is licensed under the Creative Commons Attribution-Share Alike 3.0 Unported license. [creativecommons.org/ licenses/ by-sa/ 3.0/ ]
"Employment is a relationship between two parties, usually based on a contract, one being the employer and the other being the employee. ...
An employee contributes labor and expertise to an endeavor of an employer and is usually hired to perform specific duties which are packaged into a job. An Employee is a person who is hired to provide services to a company on a regular basis in exchange for compensation and who does not provide these services as part of an independent business. ...
Employer and managerial control within an organization rests at many levels and has important implications for staff and productivity alike, with control forming the fundamental link between desired outcomes and actual processes. Employers must balance interests such as decreasing wage constraints with a maximization of labor productivity in order to achieve a profitable and productive employment relationship." [Employment. Wikipedia]
The HR flow chart example "UK labour market categories" was created using the ConceptDraw PRO diagramming and vector drawing software extended with the HR Flowcharts solution from the Management area of ConceptDraw Solution Park.
HR flowchart
HR flowchart, сareer, time evaluation, start, skill, schedule, calendar, reporter, process step, page, job satisfaction, job descriptions, illness, hiring, recruitment, flow line, arrow, connector, family, dispatcher, profession icon, decision indicator, yes, decision indicator, no, decision, applicant, job applicant,
This flowchart example illustrates the consensus based decision-making.
It was designed on the base of Wikimedia Commons file: Consensus flow chart.svg. [commons.wikimedia.org/ wiki/ File:Consensus_ flow_ chart.svg]
"Consensus decision-making is a group decision-making process in which group members develop, and agree to support a decision in the best interest of the whole. Consensus may be defined professionally as an acceptable resolution, one that can be supported, even if not the "favourite" of each individual. ... Consensus decision-making is thus concerned with the process of deliberating and finalizing a decision, and the social, economic, legal, environmental and political effects of applying this process." [Consensus decision-making. Wikipedia]
This file is licensed under the Creative Commons Attribution-Share Alike 3.0 Unported license. [creativecommons.org/ licenses/ by-sa/ 3.0/ deed.en]
The decision diagram example "Consensus flow chart" was designed using ConceptDraw software extended with Decision Making solution from Management area of ConceptDraw Solution Park.
Decision diagram example
Decision diagram example, to-do list, thumb up, process step, presentation, gears, discussion, closed padlock, check, audit, bomb,
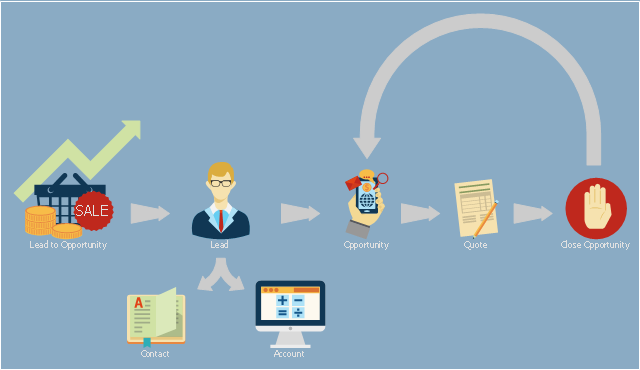
This presales process flowchart example depicts the Microsoft Dynamics CRM workflow from lead to opportunity. It was redesigned from the Wikimedia Commons file: Lead to Opportunity sales flow.svg. [commons.wikimedia.org/ wiki/ File:Lead_ to_ Opportunity_ sales_ flow.svg]
"Presales is a process or a set of activities normally carried out before a customer is acquired, though sometimes presales also extends into the period the product or service is delivered to the customer. ...
In a typical sales cycle the stages are:
(1) Contact.
(2) Lead / Suspect.
(3) Prospect / Opportunity.
The task of a presales person starts from the initial contact phase and often ends once the customer is acquired i.e. sale is made." [Presales. Wikipedia]
The process flowchart example "Lead to opportunity sales flow" was created using the ConceptDraw PRO diagramming and vector drawing software extended with the Sales Flowcharts solution from the Marketing area of ConceptDraw Solution Park.
Presales process flowchart
Presales process flowchart, u shaped arrow, stop, sales, proforma invoice, opportunities, moving up arrow, leads, lead, fat arrow, contacts, arrow fork, accounting software,
This logistic flow chart sample shows a chain of intermodal transport to link fluvio-maritime.
It was designed on the base of the Wikimedia Commons file: Logistique fluvio-maritime.jpg.
[commons.wikimedia.org/ wiki/ File:Logistique_ fluvio-maritime.jpg]
This file is licensed under the Creative Commons Attribution-Share Alike 3.0 Unported license. [creativecommons.org/ licenses/ by-sa/ 3.0/ deed.en]
"Intermodal freight transport involves the transportation of freight in an intermodal container or vehicle, using multiple modes of transportation (rail, ship, and truck), without any handling of the freight itself when changing modes. The method reduces cargo handling, and so improves security, reduces damage and loss, and allows freight to be transported faster. Reduced costs over road trucking is the key benefit for inter-continental use. This may be offset by reduced timings for road transport over shorter distances." [Intermodal freight transport. Wikipedia]
The logistic flowchart example "Intermodal transport chain" was created using ConceptDraw PRO diagramming and vector drawing software extended with the Logistics Flow Charts solution from the Business Processes area of ConceptDraw Solution Park.
Logistic flowchart
Logistic flowchart, shipping, roundrect, ferry, crane, corner arrow,
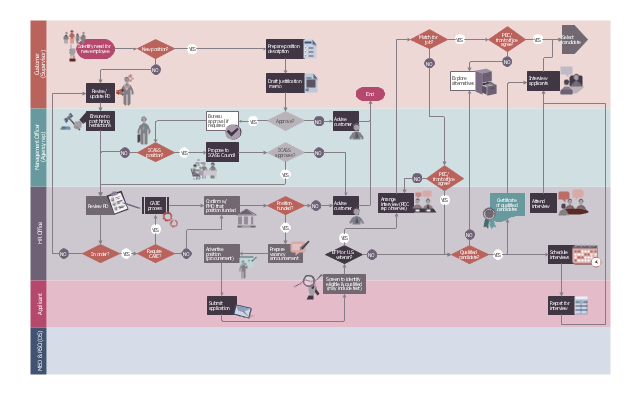
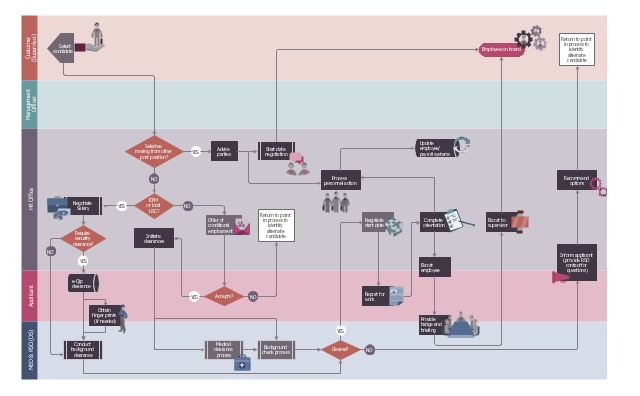
This HR flowchart example was redesigned from the Wikimedia Commons files: File:(5) 2008-07-07 Recruitment pg1.jpg (1st page), File:(5) 2008-07-07 Recruitment pg2.jpg (2nd page).
[commons.wikimedia.org/ wiki/ File:(5)_ 2008-07-07_ Recruitment_ pg1.jpg, commons.wikimedia.org/ wiki/ File:(5)_ 2008-07-07_ Recruitment_ pg2.jpg]
"ROLE OF THE POST EMPLOYMENT COMMITTEE (PEC).
The Post Employment Committee (PEC) ensures the proper application of the US Citizen EFM and US Veterans Hiring Preference is applied." [icass.gov/ home/ Documents/ HR-OE%20 Interagency%20 Docs/ Local%20 Employment%20 Recruitment%20 Policy.pdf]
The cross-functional flowchart example "Post Employment Committee recruitment flowchart" was created using the ConceptDraw PRO diagramming and vector drawing software extended with the HR Flowcharts solution from the Management area of ConceptDraw Solution Park.
Cross-functional flowchart - part 1
Cross-functional flowchart - part 1, terminal point, survey, succession management, subroutine, predefined process, skill, schedule, calendar, run, recruitment, hiring, quality assurance, process step, person specification, off-page reference, meeting, mail room, job performance, job descriptions, interview, job interview, human resource, document, disciplinary procedures, decision indicator, yes, decision indicator, no, decision, checkbox, businessman, profession icon, blog, bank, analyze, accounting,
Cross-functional flowchart - part 2
Cross-functional flowchart - part 2, terminal point, synchronization, sync, survey, subroutine, predefined process, select staff, security, run, resume, receive, process step, problem solving, personnel, staff, employees, off-page reference, negotiation, job pricing, job offer, human resource, health plan, employee onboarding, organizational socialization, direct access storage, decision indicator, yes, decision indicator, no, decision, business conference,
This logistic flow chart sample shows the company's supply chain. It was designed on the base of the Wikimedia Commons file: A company's supply chain (en).png. [commons.wikimedia.org/ wiki/ File:A_ company%27s_ supply_ chain_ (en).png]
This file is licensed under the Creative Commons Attribution-Share Alike 3.0 Unported license. [creativecommons.org/ licenses/ by-sa/ 3.0/ deed.en]
"A supply chain is a system of organizations, people, activities, information, and resources involved in moving a product or service from supplier to customer. Supply chain activities involve the transformation of natural resources, raw materials, and components into a finished product that is delivered to the end customer. In sophisticated supply chain systems, used products may re-enter the supply chain at any point where residual value is recyclable. Supply chains link value chains." [Supply chain. Wikipedia]
The logistic flowchart example "A company's supply chain" was created using ConceptDraw PRO diagramming and vector drawing software extended with the Logistics Flow Charts solution from the Business Processes area of ConceptDraw Solution Park.
Logistic flowchart
Logistic flowchart, users, supplier, roundrect, purchasing, production, distribution, circle, arrow right, arrow left,
This flowchart example shows the lifecycle of an invoice in Microsoft Dynamics CRM. It was redesigned from the Wikimedia Commons file: Invoice lifecycle.svg. [commons.wikimedia.org/ wiki/ File:Invoice_ lifecycle.svg]
"Microsoft Dynamics CRM is a customer relationship management software package developed by Microsoft. Out of the box, the product focuses mainly on Sales, Marketing, and Service (help desk) sectors...
Dynamics CRM is a server-client application, which, like Microsoft SharePoint, is primarily an IIS-based web application which also supports extensive web services interfaces. Clients access Dynamics CRM either by using a Browser or by a thick client plug-in to Microsoft Outlook." [Microsoft Dynamics CRM. Wikipedia]
The process flowchart example "Invoice lifecycle" was created using the ConceptDraw PRO diagramming and vector drawing software extended with the Sales Flowcharts solution from the Marketing area of ConceptDraw Solution Park.
Lifecycle of an invoice in Microsoft Dynamics CRM
Lifecycle of an invoice in Microsoft Dynamics CRM , stop, single headed arrow, right arrow, semicircle arrow, sales orders, run, proforma invoice, products on sale, online order, merging arrows, invoice, information systems, empty shopping cart, direct mail, diagonal arrow, customer, man, man torso, accept,
This flowchart sample was designed on the base of Wikimedia Commons file: EMR process flow.jpg.
"A process flow chart for an emergency medical responder."
[commons.wikimedia.org/ wiki/ File:EMR_ process_ flow.jpg]
The flow chart example "Flowchart - EMR process" was designed using ConceptDraw PRO software extended with Сlassic Business Process Modeling solution from Business Processes area of ConceptDraw Solution Park.
Business process modeling diagram
Business process modeling diagram, start, terminator, process, step, operation, flow line, arrow, connector, entity relationship,
This enterprise architecture diagram sample was redesigned from the Wikipedia file: TEAF Work Products for EA Direction, Description, and Accomplishment.jpg. [en.wikipedia.org/ wiki/ File:TEAF_ Work_ Products_ for_ EA_ Direction,_ Description,_ and_ Accomplishment.jpg]
"Treasury Enterprise Architecture Framework (TEAF) was an Enterprise architecture framework for treasury, based on the Zachman Framework. It was developed by the US Department of the Treasury and published in July 2000. May 2012 this framework has been subsumed by evolving Federal Enterprise Architecture Policy as documented in "The Common Approach to Federal Enterprise Architecture".
The material presented here is obsolete and only useful for historical reference and is not the current policy in use by the Department of the Treasury." [en.wikipedia.org/ wiki/ Treasury_ Enterprise_ Architecture_ Framework]
The enterprise architecture diagram example "Resources and TEAF Work Products for EA Direction, Description, and Accomplishment" was created using the ConceptDraw PRO diagramming and vector drawing software extended with the Enterprise Architecture Diagrams solution from the Management area of ConceptDraw Solution Park.
Enterprise architecture diagram
Enterprise architecture diagram, manager, business intent sector,
"In software engineering, an entity–relationship model (ER model) is a data model for describing a database in an abstract way.Chen's notation for entity–relationship modeling uses rectangles to represent entity sets, and diamonds to represent relationships appropriate for first-class objects: they can have attributes and relationships of their own. If an entity set participates in a relationship set, they are connected with a line.
Attributes are drawn as ovals and are connected with a line to exactly one entity or relationship set." [Entity–relationship model. Wikipedia]
This sample Chen's ER-diagram illustrates the structure of a typical MMORP game.
"Massively multiplayer online role-playing game (MMORPG) mixes the genres of role-playing video games and Massively multiplayer online games, possibly in the form of web browser-based games, in which a very large number of players interact with one another within a virtual world.
As in all RPGs, players assume the role of a character (often in a fantasy world or science-fiction world) and take control over many of that character's actions. MMORPGs are distinguished from single-player or small multi-player online RPGs by the number of players, and by the game's persistent world (usually hosted by the game's publisher), which continues to exist and evolve while the player is offline and away from the game." [Massively multiplayer online role-playing game. Wikipedia]
This ERD example was redrawn using the ConceptDraw PRO diagramming and vector drawing software from the Wikipedia file: ER Diagram MMORPG.png. [en.wikipedia.org/ wiki/ File:ER_ Diagram_ MMORPG.png]
This file is licensed under the Creative Commons Attribution-Share Alike 3.0 Unported license. [creativecommons.org/ licenses/ by-sa/ 3.0/ deed.en]
This Chen's ERD example is included in the Chen Notation solution from the Software Development area of ConceptDraw Solution Park.
ER-diagram
ER-diagram, weak key attribute, weak entity, relationship, recursive relationship, participation, multivalued attribute, key attribute, identifying relationship, entity, derived attribute, attribute,
"The symbols and conventions used in welding documentation are specified in national and international standards such as ISO 2553 Welded, brazed and soldered joints -- Symbolic representation on drawings and ISO 4063 Welding and allied processes -- Nomenclature of processes and reference numbers. The US standard symbols are outlined by the American National Standards Institute and the American Welding Society and are noted as "ANSI/ AWS".
In engineering drawings, each weld is conventionally identified by an arrow which points to the joint to be welded. The arrow is annotated with letters, numbers and symbols which indicate the exact specification of the weld. In complex applications, such as those involving alloys other than mild steel, more information may be called for than can comfortably be indicated using the symbols alone. Annotations are used in these cases." [Symbols and conventions used in welding documentation. Wikipedia]
The example chart "Elements of welding symbol" is redesigned using the ConceptDraw PRO diagramming and vector drawing software from the Wikipedia file: Elements of a welding symbol.PNG.
[en.wikipedia.org/ wiki/ File:Elements_ of_ a_ welding_ symbol.PNG]
The diagram example "Elements location of a welding symbol" is contained in the Mechanical Engineering solution from the Engineering area of ConceptDraw Solution Park.
Welding joint symbol chart
Welding joint symbol chart, field weld, arrow,
This infographic sample visualizes the Conventional and wireless ad hoc network. It was designed on the base of the Wikimedia Commons file: Běžná bezdrátová síť a ad hoc síť.png.
[commons.wikimedia.org/ wiki/ File:B%C4%9B%C5%BEn%C3%A1_ bezdr%C3%A1tov%C3%A1_ s%C3%AD%C5%A5_ a_ ad_ hoc_ s%C3%AD%C5%A5.png]
This file is licensed under the Creative Commons Attribution-Share Alike 4.0 International license. [creativecommons.org/ licenses/ by-sa/ 4.0/ deed.en]
"A wireless ad hoc network (WANET) is a decentralized type of wireless network. The network is ad hoc because it does not rely on a pre existing infrastructure, such as routers in wired networks or access points in managed (infrastructure) wireless networks. Instead, each node participates in routing by forwarding data for other nodes, so the determination of which nodes forward data is made dynamically on the basis of network connectivity. In addition to the classic routing, ad hoc networks can use flooding for forwarding data.
Wireless mobile ad hoc networks are self-configuring, dynamic networks in which nodes are free to move. Wireless networks lack the complexities of infrastructure setup and administration, enabling devices to create and join networks "on the fly" – anywhere, anytime." [Wireless ad hoc network. Wikipedia]
The infographic example "Conventional and wireless ad hoc network" was created using the ConceptDraw PRO diagramming and vector drawing software extended with the Computers and Communications solution from the Illustration area of ConceptDraw Solution Park.
Network infographic
Network infographic, walkie talkie, printer, communication tower, signal tower, wifi antenna, active pc, select computer,
This PFD sample was redesigned from the Wikipedia file: NaturalGasCondensate.png.
"This is a schematic flow diagram of a typical facility for separating and recovering liquid condensate from raw natural gas."
[en.wikipedia.org/ wiki/ File:NaturalGasCondensate.png]
"Natural-gas condensate is a low-density mixture of hydrocarbon liquids that are present as gaseous components in the raw natural gas produced from many natural gas fields. It condenses out of the raw gas if the temperature is reduced to below the hydrocarbon dew point temperature of the raw gas.
The natural gas condensate is also referred to as simply condensate, or gas condensate, or sometimes natural gasoline because it contains hydrocarbons within the gasoline boiling range. Raw natural gas may come from any one of three types of gas wells:
(1) Crude oil wells - Raw natural gas that comes from crude oil wells is called associated gas. This gas can exist separate from the crude oil in the underground formation, or dissolved in the crude oil.
(2) Dry gas wells - These wells typically produce only raw natural gas that does not contain any hydrocarbon liquids. Such gas is called non-associated gas.
(3) Condensate wells - These wells produce raw natural gas along with natural gas liquid. Such gas is also non-associated gas and often referred to as wet gas." [Natural-gas condensate. Wikipedia]
The process flow diagram example "Natural gas condensate - PFD" was drawn using the ConceptDraw PRO software extended with the Chemical and Process Engineering solution from the Chemical and Process Engineering area of ConceptDraw Solution Park.
Process flow diagram (PFD)
Process flow diagram (PFD), vapor, horizontal, jacketed vessel, vaporizing equipment, reducer, off-sheet, pipelines, heater, cooler, diaphragm valve,
This purchase order processing UML activity diagram was created on the base of activity diagram from the software architecture documentation wiki of the Software Engineering Institute (SEI) of Carnegie Mellon University (CMU).
[wiki.sei.cmu.edu/ sad/ index.php/ Image:PurchaseOrderActivityDiagram.png]
"A purchase order (PO) is a commercial document and first official offer issued by a buyer to a seller, indicating types, quantities, and agreed prices for products or services. Acceptance of a purchase order by a seller forms a contract between the buyer and seller, so no contract exists until the purchase order is accepted. It is used to control the purchasing of products and services from external suppliers.
Creating a purchase order is typically the first step of the purchase to pay process in an ERP system." [Purchase order. Wikipedia]
This purchase order processing UML activity diagram example was created using the ConceptDraw PRO diagramming and vector drawing software extended with the ATM UML Diagrams solution from the Software Development area of ConceptDraw Solution Park.
UML activity diagram of purchase order processing
UML activity diagram of purchase order processing , send signal action, initial node, horizontal swimlanes, activity partition, activity group, fork node, join node, decision node, merge node, activity final node, activity edge, object flow edge, action, accept event action,