 ConceptDraw Solution Park
ConceptDraw Solution Park collects graphic extensions, examples and learning materials
 Business Infographics Area
ConceptDraw Business Infographics Solutions helps you to design eye-catching marketing infographics, on subjects such as content marketing, education, IT, social media marketing, and marketing plans; allowing you to represent, share and explain various pi
 Spatial Infographics
Spatial infographics solution extends ConceptDraw PRO software with infographic samples, map templates and vector stencils libraries with design elements for drawing spatial information graphics.
HelpDesk
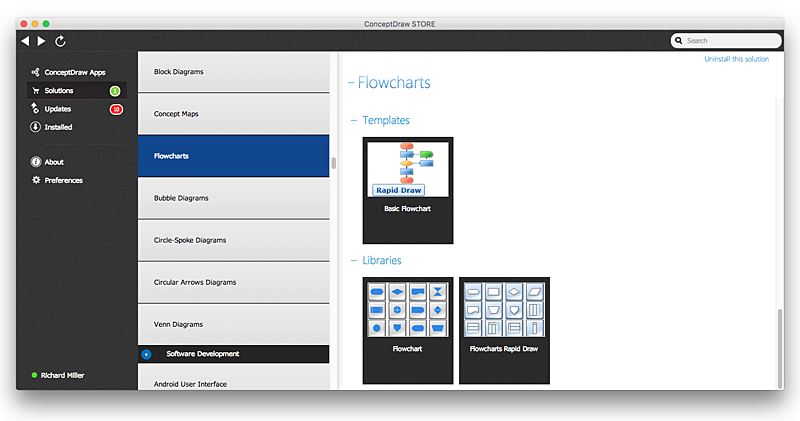
Flowchart Software Free Download
Making flowchart is an easiest way to depict any typical process. Any complex process, consisting from standard components can be displayed as a Flowchart. ConceptDraw PRO is proved to be a simple and easy tool for creating flowcharts. It does not require the skills of a professional designer. Making flowchart to map any process you will see the ways of its optimization and improvement. Flowchart software is here and you can download it for free.
 UK Map
The Map of UK solution contains collection of professionally designed samples and scalable vector stencil graphics maps, representing the United Kingdom counties, regions and cities. Use the Map of UK solution from ConceptDraw Solution Park as the base fo
 Plant Layout Plans
This solution extends ConceptDraw PRO v.9.5 plant layout software (or later) with process plant layout and piping design samples, templates and libraries of vector stencils for drawing Plant Layout plans. Use it to develop plant layouts, power plant desig
 Enterprise Architecture Diagrams
Enterprise Architecture Diagrams solution extends ConceptDraw PRO software with templates, samples and library of vector stencils for drawing the diagrams of enterprise architecture models.
 ConceptDraw Solution Park
ConceptDraw Solution Park collects graphic extensions, examples and learning materials
Design Pictorial Infographics. Design Infographics
In the course of recent decades data visualization went through significant development and has become an indispensable tool of journalism, business intelligence and science. The way visual information may be conveyed is not limited simply to static or dynamic representation, it can also be interactive. Infographics can be conditionally divided into several general levels. Primarily, this is level of visualization of information, its interpretation and association on any ground. Second level can be defined as a visualization of knowledge, depiction of thoughts and ideas in the form of images or diagrams. Finally, the level of data visualization, which processes data arrays in charts, enabling the information to be more clearly perceived. You can also identify the main approaches to the creation of infographics: exploratory and narrative. Exploratory method insists on minimalist design in favor of data precision without unnecessary details and is common for scientific researches and ana- Free Infographics Creation Sites
- Free Infographics Maker
- Free Infographic Elements Metro
- Free Infographics Tools Downloads
- Flowchart Software Free Download | Typography Infographic ...
- Free Trial Infographic
- Flowchart Software Free Download | Marketing Plan Infographic ...
- Infographic Software | Flowchart Software Free Download ...
- Flowchart Software Free Download | Purchase and Download ...
- Free Infographic Software
- Free Infographic Software Solutions
- Infographic Maker Free Online
- Best Free Infographic Maker
- Free Infographic Tools
- Free Infographic Creator
- Best Free Infographic Generator
- Free Infographic Software 2016
- Swot Infographics Free Downloads
- Maps and Directions | Map Directions | Spatial infographics Design ...
- Bio Flowchart Lite | Content Marketing Infographics | ConceptDraw ...

