Best Value Stream Mapping mac Software
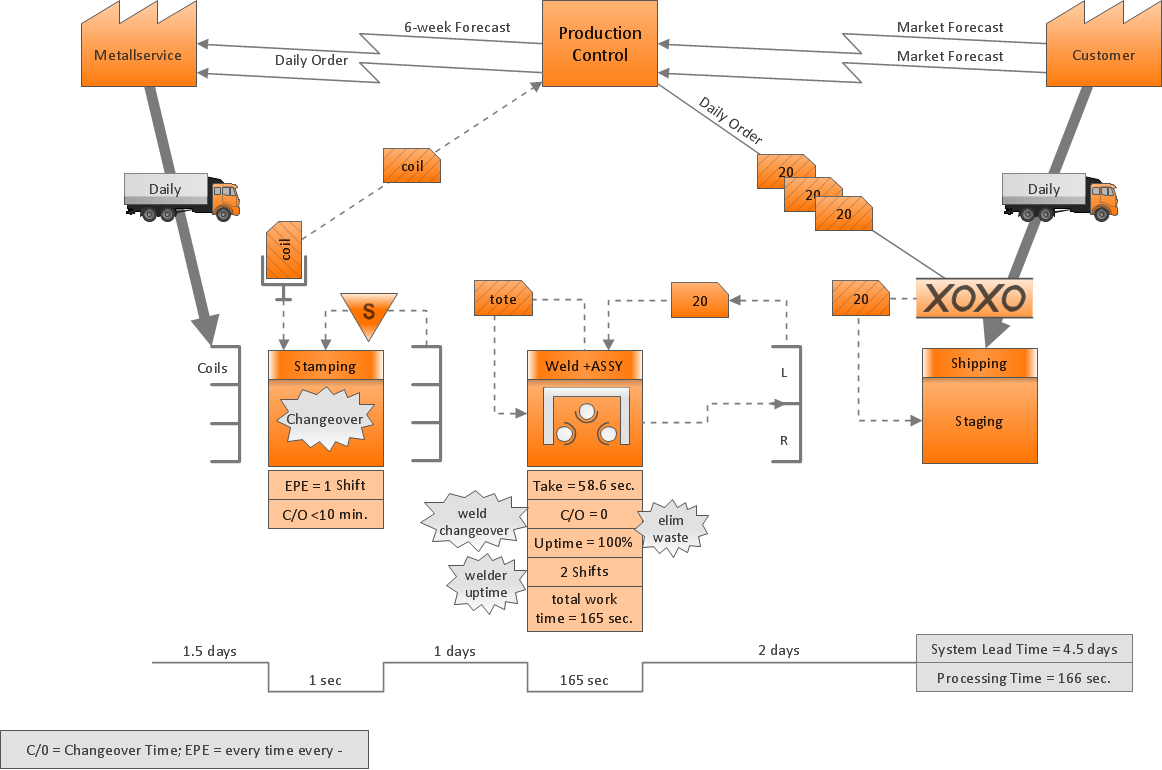
Create value stream maps - for value stream analysis and value stream management, material and information flow mapping, using our quick start templates included with ConceptDraw.Value Stream Mapping Symbols
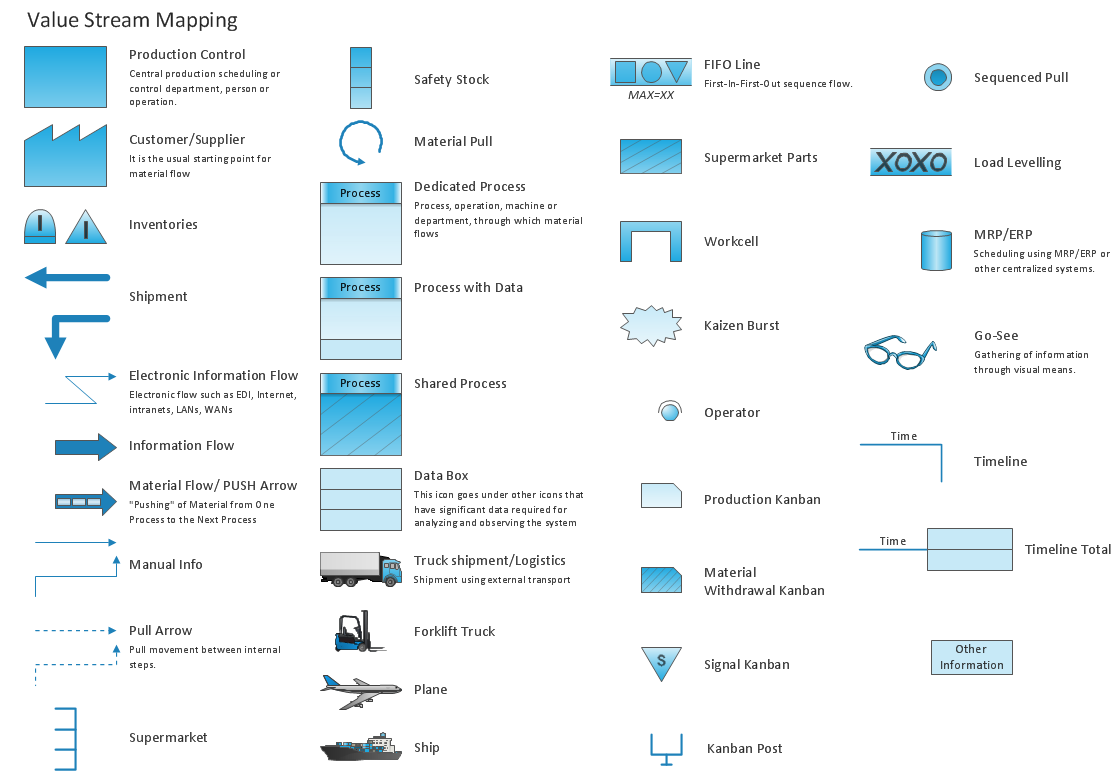
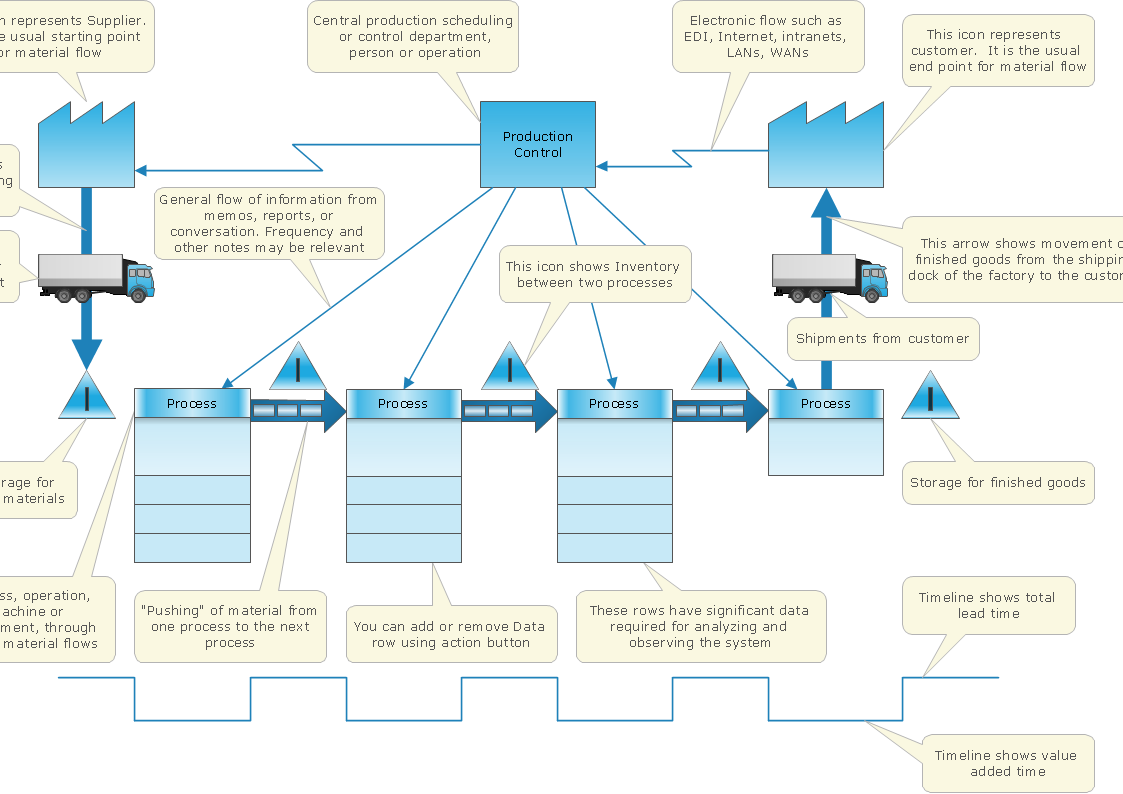
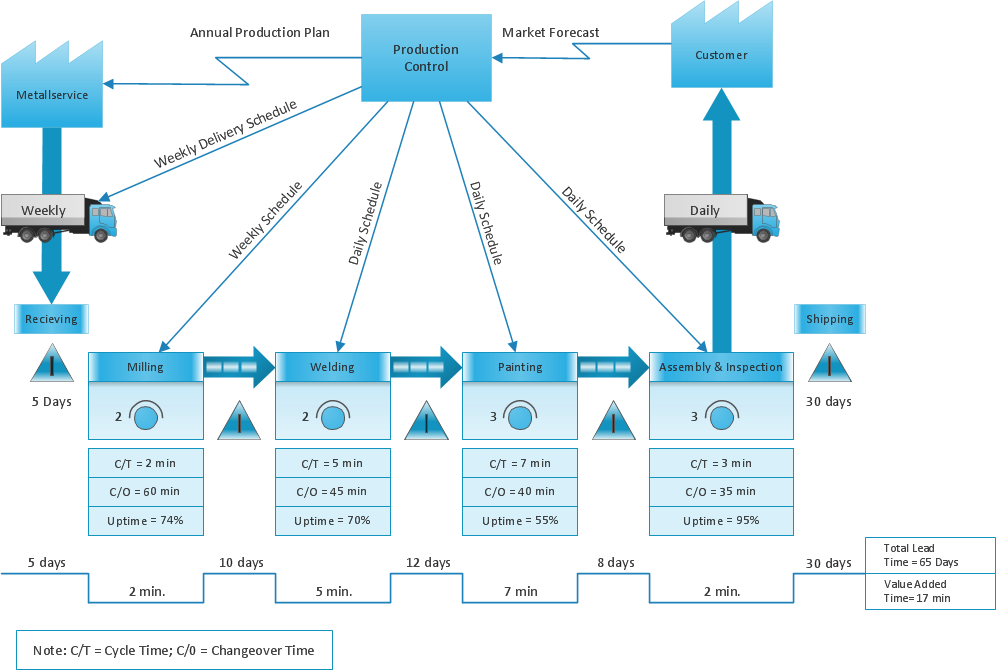
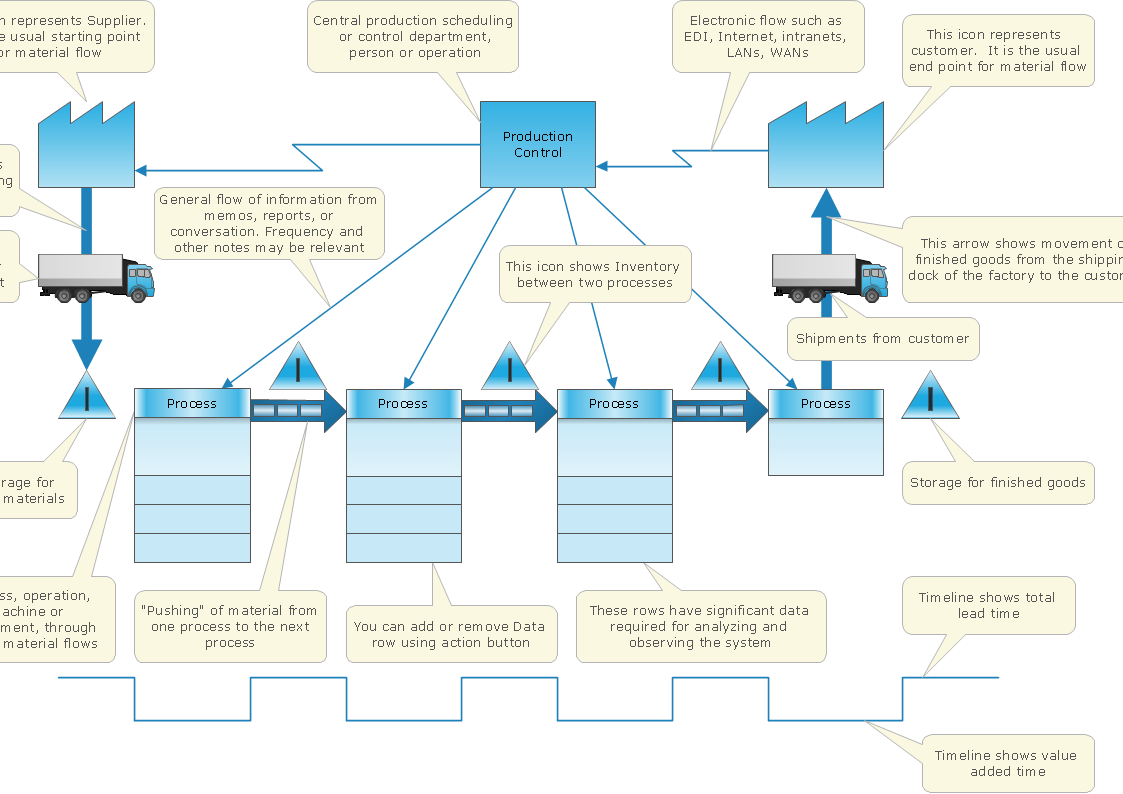
VSM symbols are the best for a production process designing. The entire Value Stream Mapping method uses a graphical representation of the manufacturing process, factors' pros and cons, that all stakeholders can easily understand. Value Stream Mapping is a graphical technique that provides possibilities to improve analysis of a manufacturing process, at the stage of the transferring information or materials that required to deliver a product or service to the customer.Value Stream Mapping Software
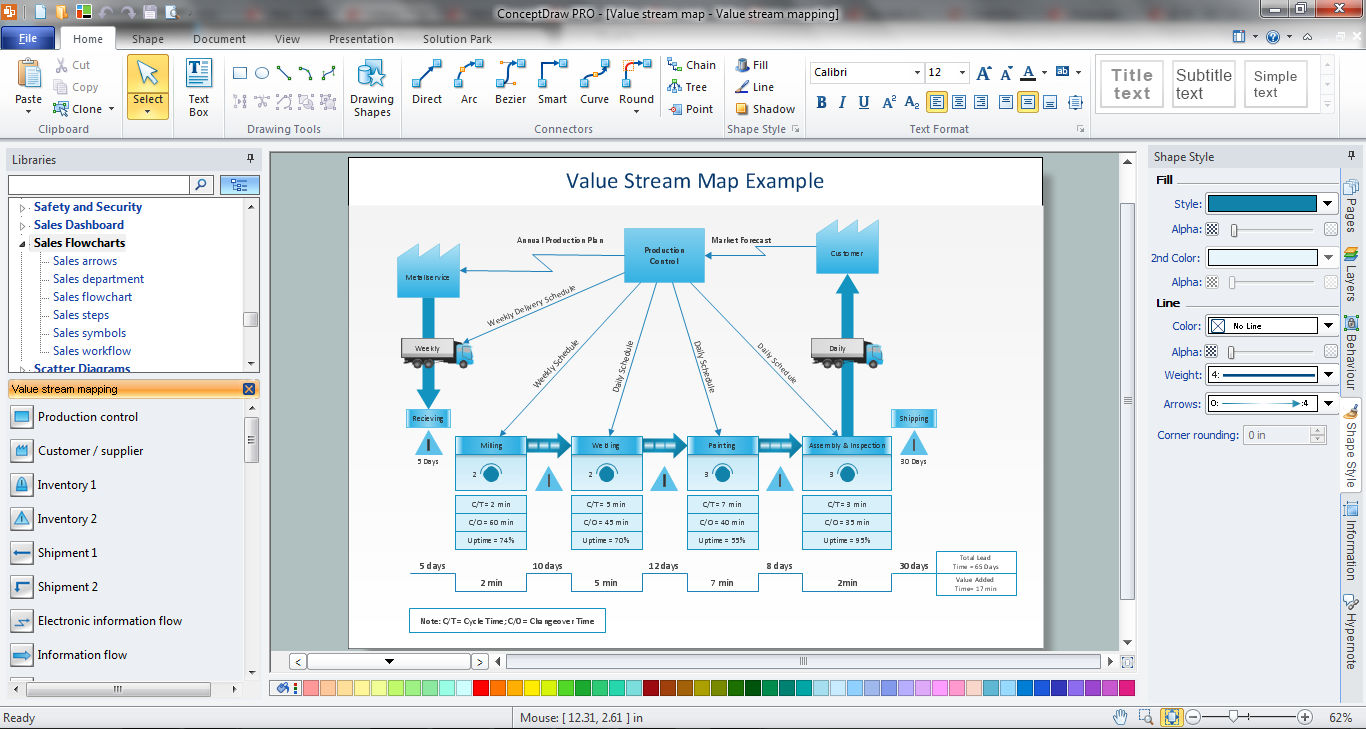
ConceptDraw PRO is a best Value Stream Mapping software. The graphical representation of a process is a powerful tool that helps in the diagnosis of process efficiency and allows companies to develop improved processes. The new Value Stream Mapping solution found in the ConceptDraw Solution Park continues to extend the range of ConceptDraw PRO into a business graphics tool that can be used to document processes in any organization.Value-Stream Mapping for Manufacturing
Create value stream maps - for value stream analysis and value stream management, material and information flow mapping, using our quick start templates included with ConceptDraw.Value Stream Mapping Template
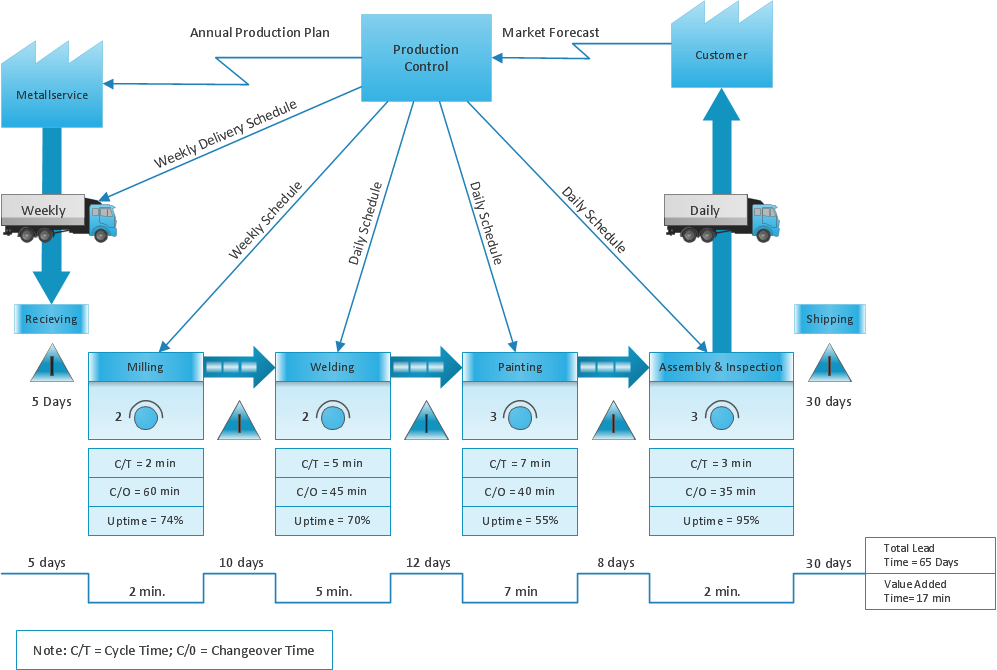
Use ConceptDraw PRO extended with Value Stream Mapping solution for document processes with professional designed Value Stream Mapping template.Lean Manufacturing Diagrams
The Value Stream Mapping solution continues to extend the range of ConceptDraw PRO into a business graphics tool that can be used to document processes of Lean Manufacturing.Standard Shapes for Value Stream Mapping
ConceptDraw Value Stream Mapping solution extends software with templates, samples and vector shapes for drawing Value Stream Maps (VSM).Value Stream Mapping for the Lean Office
Value Stream Mapping for the lean office is a tool that uses a flow diagram to document in great detail every step of a manufacturing process.The Lean Enterprise Value Stream Mapping
Create value stream maps - for value stream analysis and value stream management, material and information flow mapping, using our quick start templates included with ConceptDraw.What is Value Stream Mapping?
Value stream maps (VSM) are an essential tool for organizations applying Lean methods.How To create Value Stream Map (VSM)
Value Stream Map template helps you to create VSM diagrams using ConceptDraw PRO software.Create a Value Stream Map
Use ConceptDraw PRO software extended with Value Stream Mapping solution to create your own VSM diagrams.Quality Engineering Diagrams
Create Quality Engineering Diagrams (value stream maps) - for value stream analysis and value stream management, material and information flow mapping, using our quick start templates included with ConceptDraw.
 Value Stream Mapping
Value stream mapping solution extends ConceptDraw PRO software with templates, samples and vector stencils for drawing the Value Stream Maps (VSM) in lean manufacturing practice.
Value Stream Mapping and Analysis
Value Stream Maps are used in lean methodology for analysis of manufacturing process and identification of the improvement opportunities.- Free Value Stream Mapping For Mac
- Free Value Stream Mapping Software For Mac
- Management Process Mapping Software Free Mac
- Best Value Stream Mapping mac Software | Business Productivity ...
- Process Mapping Template Free Download Mac
- Free Templates To Create Vsm
- Best Value Stream Mapping mac Software
- Best Value Stream Mapping mac Software
- Value Stream Mapping | Best Value Stream Mapping mac Software ...
- Best Value Stream Mapping mac Software | Value Stream Mapping
- Value Stream Mapping | Best Value Stream Mapping mac Software
- Value Stream Mapping Symbols | Design elements - Value stream ...
- Quality Mind Map | Value Stream Mapping | Best Value Stream ...
- Best Value Stream Mapping mac Software | Value Stream Mapping
- Business Process Modeling Software for Mac | Best Value Stream ...
- Value Stream Mapping | Quality | Best Value Stream Mapping mac
- Value Stream Mapping | VSM | Quality Engineering Diagrams | Vsm ...
- Use Microsoft Project For Value Stream Mapping
- Value Stream Mapping Symbols | Design elements - Value stream ...
- Value Stream Mapping | Quality Engineering Diagrams | Value ...
