This work flow chart sample was redesigned from the picture "Weather Forecast" from the article "Simulation Workflows".
[iaas.uni-stuttgart.de/ forschung/ projects/ simtech/ sim-workflows.php]
"(1) The weather is predicted for a particular geological area. Hence, the workflow is fed with a model of the geophysical environment of ground, air and water for a requested area.
(2) Over a specified period of time (e.g. 6 hours) several different variables are measured and observed. Ground stations, ships, airplanes, weather balloons, satellites and buoys measure the air pressure, air/ water temperature, wind velocity, air humidity, vertical temperature profiles, cloud velocity, rain fall, and more.
(3) This data needs to be collected from the different sources and stored for later access.
(4) The collected data is analyzed and transformed into a common format (e.g. Fahrenheit to Celsius scale). The normalized values are used to create the current state of the atmosphere.
(5) Then, a numerical weather forecast is made based on mathematical-physical models (e.g. GFS - Global Forecast System, UKMO - United Kingdom MOdel, GME - global model of Deutscher Wetterdienst). The environmental area needs to be discretized beforehand using grid cells. The physical parameters measured in Step 2 are exposed in 3D space as timely function. This leads to a system of partial differential equations reflecting the physical relations that is solved numerically.
(6) The results of the numerical models are complemented with a statistical interpretation (e.g. with MOS - Model-Output-Statistics). That means the forecast result of the numerical models is compared to statistical weather data. Known forecast failures are corrected.
(7) The numerical post-processing is done with DMO (Direct Model Output): the numerical results are interpolated for specific geological locations.
(8) Additionally, a statistical post-processing step removes failures of measuring devices (e.g. using KALMAN filters).
(9) The statistical interpretation and the numerical results are then observed and interpreted by meteorologists based on their subjective experiences.
(10) Finally, the weather forecast is visualized and presented to interested people." [iaas.uni-stuttgart.de/ forschung/ projects/ simtech/ sim-workflows.php]
The example "Workflow diagram - Weather forecast" was drawn using the ConceptDraw PRO diagramming and vector drawing software extended with the Workflow Diagrams solution from the Business Processes area of ConceptDraw Solution Park.
Work flow chart

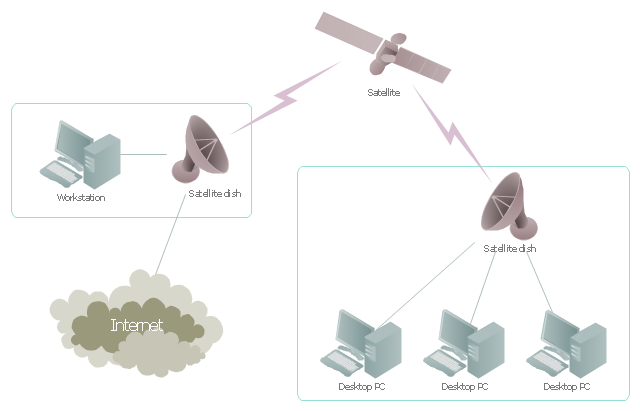
"Satellite Internet access is Internet access provided through communications satellites. ...
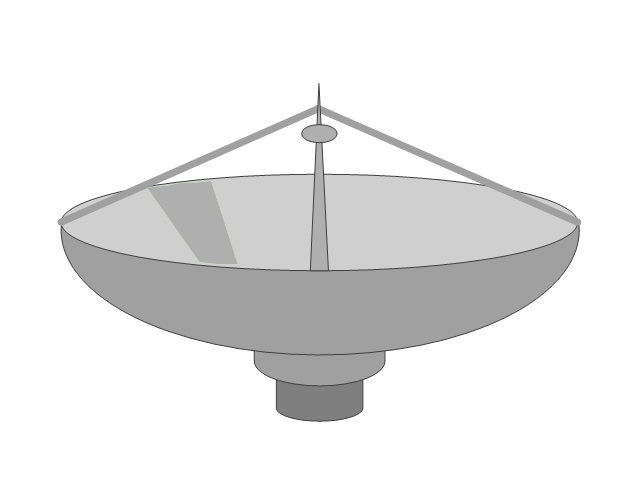
Satellite Internet generally relies on three primary components: a satellite in geostationary orbit (sometimes referred to as a geosynchronous Earth orbit, or GEO), a number of ground stations known as gateways that relay Internet data to and from the satellite via radio waves (microwave), and a VSAT (very-small-aperture terminal) dish antenna with a transceiver, located at the subscriber's premises. Other components of a satellite Internet system include a modem at the user end which links the user's network with the transceiver, and a centralized network operations center (NOC) for monitoring the entire system. Working in concert with a broadband gateway, the satellite operates a Star network topology where all network communication passes through the network's hub processor, which is at the center of the star. With this configuration, the number of remote VSATs that can be connected to the hub is virtually limitless." [Satellite Internet access. Wikipedia]
This satellite telecom network diagram example was created using the ConceptDraw PRO diagramming and vector drawing software extended with the Telecommunication Network Diagrams solution from the Computer and Networks area of ConceptDraw Solution Park.
Satellite telecom network diagram
The vector stencils library "Electrical and telecom" contains 83 symbols of electrical and telecommunication equipment.
Use these shapes for drawing electrical and telecom system design floor plans, cabling layout schemes, and wiring diagrams in the ConceptDraw PRO diagramming and vector drawing software.
The vector stencils library "Electrical and telecom" is included in the Electric and Telecom Plans solution from the Building Plans area of ConceptDraw Solution Park.
Luminaire ceiling mount

Enclosed ceiling luminaire
Wall light

1-light bar
2-light bar
4-light bar
6-light bar
8-light bar
Down lighter
Outdoor lightning
Outdoor lightning, bollard

Batten fluorescent, 1 lamp
Batten fluorescent, 2 lamps
Batten fluorescent, 3 lamps
Batten fluorescent, 4 lamps
Surface Fluorescent Light

Modular fluorescent fitting

Modular fluorescent fitting, inverter
Modular fluorescent fitting 2
Pull-cord switch
Emergency light

Emergency light 2

Emergency sign
Switch

Switch, 1 pole
Switch, 2 pole
Switch, 2-way
Multi-switch
Switch, intermediate
Dimmer switch
Dimmer switch 2
Socket
Socket 2
Switched socket
Switched socket 2
Double socket
Double socket 2
Socket outlet

Telephone outlet
Telephone outlet 2
Stereo outlet
Television outlet
Service panel, surface
Service panel, inset
Thermostat

Ceiling fan
Hold open unit
Detector
Fire alarm
City Fire Alarm Station

Fire Alarm Station
Fire Alarm Bell
Fire Alarm Central Station
Automatic Fire Alarm Device
Main control
Ground
Doorbell
Push Button
Buzzer
Annunciator
Horn
Maid's Signal Plug
Signal Central Station
Doorbell Chime
Doorbell Transformer
Magnetic Door Hold
Intercom
Telephone Key System

Digital Satellite System
Inside Antenna
Outside Antenna
Electric Motors
Single Phase
Three of Poly Phase
Wall Mounted Electrical Junction Box for Hardware
Wall Mounted Telephone/Data Junction Box for Hardware
Card Reader Access System
Emergency Release Button
Motion Sensor
Electric Door Opener
Watchman's Station
Watchman's Central Station
Battery

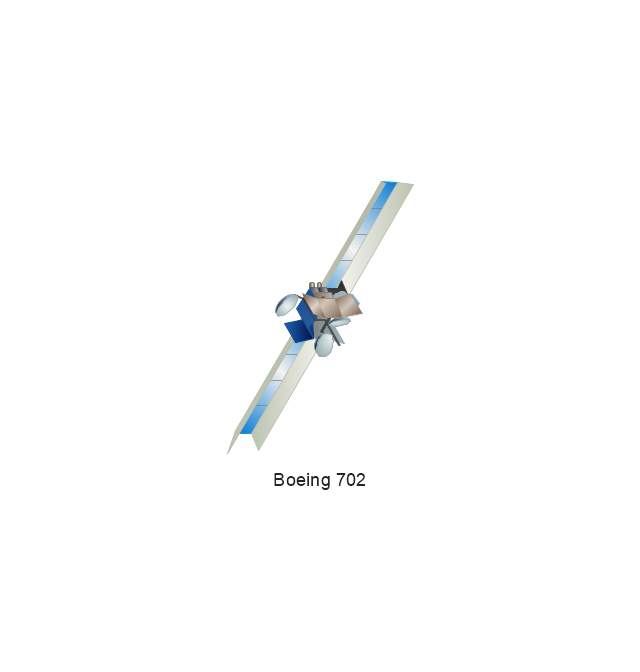
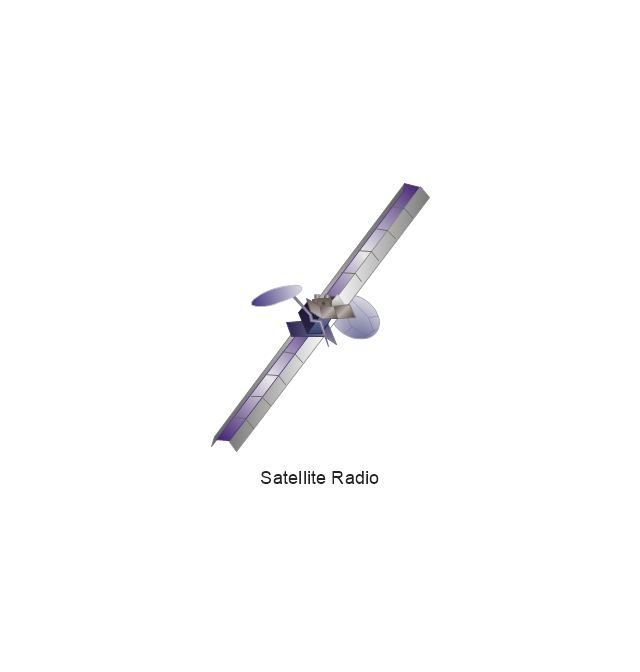
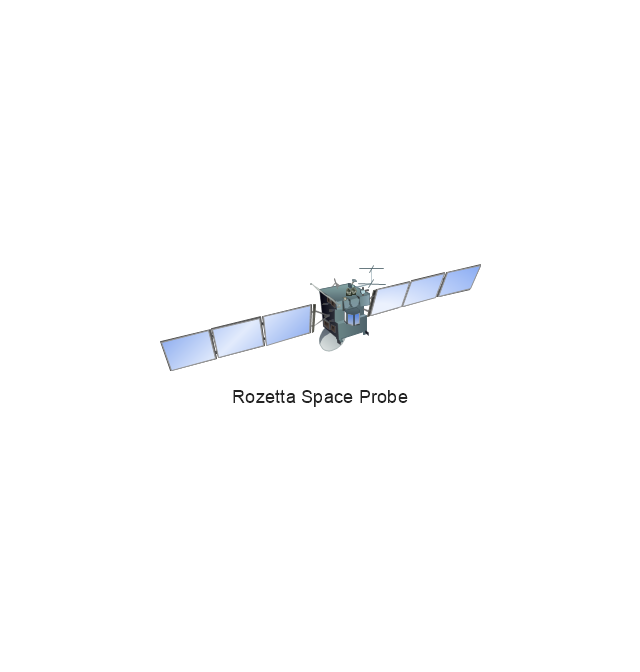
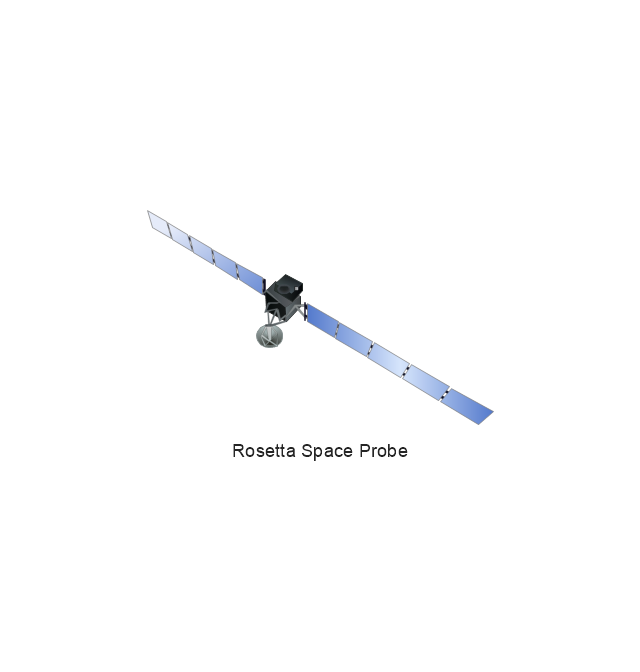
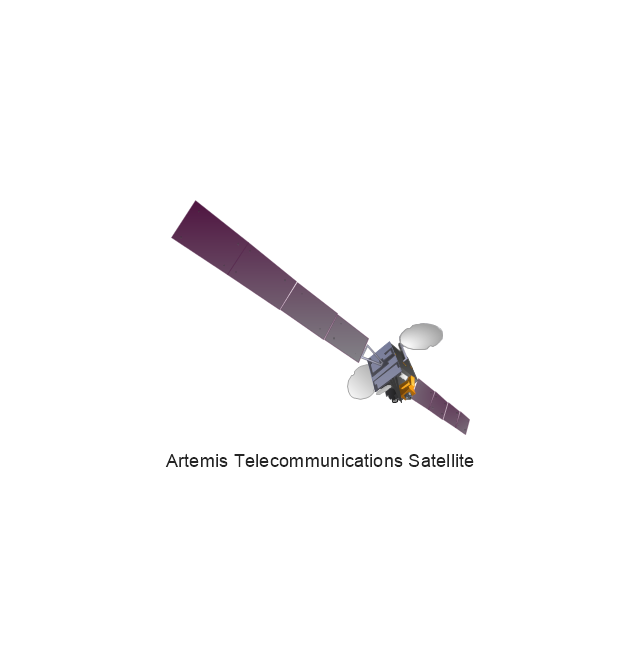
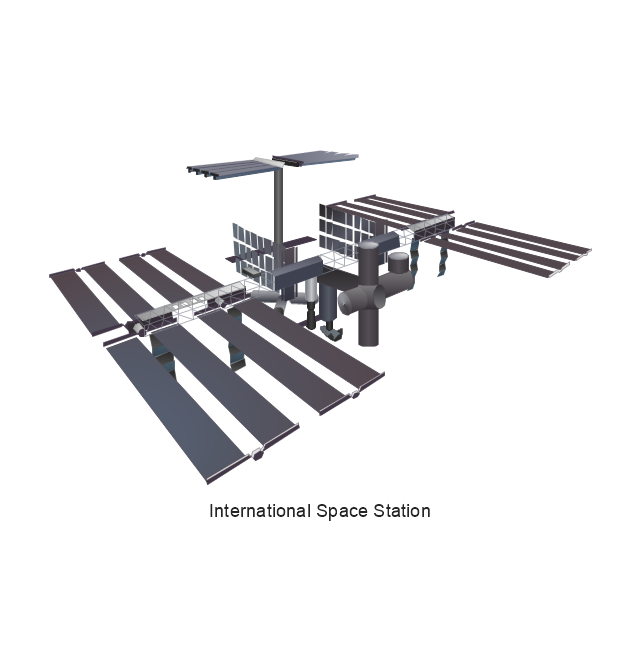
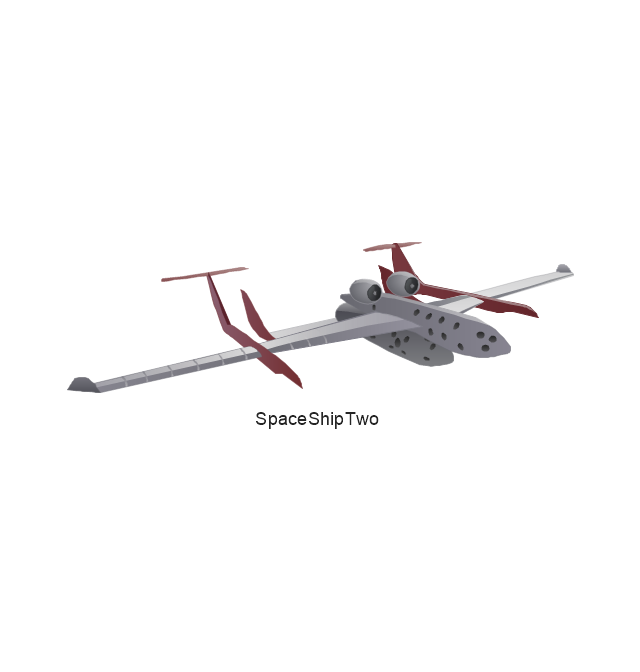
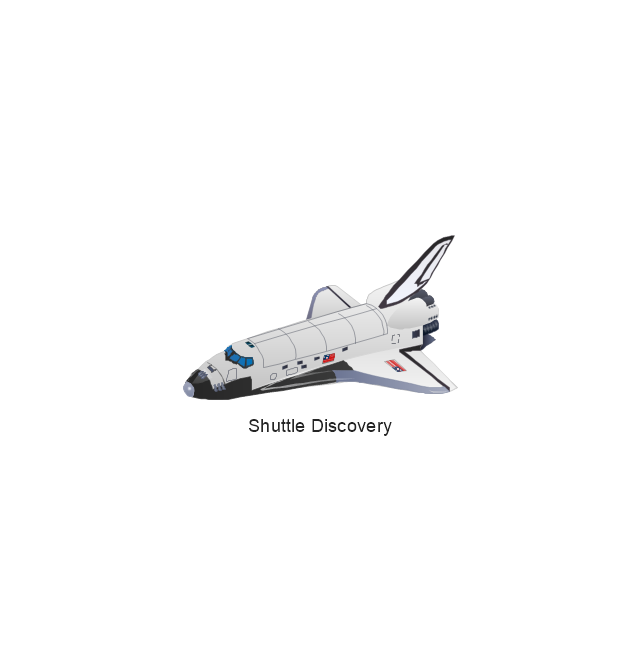
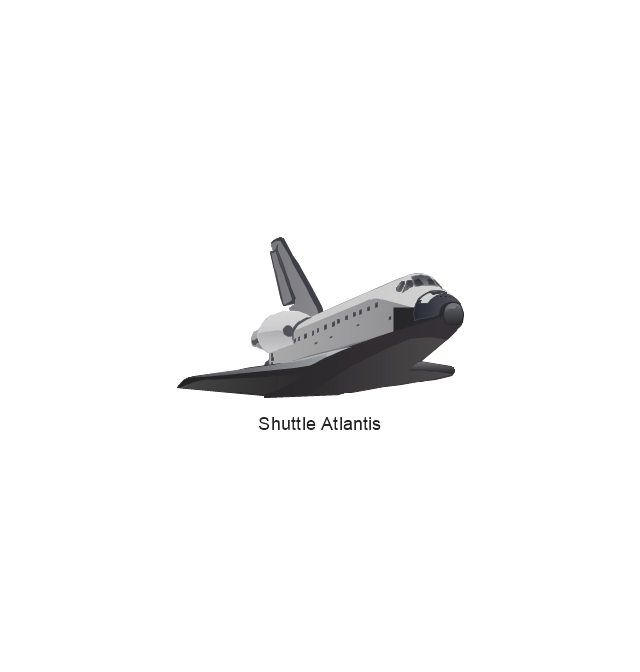
The vector stencils library "Aerospace" contains 38 clip art images for creating aerospace illustrations, presentation slides, infographics and webpages using the ConceptDraw PRO diagramming and vector drawing software.
"Aerospace describes the human effort in science, engineering and business to fly in the atmosphere of Earth (aeronautics) and surrounding space (astronautics). Aerospace organisations research, design, manufacture, operate, or maintain aircraft and/ or spacecraft. Aerospace activity is very diverse, with a multitude of commercial, industrial and military applications.
Aerospace is not the same as airspace, which is the physical air space directly above a location on the ground." [Aerospace. Wikipedia]
The vector stencils library "Aerospace" is included in the Aerospace and Transport solution from the Illustrations area of ConceptDraw Solution Park.
www.conceptdraw.com/ solution-park/ illustrations-aerospace-transport
Boeing 702
Satellite Radio
Rosetta Space Probe
Rosetta Space Probe
Artemis Telecommunications Satellite
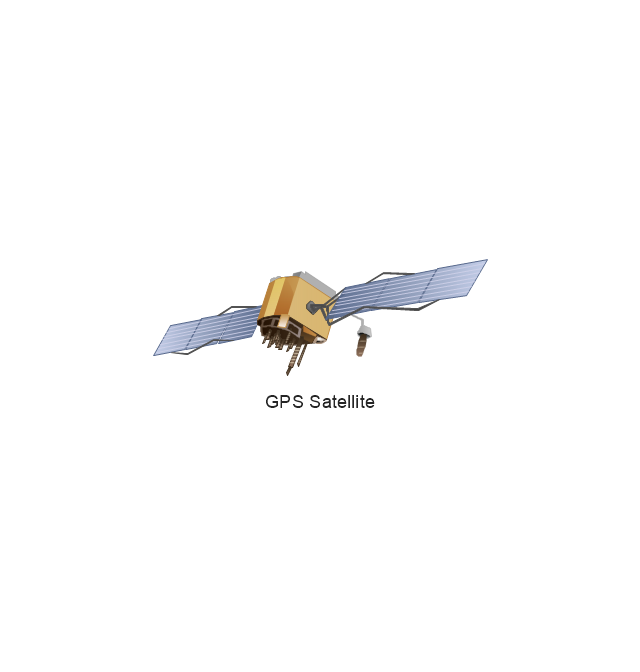
GPS Satellite
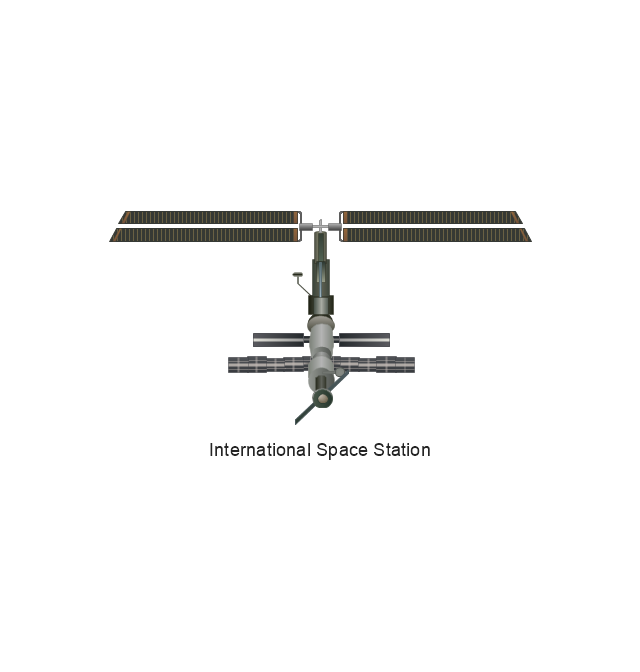
International Space Station
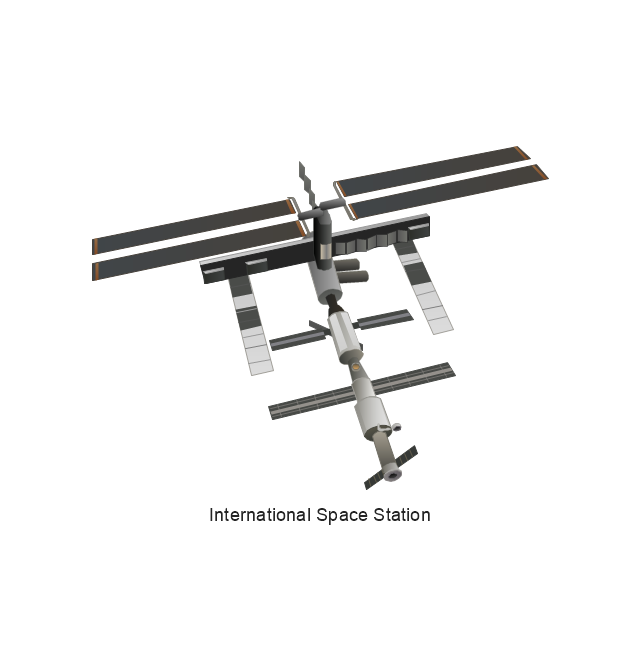
International Space Station
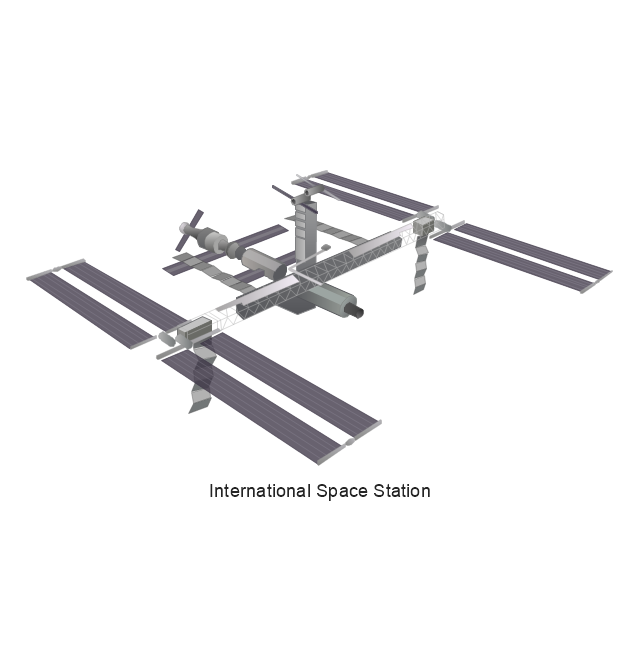
International Space Station
International Space Station
SpaceShipTwo
Shuttle Discovery
Shuttle Atlantis
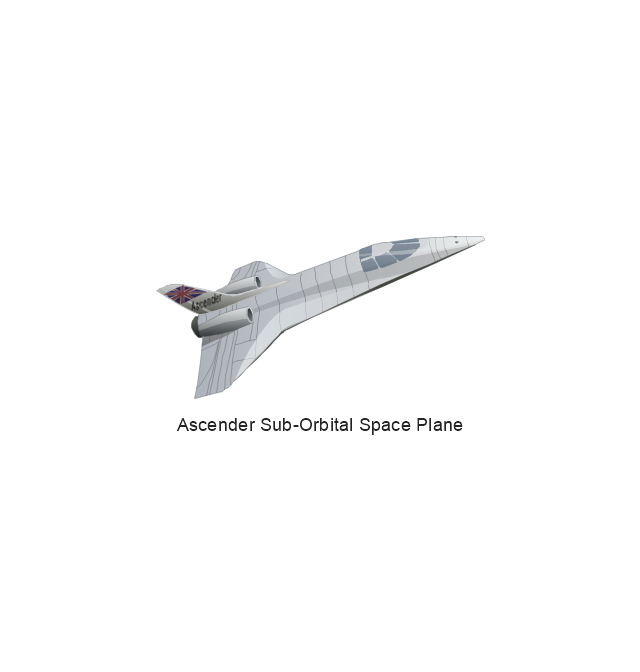
Ascender Sub-Orbital Space Plane
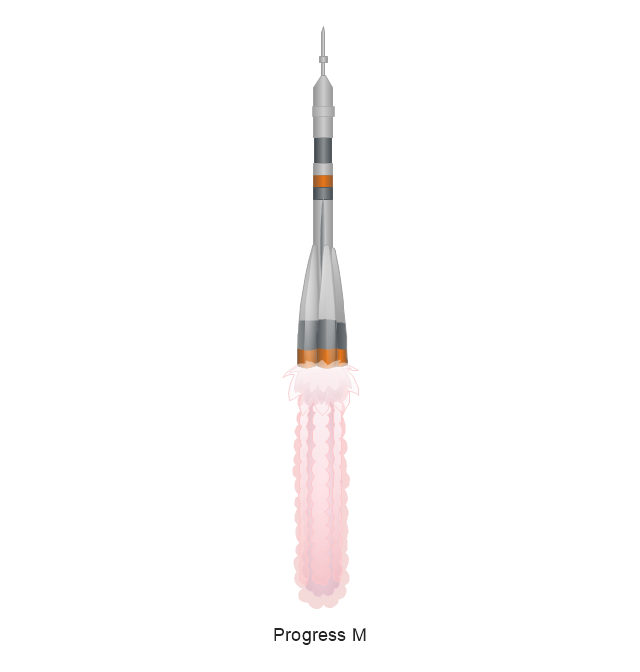
Progress M
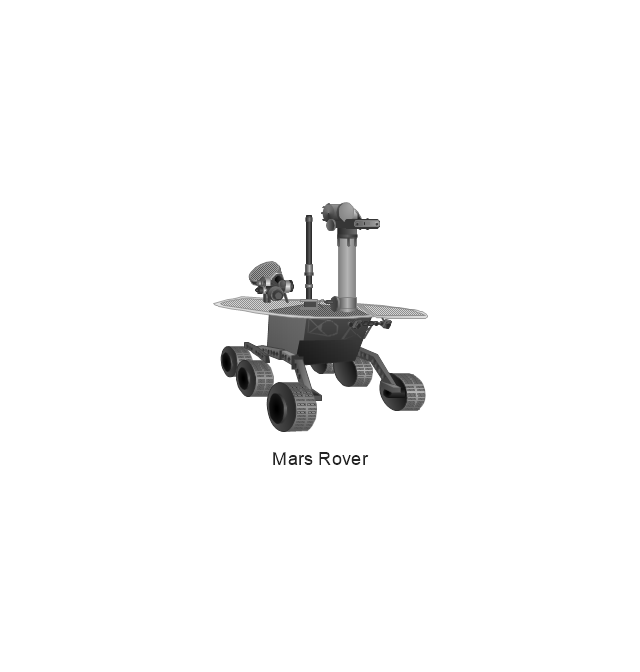
Mars Rover
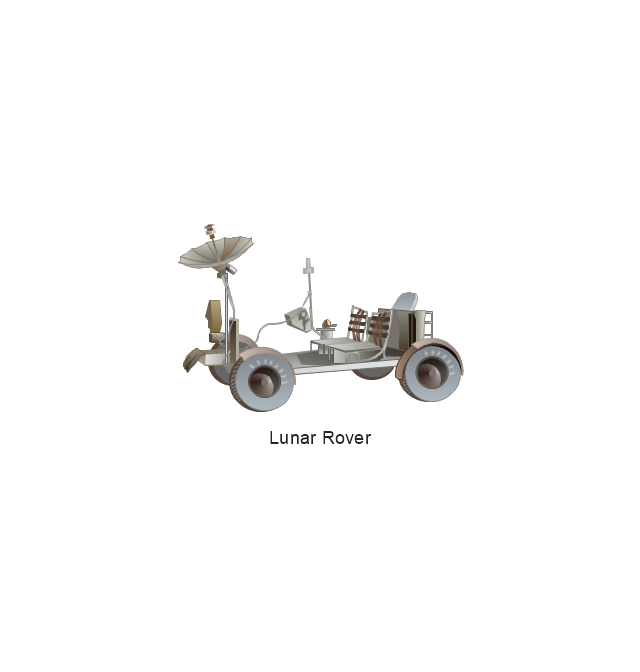
Lunar Rover
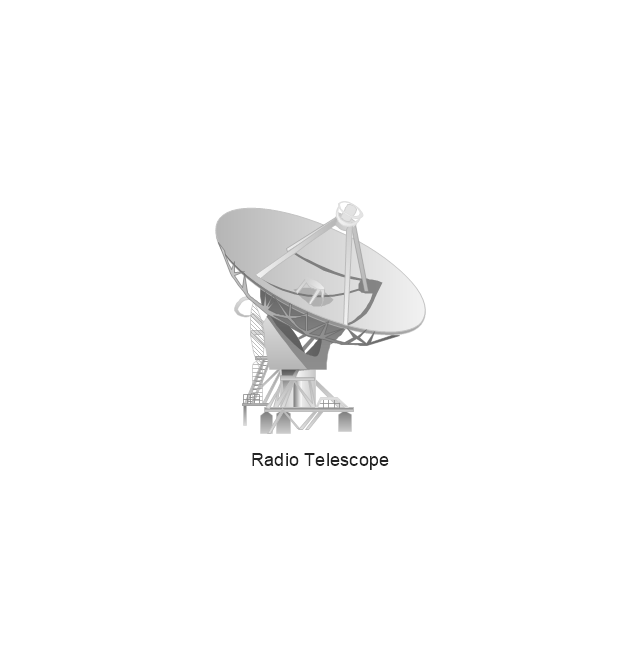
Radio Telescope
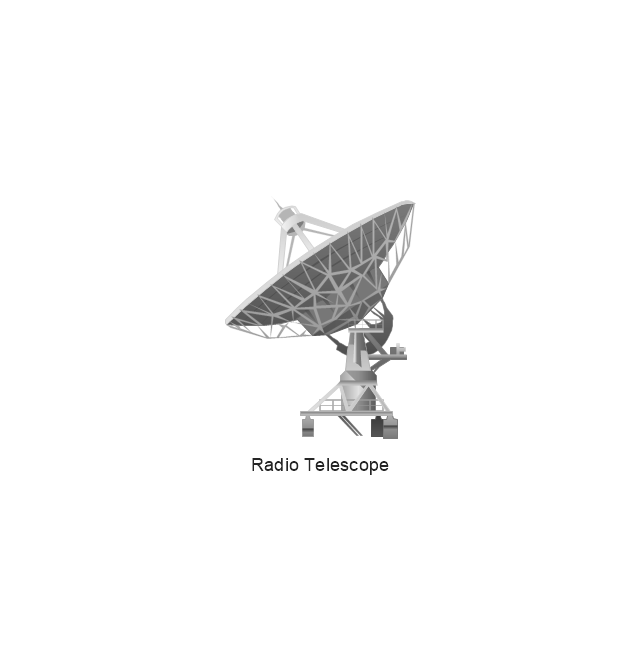
Radio Telescope
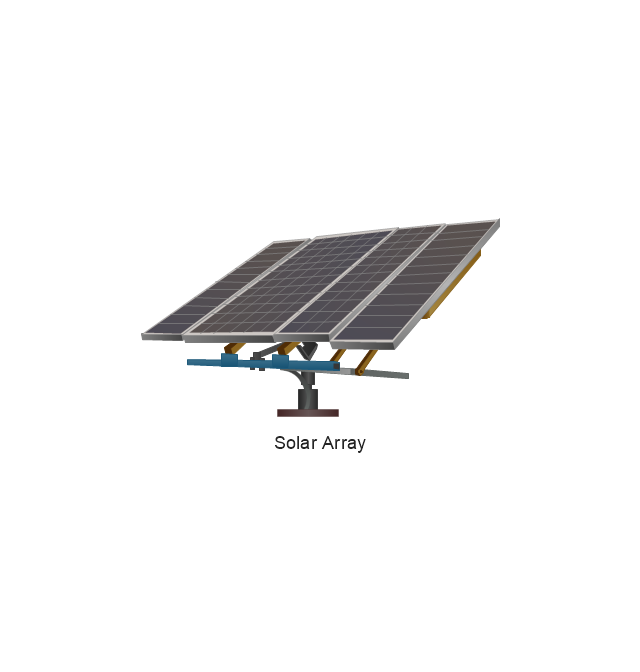
Solar Array
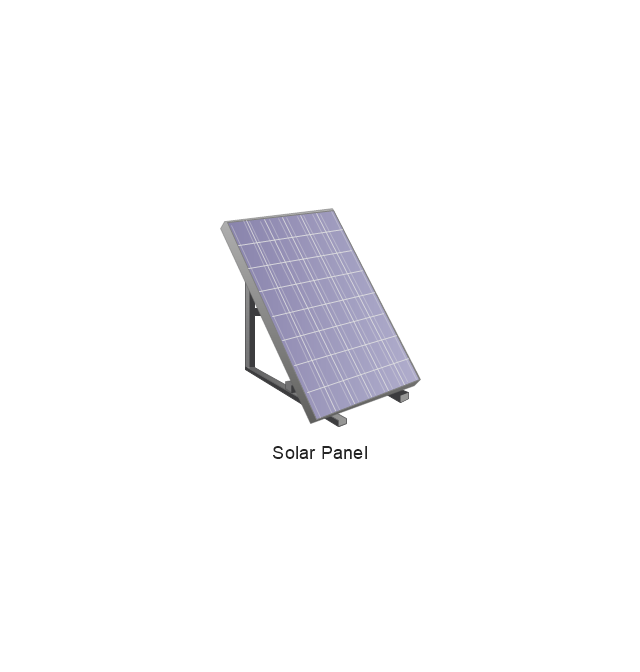
Solar Panel
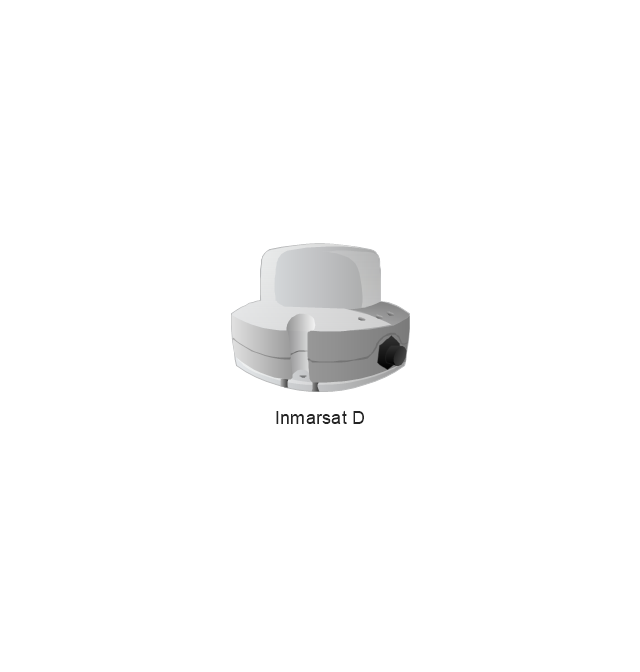
Inmarsat D
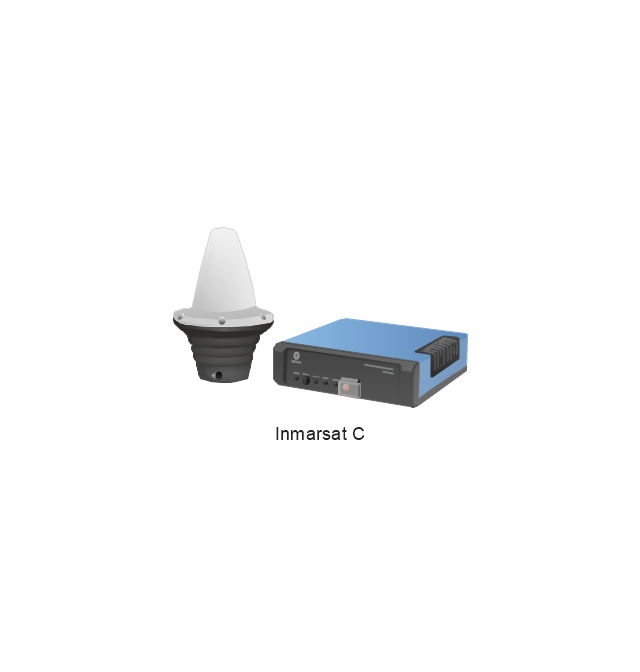
Inmarsat C
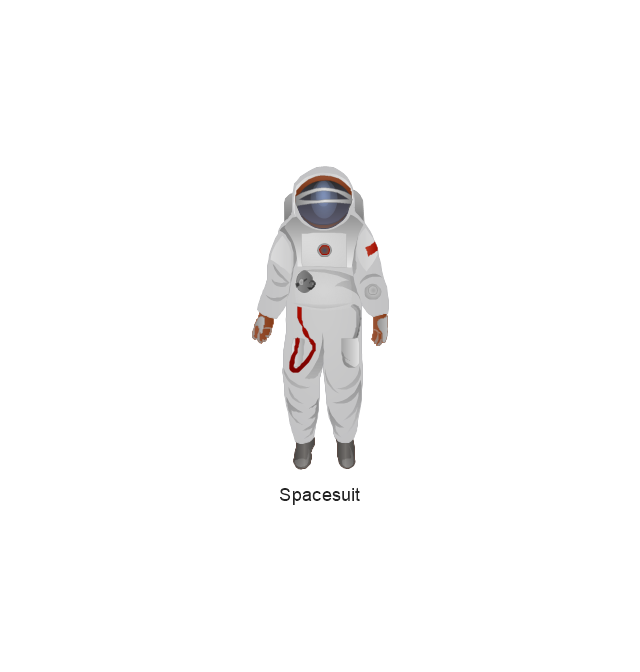
Spacesuit
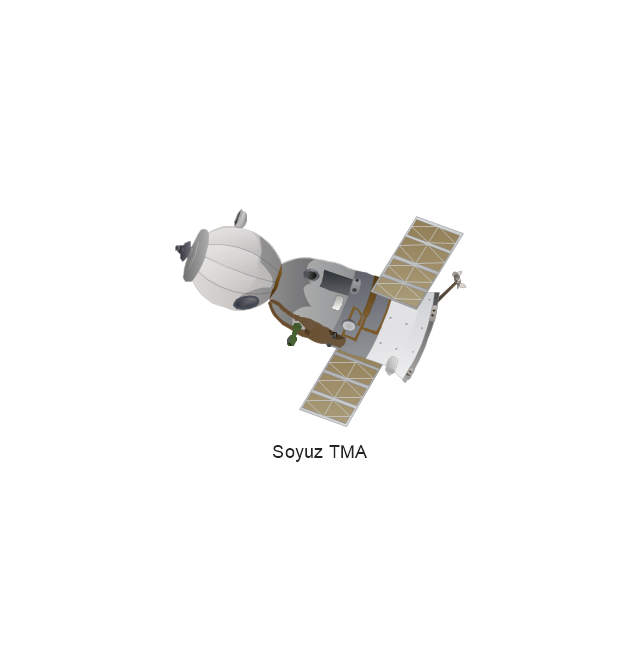
Soyuz TMA
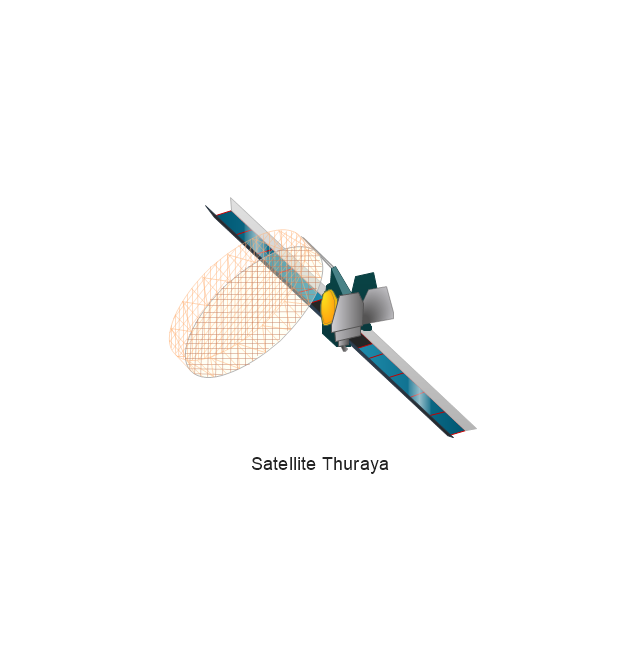
Satellite Thuraya
Tracking Headquarters
Earth

Earth

Earth

Earth

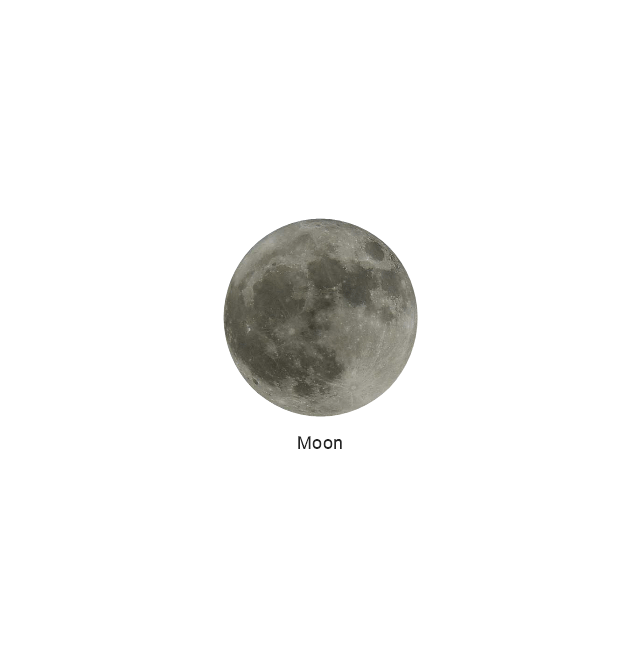
Moon
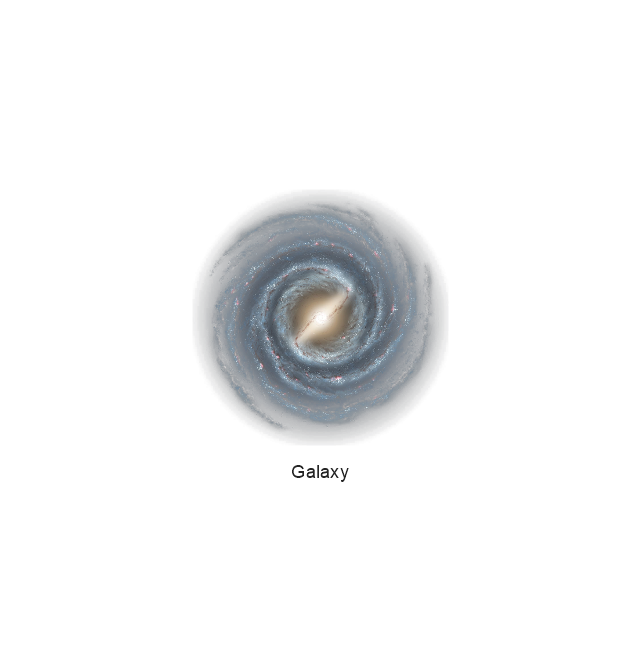
Galaxy
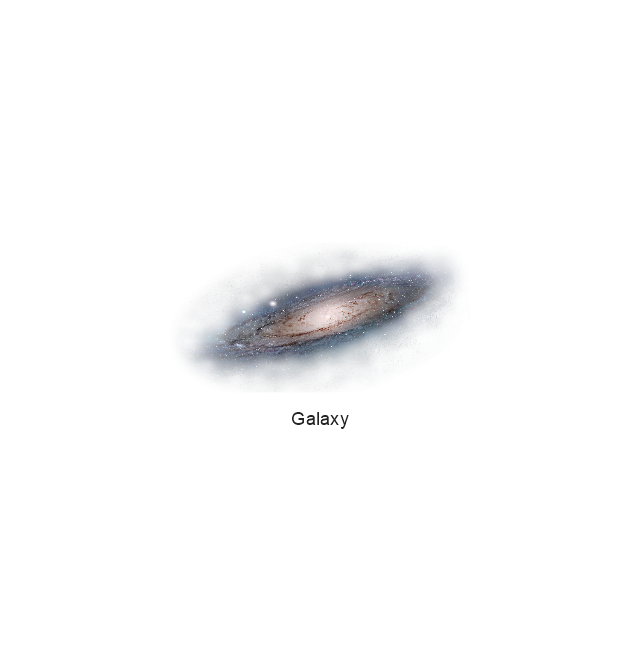
Galaxy
Galaxy
Astronaut/Cosmonaut
Tracking Headquarters
Night Sky

How To use House Electrical Plan Software


Tree Network Topology Diagram

The vector stencils library "Electrical and telecom" contains 83 symbols of electrical and telecommunication equipment.
Use these shapes for drawing electrical and telecom system design floor plans, cabling layout schemes, and wiring diagrams in the ConceptDraw PRO diagramming and vector drawing software.
The vector stencils library "Electrical and telecom" is included in the Electric and Telecom Plans solution from the Building Plans area of ConceptDraw Solution Park.
Use these shapes for drawing electrical and telecom system design floor plans, cabling layout schemes, and wiring diagrams in the ConceptDraw PRO diagramming and vector drawing software.
The vector stencils library "Electrical and telecom" is included in the Electric and Telecom Plans solution from the Building Plans area of ConceptDraw Solution Park.
Luminaire ceiling mount
Enclosed ceiling luminaire
Wall light
1-light bar
2-light bar
4-light bar
6-light bar
8-light bar
Down lighter
Outdoor lightning
Outdoor lightning, bollard
Batten fluorescent, 1 lamp
Batten fluorescent, 2 lamps
Batten fluorescent, 3 lamps
Batten fluorescent, 4 lamps
Surface Fluorescent Light
Modular fluorescent fitting
Modular fluorescent fitting, inverter
Modular fluorescent fitting 2
Pull-cord switch
Emergency light
Emergency light 2
Emergency sign
Switch
Switch, 1 pole
Switch, 2 pole
Switch, 2-way
Multi-switch
Switch, intermediate
Dimmer switch
Dimmer switch 2
Socket
Socket 2
Switched socket
Switched socket 2
Double socket
Double socket 2
Socket outlet
Telephone outlet
Telephone outlet 2
Stereo outlet
Television outlet
Service panel, surface
Service panel, inset
Thermostat
Ceiling fan
Hold open unit
Detector
Fire alarm
City Fire Alarm Station
Fire Alarm Station
Fire Alarm Bell
Fire Alarm Central Station
Automatic Fire Alarm Device
Main control
Ground
Doorbell
Push Button
Buzzer
Annunciator
Horn
Maid's Signal Plug
Signal Central Station
Doorbell Chime
Doorbell Transformer
Magnetic Door Hold
Intercom
Telephone Key System
Digital Satellite System
Inside Antenna
Outside Antenna
Electric Motors
Single Phase
Three of Poly Phase
Wall Mounted Electrical Junction Box for Hardware
Wall Mounted Telephone/Data Junction Box for Hardware
Card Reader Access System
Emergency Release Button
Motion Sensor
Electric Door Opener
Watchman's Station
Watchman's Central Station
Battery
- Satellite telecom network diagram | Dish Network Ground Station
- Satellite telecom network diagram | Mobile satellite communication ...
- Satellite telecom network diagram | Hybrid satellite and common ...
- Network Architecture | Cisco Switches and Hubs. Cisco icons ...
- Mobile satellite communication network diagram ...
- Global networks - Vector stencils library | Vehicular Network ...
- Types of Flowcharts | Workflow diagram - Weather forecast | Data ...
- Global networks - Vector stencils library | Aircraft - Vector stencils ...
- Diagram Of Work Station
- Weather - Vector stencils library
- Electrical and Telecom Plan Software | How To use Electrical and ...
- Mobile satellite communication network diagram | Hybrid satellite ...
- Telecommunication Network Diagrams | Satellite telecom network ...
- Telecommunication Network Diagrams | 3D Network Diagram ...
- How to Create a Cloud Computing Diagram Using ConceptDraw ...
- Drawing Diagram For Network Station
- Design elements - Aircraft | Transport - Template | Design elements ...
- Mobile satellite communication network diagram ...
- Vertex - Vector stencils library
- Mobile satellite communication network diagram ...