Home area networks (HAN). Computer and Network Examples
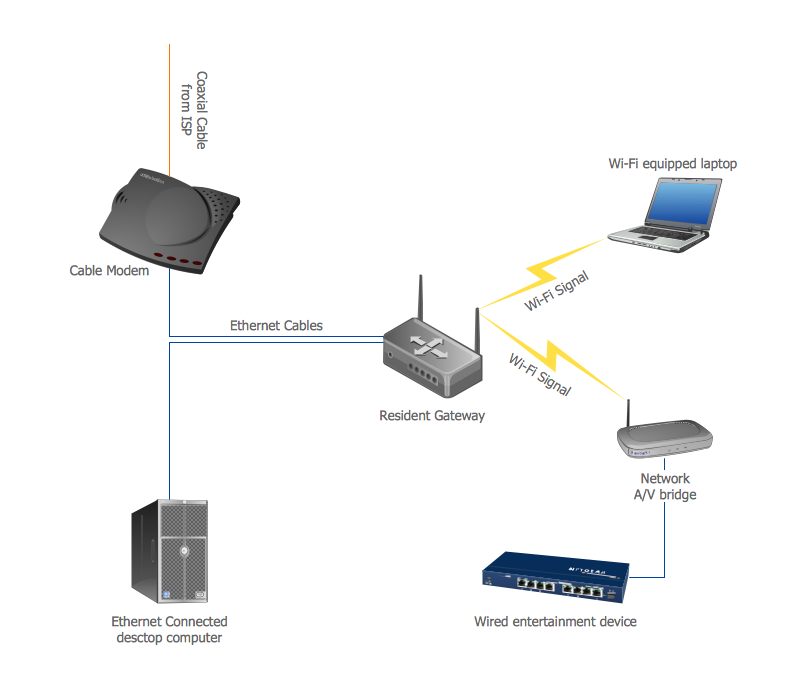
A Home Area Networks (HAN) is a type of local area network that is used in an individual home. The home computers can be connected together by twisted pair or by a wireless network. HAN facilitates the communication and interoperability among digital devices at the home, allows to easier access to the entertainments and increase the productivity, organize the home security. This example was created in ConceptDraw DIAGRAM using the Computer and Networks Area of ConceptDraw Solution Park and shows the home network diagram.
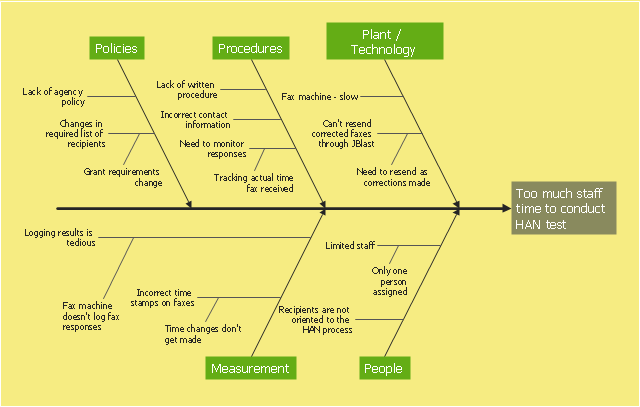
This example was created on the base of the figure from the website of Minnesota Department of Health. [health.state.mn.us/ divs/ opi/ qi/ images/ fishbone_ ex.png]
"Minnesota’s Health Alert Network (HAN) enables public health staff, tribal governments, health care providers, emergency workers, and others working to protect the public to exchange information during a disease outbreak, environmental threat, natural disaster, or act of terrorism." [health.state.mn.us/ han/ ]
The fishbone diagram example "HAN project" was created using the ConceptDraw PRO diagramming and vector drawing software extended with the Fishbone Diagrams solution from the Management area of ConceptDraw Solution Park.
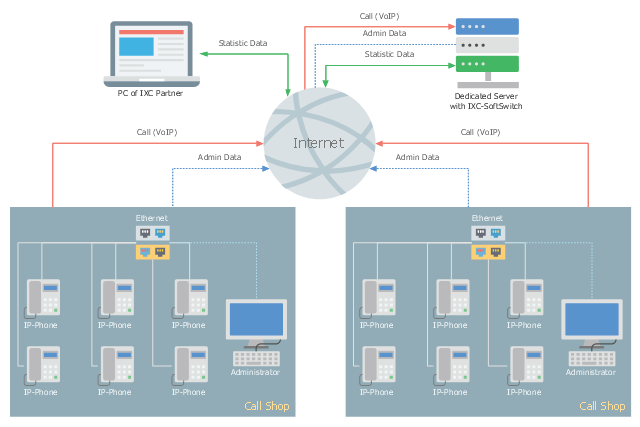
This telecom diagram sample illustrates the call shop solution. It was designed on the base of the Wikimedia Commons file: Call shops.jpg.
[commons.wikimedia.org/ wiki/ File:Call_ shops.jpg]
This file is licensed under the Creative Commons Attribution-Share Alike 3.0 Unported license. [creativecommons.org/ licenses/ by-sa/ 3.0/ deed.en]
"A call shop is a business providing on-site access to telephones for long-distance calling in countries without widespread home long-distance service. Calls may be prepaid or postpaid." [Call shop. Wikipedia]
The telecommunication diagram example "Call shop solution" was created using the ConceptDraw PRO diagramming and vector drawing software extended with the Computers and Communications solution from the Illustration area of ConceptDraw Solution Park.
Fishbone Diagram
Fishbone Diagram is another name for the Cause and Effect Diagram or the Ishikawa Diagram which got its name from the fact that it looks like a fish skeleton. Developed by Kaoru Ishikawa in 1968, a Fishbone Diagram is effectively used for a cause and effect analysis which allows to consider all possible causes for a certain problem or event. ConceptDraw DIAGRAM supplied with Fishbone Diagrams solution from the Management area is the best software for fast and easy drawing professional looking Fishbone Diagram."A home network or home area network (HAN) is a type of local area network that develops from the need to facilitate communication and interoperability among digital devices present inside or within the close vicinity of a home. Devices capable of participating in this network - smart devices such as network printers and handheld mobile computers - often gain enhanced emergent capabilities through their ability to interact. These additional capabilities can then be used to increase the quality of life inside the home in a variety of ways, such as automation of repetitious tasks, increased personal productivity, enhanced home security, and easier access to entertainment." [Home network. Wikipedia]
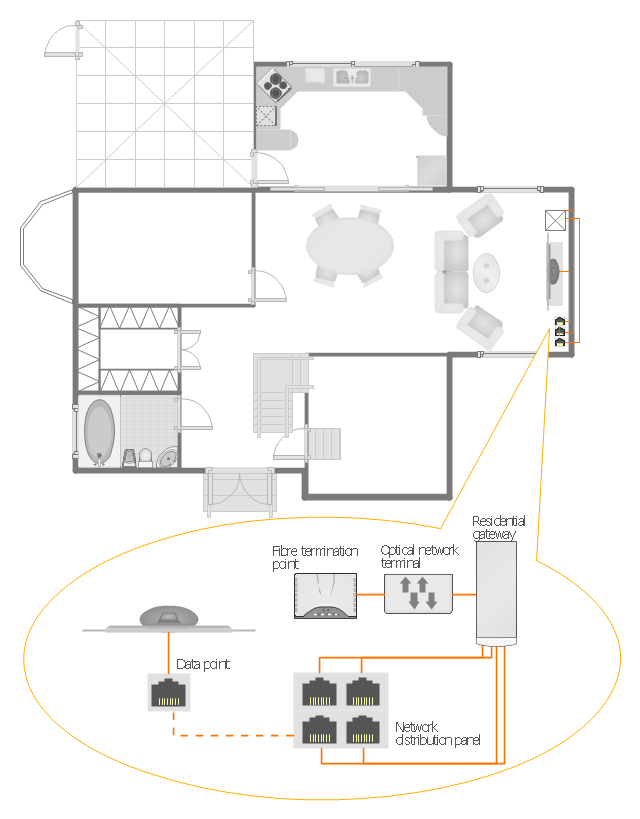
The HAN equipment layout floorplan example "Home network plan" was created using the ConceptDraw PRO diagramming and vector drawing software extended with the Network Layout Floor Plans solution from the Computer and Networks area of ConceptDraw Solution Park.
The HAN equipment layout floorplan example "Home network plan" was created using the ConceptDraw PRO diagramming and vector drawing software extended with the Network Layout Floor Plans solution from the Computer and Networks area of ConceptDraw Solution Park.
Network Topologies
Network topology is a topological structure of computer network, which can be physical or logical. The physical topology depicts location of different computer network elements such as computers, cables and other devices. The logical topology visually displays network dataflows from one device to another. Sometimes network logical and physical topologies can be the same. ConceptDraw DIAGRAM diagramming and vector drawing software is powerful for drawing network maps and network topologies diagrams of any kinds and complexity thanks to the Computer Network Diagrams solution from the Computer and Networks area. ConceptDraw STORE proposes collection of network icons libraries and a lot of Network Topology Diagram examples, samples and templates which were created at ConceptDraw DIAGRAM software specially for Computer Network Diagrams solution. There are six basic types of the network topologies: Bus, Star, Ring, Mesh, Tree, Fully Connected. You can fast and easy design professional-looking diagram for each of them using the ConceptDraw DIAGRAM tools. There are plenty of web Visio-like diagramming software available. Web based diagrams software can be powerful, but sometimes it is essential to have desktop software. One of the most advanced diagrams tools like Visio for Mac OS is ConceptDraw DIAGRAM app.
 Fishbone Diagrams
The Fishbone Diagrams solution extends ConceptDraw DIAGRAM software with the ability to easily draw the Fishbone Diagrams (Ishikawa Diagrams) to clearly see the cause and effect analysis and also problem solving. The vector graphic diagrams produced using this solution can be used in whitepapers, presentations, datasheets, posters, and published technical material.
- Home area networks ( HAN ). Computer and Network Examples ...
- Home area networks ( HAN ). Computer and Network Examples ...
- Home area networks ( HAN ). Computer and Network Examples ...
- Home area networks ( HAN ). Computer and Network Examples ...
- Home area networks ( HAN ). Computer and Network Examples ...
- Campus Area Networks (CAN). Computer and Network Examples ...
- Home area networks ( HAN ). Computer and Network Examples ...
- Campus Area Networks (CAN). Computer and Network Examples ...
- Campus Area Networks (CAN). Computer and Network Examples ...
- Home area network ( HAN ) wiring diagram
- Digital Communications Network. Computer and Network Examples ...
- Cisco Network Design | Home area networks ( HAN ). Computer and ...
- Basic Diagramming | Engineering | Home area network ( HAN ...
- Network Layout Floor Plans | Home network plan | Home area ...
- Home area network ( HAN ) wiring diagram | ConceptDraw PRO ...
- Fishbone diagram - HAN project | Relations diagram - Health care ...
- Network Topologies | Examples Of Pan And Han Network
- Fishbone Diagram | Fishbone Diagrams | Fishbone diagram - HAN ...
- Wiring Diagrams with ConceptDraw PRO | Home area network ...
- Local area network (LAN). Computer and Network Examples ...


