HelpDesk
How to Draw a Hierarchical Organizational Chart
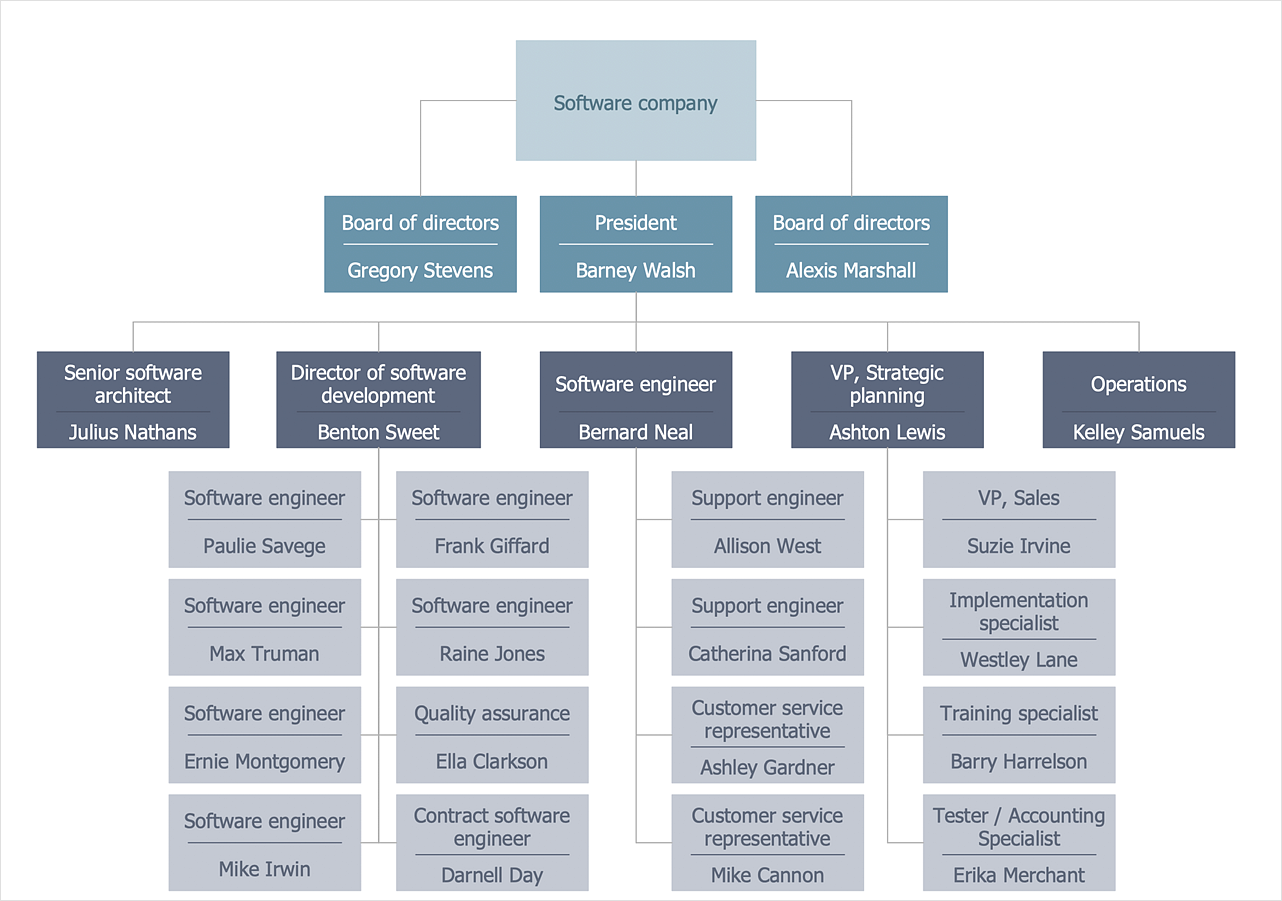
There are a number of different organizational structures. The most appropriate structure will depend on the size of the business and the type of business. A hierarchical organizational structure is one of the most typical organizational structure. This structure can be represented as a pyramid, with a single entity in authority at the top, with subsequent levels of power beneath them. Each member of the pyramid reports only to their direct subordinates or superiors, limiting the amount of communication overhead, which can be seen both as an asset or a limitation. It is easy to see where a hierarchical structure would be an effective solution; companies that have offices based in disparate locations, a business that focuses on diversified markets, any organization with a need for multiple levels of middle management. You can easily create a clear hierarchical organizational chart using ConceptDraw solution that contains templates of the 25 Typical Orgcharts.HelpDesk
How to Draw a Pyramid Diagram
Pyramid diagram (triangle diagram) is used to represent data, which have hierarchy and basics. Due to the triangular form of the diagram, each pyramid section has a different width. The width of the segment shows the level of its hierarchy. Typically, the top of the pyramid is the data that are more important than the base data. A pyramid scheme can be used to show proportional and hierarchical relationships between some logically related items, such as departments within an organization, or successive elements of any process. This type of diagram is often used in marketing to display hierarchically related data, but it can be used in a variety of situations. ConceptDraw DIAGRAM allows you to make a pyramid diagram, quickly and easily using special libraries.Infographic Generator
ConceptDraw DIAGRAM extended with Typography Infographics Solution from the “Infographics” Area is the best Infographic Generator. Make sure in it right now! Typography Infographics Solution offers you the best numerous collection of predesigned infographics examples and 9 libraries with large quantity of ready-to-use vector stencils that will help you design your own Typography Infographics of any complexity in minutes..Pyramid Diagram
ConceptDraw Pyramid Diagram software allows drawing column charts using predesigned objects or drawing tools.Pyramid Charts
ConceptDraw DIAGRAM extended with Pyramid Diagrams Solution from the Marketing Area of ConceptDraw Solution Park is a powerful Pyramid Charts making software. A Pyramid Chart has the form of triangle and hierarchically structures, organizes and help to analyze the information, data or ideas. Triangle is divided on the sections that usually have different widths. The width indicates the level of hierarchy among the topics.
 25 Typical Orgcharts
The 25 Typical Orgcharts solution contains powerful organizational structure and organizational management drawing tools, a variety of professionally designed organization chart and matrix organization structure samples, 25 templates based on various orga
 ATM UML Diagrams
The ATM UML Diagrams solution lets you create ATM solutions and UML examples. Use ConceptDraw DIAGRAM as a UML diagram creator to visualize a banking system.
HVAC Marketing Plan
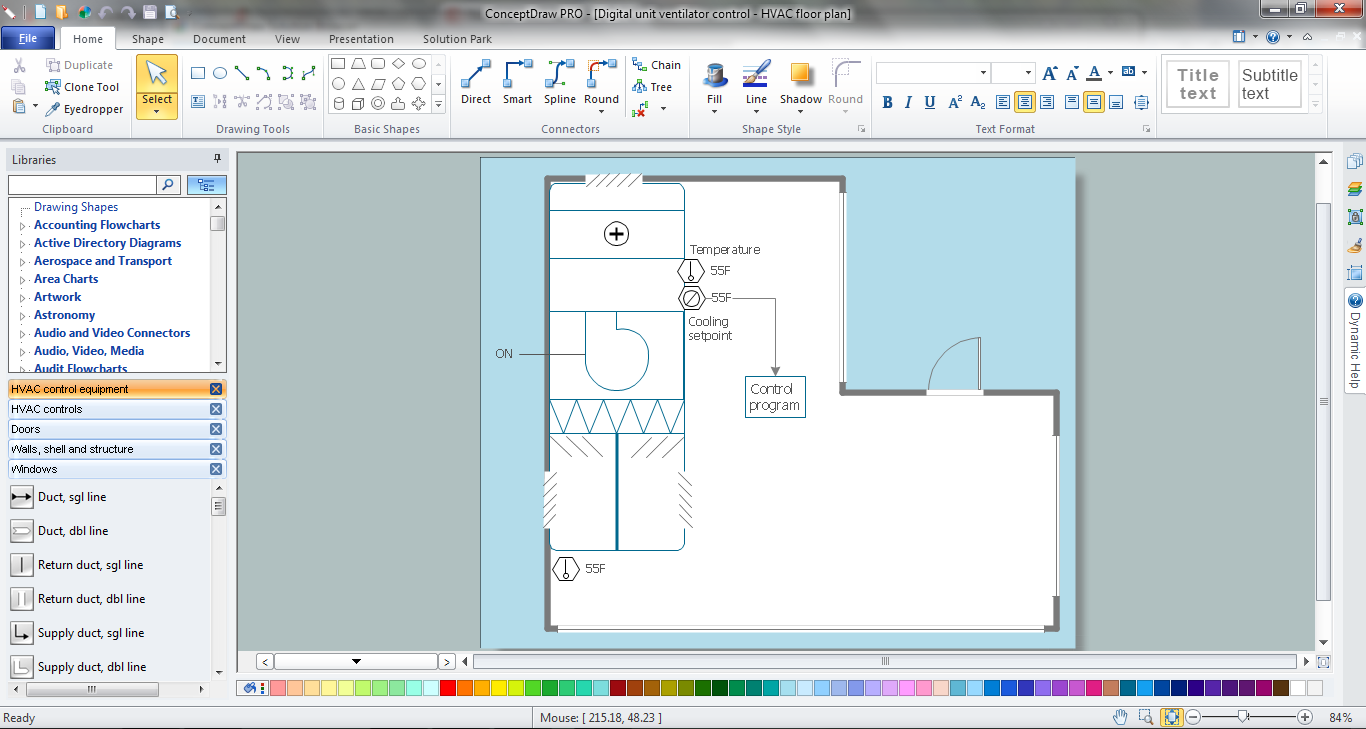
Usually for drawing HVAC plans you need make a lot of efforts and spend a considerable amount of time. ConceptDraw DIAGRAM software will help you radically change this. HVAC Marketing Plan design without efforts? It is reality with HVAC Plans Solution from the Building Plans Area of ConceptDraw DIAGRAM Solution Park.HelpDesk
How to Create an SDL Diagram
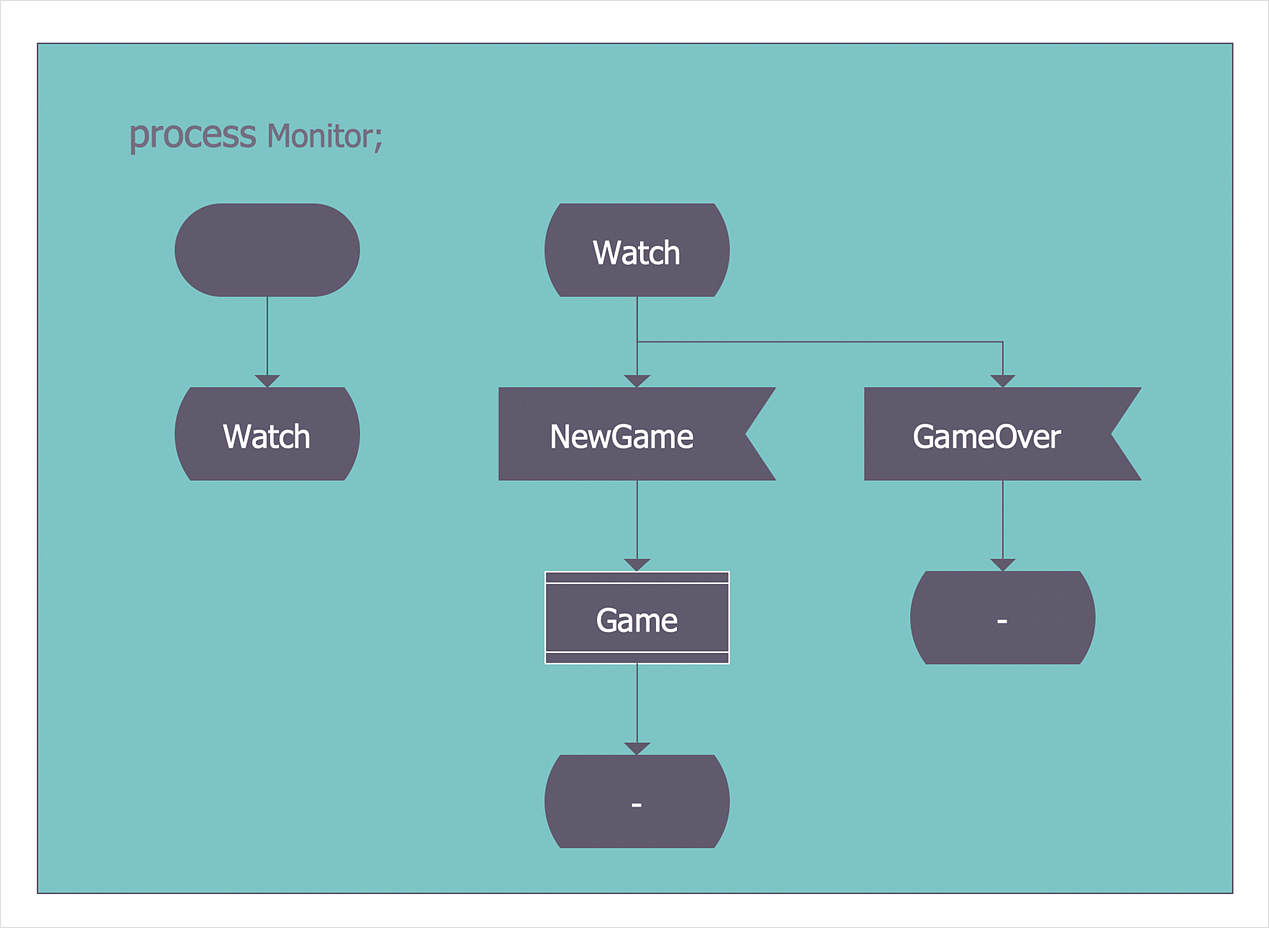
Specification and Description Language (SDL) is intended to describe systems that switched state often and rapidly. An SDL diagram is a view of a system, that can depict a single process or complex relationships between a number of elements. The SDL diagram supports a nested hierarchy. A system is divided into blocks, each of them can be described as a process until finally, one can see the initial procedures that make up each process. The advantage of this method is that a system can be viewed in a manageable part that can be followed separately. ConceptDraw Specification and Description Language solution contains the library, with an SDL notation in a vector stencil graphics. The SDL solution also provides a set of samples, to show the level of hierarchical detail that is possible.Matrix Organization Structure
Matrix organizational structure is one of the main forms of structures which is actively used by organizations to carry forth the functions of a company visually and effectively. Now we have ConceptDraw DIAGRAM diagramming and vector drawing software extended with 25 Typical Orgcharts solution from the Management area of ConceptDraw Solution Park which will help easy represent matrix organizational structure of any degree of complexity.The vector stencils library "HR symbols" contains 45 HR pictograms.
Use this icon set with HR symbols to draw your HR flowcharts, workflow diagrams, process charts and infographics with the ConceptDraw PRO diagramming and vector drawing software.
The HR pictograms library "HR symbols" is included in the HR Flowcharts solution from the Management area of ConceptDraw Solution Park.
HelpDesk
How to Input Data from MS Excel Into a Mind Map
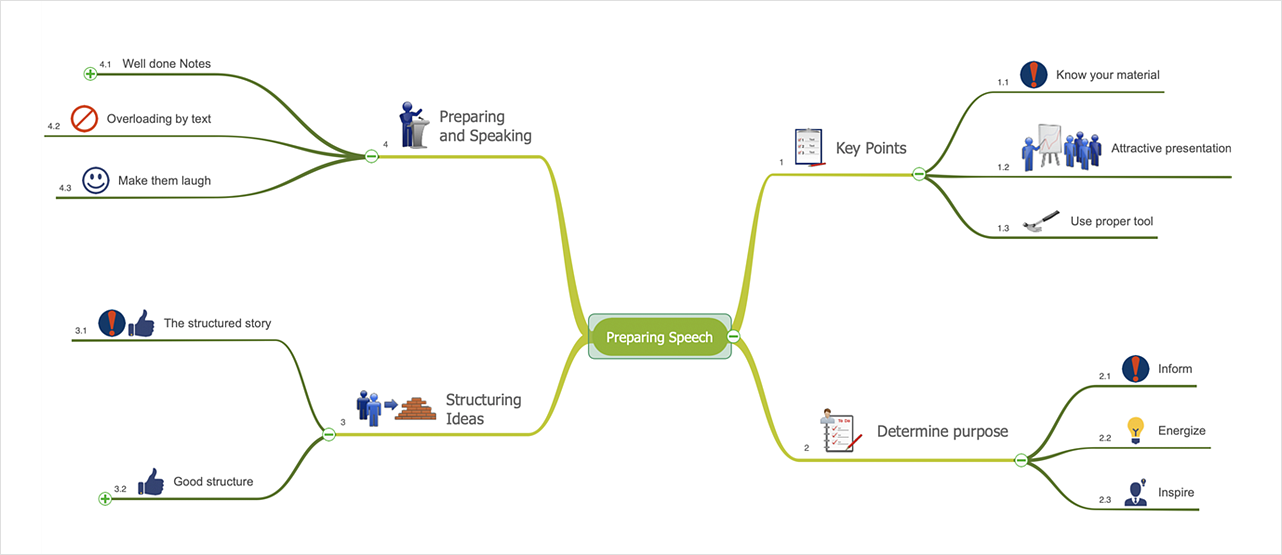
Many people apply Excel documents to store data in the form of hierarchical lists. With ConceptDraw MINDMAP you can easily turn the linear structure of an Excel table in a radial structure of mind map ConceptDraw MINDMAP will create a mind map file (CDMZ) from your Excel (XLS) file. If you keep your information in the Microsoft Excel files, you can import them into ConceptDraw MINDMAP, converting the columns and rows to a hierarchically structured mind map. If you have multiple individual sheets in your Excel workbook, ConceptDraw MINDMAP will turn them into a single multi-page mind map. ConceptDraw MINDMAP lets you import an entire Microsoft® Excel file as well as insert data from the selected cells.HelpDesk
How to Create a Mind Map on Mac
Using visual methods to represent, organize and understand information has long been being a rather popular method. Mind mapping can help people to get knowledge more easily. This can be really helpful in daily life to structure and organize things in a clear way. This article will guide you through creating a mind map, using ConceptDraw MINDMAP software for macOS.Pyramid Diagram and Pyramid Chart
Pyramid Diagram, Triangle Chart or Triangular Diagram is a convenient and useful type of diagrams, which lets represent the data hierarchical structure and to illustrate the foundation-based relationships between the hierarchy levels. Pyramid Diagrams are used to visualize effectively the hierarchical, as well as proportional and foundation-based relationships, the process steps, the interconnections of organizational layers or topics. ConceptDraw DIAGRAM software enhanced with Pyramid Diagrams solution from Marketing area of ConceptDraw Solution Park is a powerful business charting software, that includes all required tools for designing the multilevel Pyramid Diagrams as quickly as possible. The build-in vector stencils and templates are the great aid for designers, a variety of examples and samples is a good base and source of inspiration. Use attractive and vivid 2D and 3D Pyramid Diagrams and Triangle Charts designed in ConceptDraw DIAGRAM to illustrate your documents, presentations, infographics, articles, reports, websites, etc.- Hierarchy of laws | Typography Art | Pyramid Diagram | Png ...
- Social Media Marketing Infographic | Pyramid Diagrams ...
- Hierarchy Examples
- Marketing Plan Infographic | Target and Circular Diagrams | Target ...
- Pyramid Diagram and Pyramid Chart | Marketing plan - Circular ...
- Social strategy - Pyramid diagram | Social Media Marketing ...
- Pyramid Diagram
- Marketing Plan Infographic | HVAC Marketing Plan | Pyramid Charts ...
- Pyramid Chart Examples | SWOT Analysis Tool for Small Business ...
- Competitor Analysis | Marketing Plan Infographic | Pie Donut Chart ...
- Information Graphics | Information Graphic | Winter Sports ...
- Marketing Plan Infographic | Flowchart Example: Flow Chart of ...
- Marketing Plan Infographic | Basketball Court Dimensions | Export ...
- HVAC Marketing Plan | Marketing Plan Infographic | Marketing Flow ...
- HVAC Marketing Plan | Marketing Plan Infographic | SWOT analysis ...
- Calling Infographics
- Marketing Plan Infographic | Flowchart Marketing Process. Flowchart ...
- Marketing Plan Infographic | HVAC Marketing Plan | Marketing Flow ...
- Decision Map Infographic Template
- Marketing Plan Infographic | HVAC Marketing Plan | Marketing plan ...


