HelpDesk
How to Create an IDEF0 Diagram for an Application Development
IDEF0 methods are intended to model the functions of a process, creating a graphical model that displays: what controls the function, who makes it, what resources are used and how they are connected with other functions. The IDEF0 tool is used to model the decisions, actions, and activities of a software system during the development process . IDEF0 diagram graphically depicts a model of a desired version of the application. ConceptDraw PRO allows you to create and communicate the IDEF0 diagrams of any complexity.HelpDesk
How to Design a Mockup of Apple macOS Sierra GUI
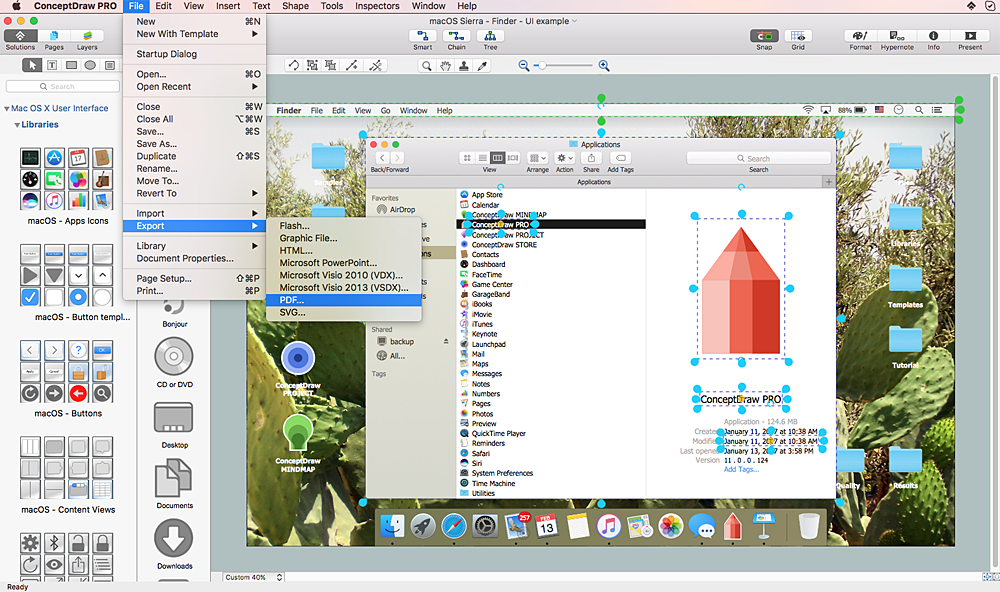
Since that first Macintosh, Apple have always developed and used their own hardware specific operating system. The fundamental style and layout of the Mac OS X user interface has remained largely in place since the earliest versions, but there have been obvious aesthetic enhancements, and elements of icon redesign to match branding across devices. To design an effective user interface, graphic designers will create visual GUI prototypes, that focus on maximizing the user experience. Uses Interface prototyping is much convenient when you can work through a diagram similar to the OS X design. ConceptDraw PRO allows you to develop Apple OS X User Interface (UI) prototypes using the special templates and vector libraries of the specific user interface elements. ConceptDraw Mac OS X UI solution offers libraries containing the distinct Mac app icons, menu bar graphics, glyph elements and other Mac OS X features — everything necessary to create high standard, professional UI graphic desigHelpDesk
How to Create an Audit Flowchart Using ConceptDraw PRO
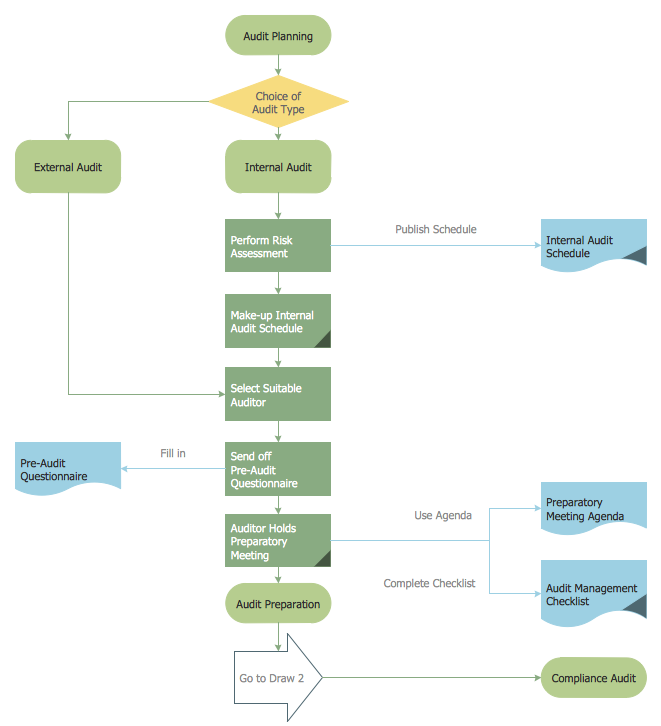
Audit flowcharts are often used in auditors activity. This is the most effective way of preparation and documentation of the audit process. Financial audit process has a clear structure, and therefore audit flowchart is often used to denote an audit process. This is the most effective way of preparation and documentation of the audit process. Flowcharts are often used in auditors activity. A flowchart may be created at any stage of an audit process as an aid in the determination and evaluation of a client's accounting system. ConceptDraw PRO allows you to create professional accounting flowchart quickly using the professional Audit Flowcharts solution.HelpDesk
How to Create an Interactive Voice Response (IVR) Diagram in ConceptDraw PRO
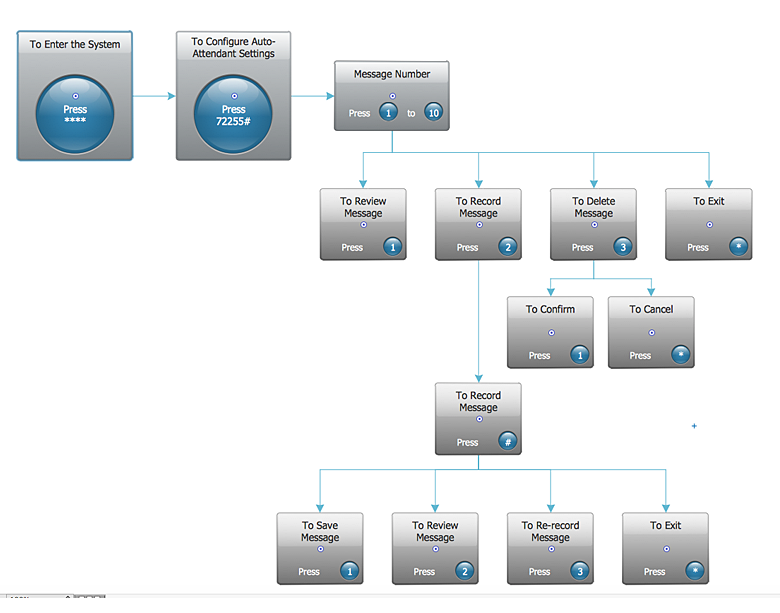
Interactive Voice Response (IVR) Diagram is used to create and conduct the Interactive Voice Response systems for call-centers and voice mail services. IVR diagrams intended to visualize the logical and physical structure of Interactive voice response systems. ConceptDraw solution for Interactive Voice Response (IVR) Diagram allows you to create and communicate the Interactive Voice Response diagram of any complexity. Interactive Voice Response (IVR) System is a telecommunication technology that enables a computer to automatically process voice and touch phone signals. IVR systems allows users to interact through a computer with various service systems, available by telephone. The objective of IVR system is to reduce customer service costs by delivering self service to customers and guiding them to the information that they look for.
 Audit Flowcharts
Audit flowcharts solution extends ConceptDraw PRO software with templates, samples and library of vector stencils for drawing the audit and fiscal flow charts.
HelpDesk
How to Design an Interface Mock-up of an Android Application
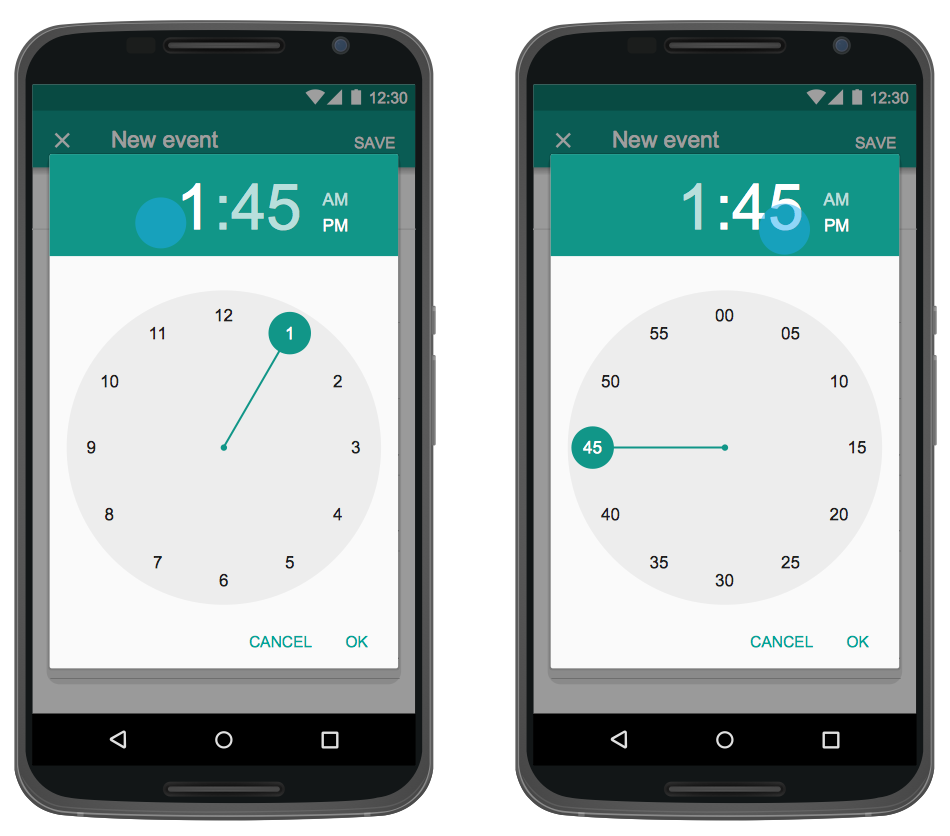
Uses Interface prototyping is much convenient when you can work through a diagram similar to the device design. ConceptDraw PRO allows you to develop Android User Interface (UI) prototypes using the special templates and vector libraries of the specific user interface elements. Using ConceptDraw PRO you can mock-up an Android UI system so that you can figure out how best to represent user interface (UI) elements for the development of a new mobile Apps.LLNL Flow Charts
These flow charts help scientists analysts and other decision makers to visualize the complex interrelationships involved in managing our nation x2019.HelpDesk
How to Create a Bank ATM Use Case Diagram
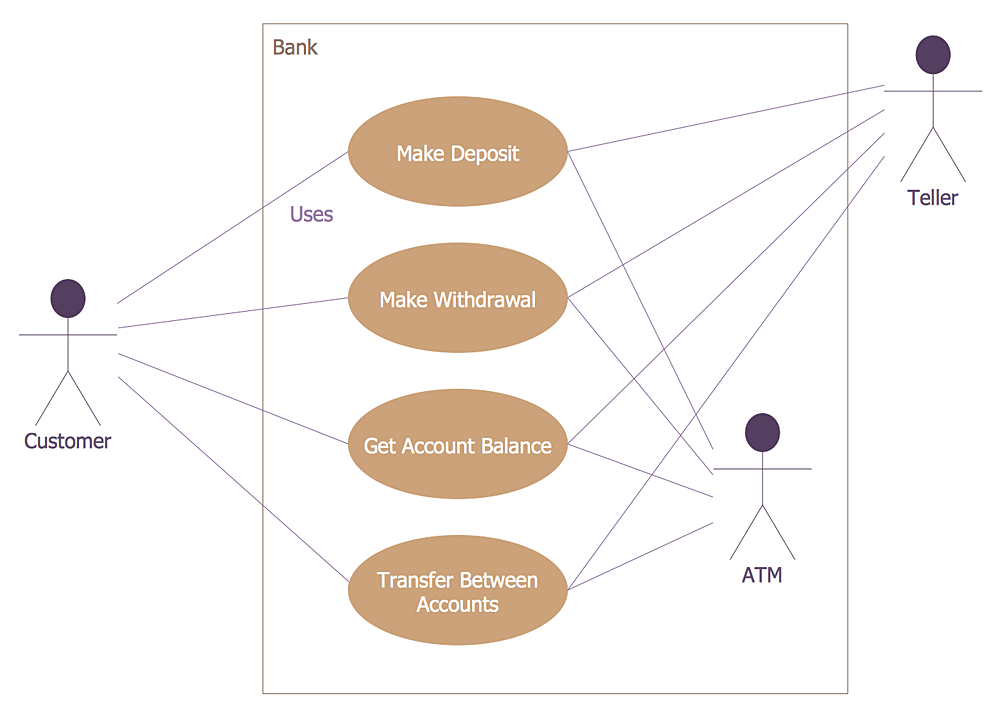
UML diagrams are often used in banking management for documenting a banking system. In particular, the interaction of bank customers with an automated teller machine (ATM) can be represented in a Use Case diagram. Before the software code for an ATM, or any other system design, is written, it is necessary to create a visual representation of any object-oriented processes. This is done most effectively by creating a Unified Modeling Language (UML) diagram, using object-oriented modeling. UML works as a general purpose modeling language for software engineers or system analysts, offering a number of different diagram styles with which to visually depict all aspects of a software system. ConceptDraw PRO diagramming software, enhanced and expanded with the ATM UML Diagrams solution, offers the full range of icons, templates and design elements needed to faithfully represent ATM and banking information system architecture using UML standards. The ATM UML Diagrams solution is useful for beginner and advanced users alike. More experienced users will appreciate a full range of vector stencil libraries and ConceptDraw PRO's powerful software, that allows you to create your ATM UML diagram in a matter of moments.
 Cross-Functional Flowcharts
Cross-functional flowcharts are powerful and useful tool for visualizing and analyzing complex business processes which requires involvement of multiple people, teams or even departments. They let clearly represent a sequence of the process steps, the order of operations, relationships between processes and responsible functional units (such as departments or positions).
HelpDesk
How to Design an Interface Mockup for iPhone Application in ConceptDraw PRO
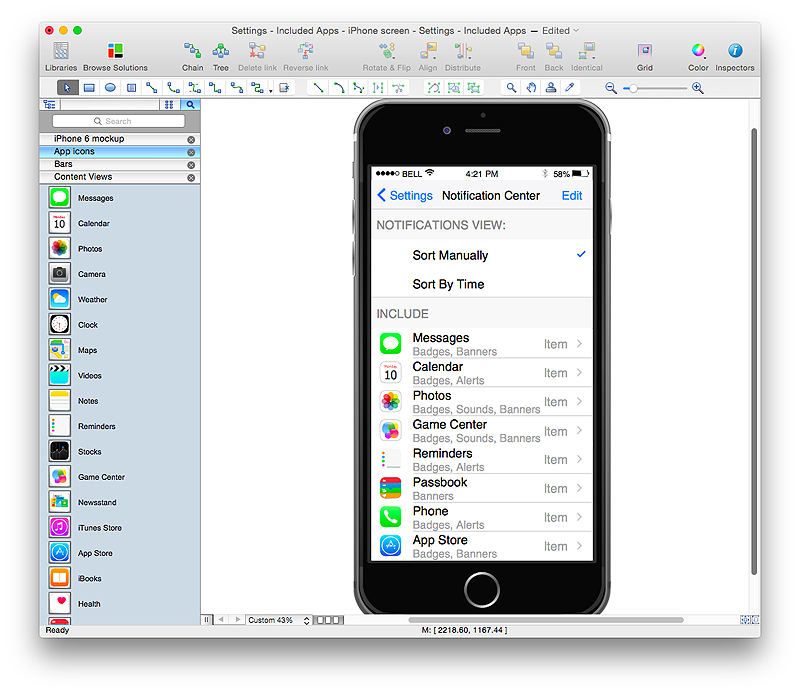
The Apple iPhone user interface has become something of a standard for smartphones, and mobile devices in general. A well designed user interface (UI) is very important for user-friendly navigation and best correlation with operating system logic. Development of successful iPhone App UI requires a planning and prototyping stage. An iPhone UI diagram can be employed to give a general view of the device's screen, upon which elements can be placed and re-arranged as necessary. Using ConceptDraw PRO you can mock-up an iPhone UI system so that you can figure out how best to represent user interface (UI) elements for the development of a new iPhone App.- Software Development Flow Diagram
- Draw Flowcharts with ConceptDraw | Circular Arrows Diagrams ...
- SSADM Diagram | Draw Flowcharts with ConceptDraw | Yourdon ...
- Structured Systems Analysis and Design Method (SSADM) with ...
- Project management life cycle - Flowchart | Basic Diagramming | PM ...
- Program to Make Flow Chart | Good Flow Chart app for Mac ...
- Workflow Diagram | Account Flowchart Stockbridge System ...
- How To Draw Data Flow Diagram
- Flowchart | Basic Flowchart Symbols and Meaning | Contoh ...
- Accounting Flowcharts | How to Create Flowcharts for an Accounting ...
- LLNL Flow Charts | Structured Systems Analysis and Design Method ...
- Process Flowchart | IDEF0 Diagrams | DFD Library System ...
- Draw Flowcharts with ConceptDraw | Use the Best FlowChart Tool ...
- Program to Make Flow Chart | Good Flow Chart app for Mac | Use ...
- Process Flowchart | Sales Process Flowchart . Flowchart Examples ...
- Software development with ConceptDraw Products | Venn diagram ...
- Basic Diagramming | Collaboration in a Project Team | SSADM ...
- Accounting Flowcharts | Purchase Process Flow Chart . Accounting ...
- Process Flowchart | Venn diagram - Path to sustainable ...
- Good Flow Chart app for Mac | Marketing Diagrams | Circular arrows ...

.jpg)
