HelpDesk
How to Create an Entity-Relationship Diagram
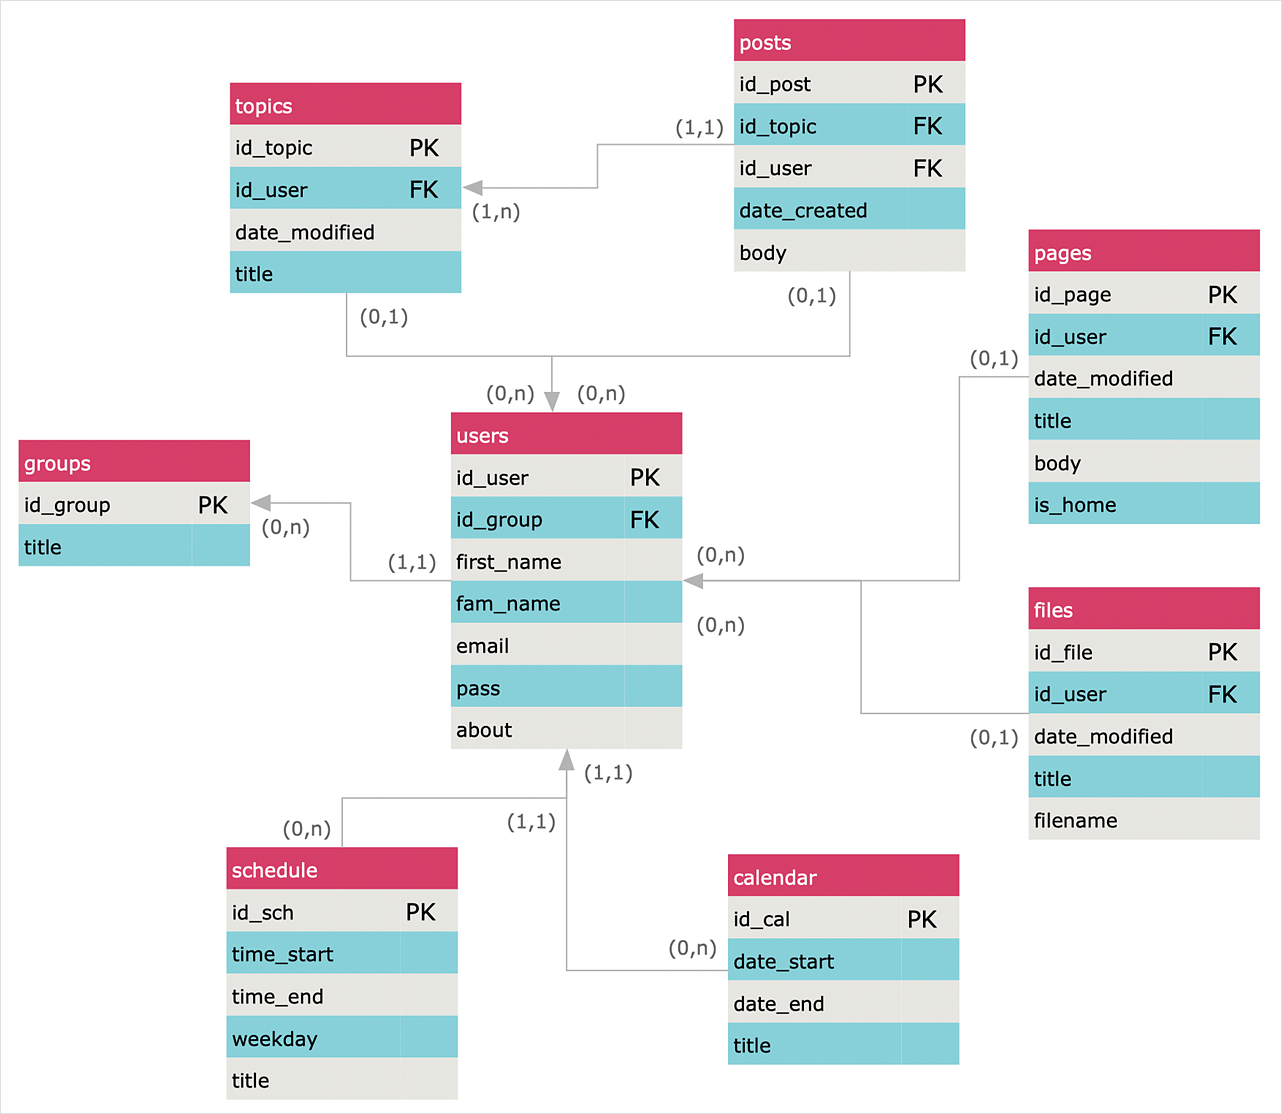
ERD (entity relationship diagram) is used to show the logical structure of databases. It represents the interrelationships between components of a database (entities). Entity relationship diagrams are widely used in software engineering. Using ERD software engineers can control every aspect of database development. ER diagram can be used as the guide for testing and communicating before the release of a software product. ERD displays data as entities that are connected with connections that show the relationships between entities. There are some ERD notations used by databases developers for representing the relationships between the data objects. ConceptDraw DIAGRAM and its ERD solution allow you to build ERD diagram of any notation.HelpDesk
How to Create an Entity-Relationship Diagram Using ERD Solution
An entity-relationship diagram (ERD)is used in a database modeling process. ERD diagram shows a graphical representation of objects or concepts within an information system and their relationships. The ability to describe a database using the Entity-Relationship model is delivered by the ConceptDraw ERD solution.The vector stencils library "Audit flowcharts" contains 31 flow chart symbols.
Use it in accounting, financial management, fiscal information tracking, money management, decision making, and financial inventories to create auditing flowchart diagrams in the ConceptDraw PRO diagramming and vector drawing software extended with the Audit Flowcharts solution from the Finance and Accounting area of ConceptDraw Solution Park.
www.conceptdraw.com/ solution-park/ finance-audit-flowcharts
Data structure diagram with ConceptDraw DIAGRAM
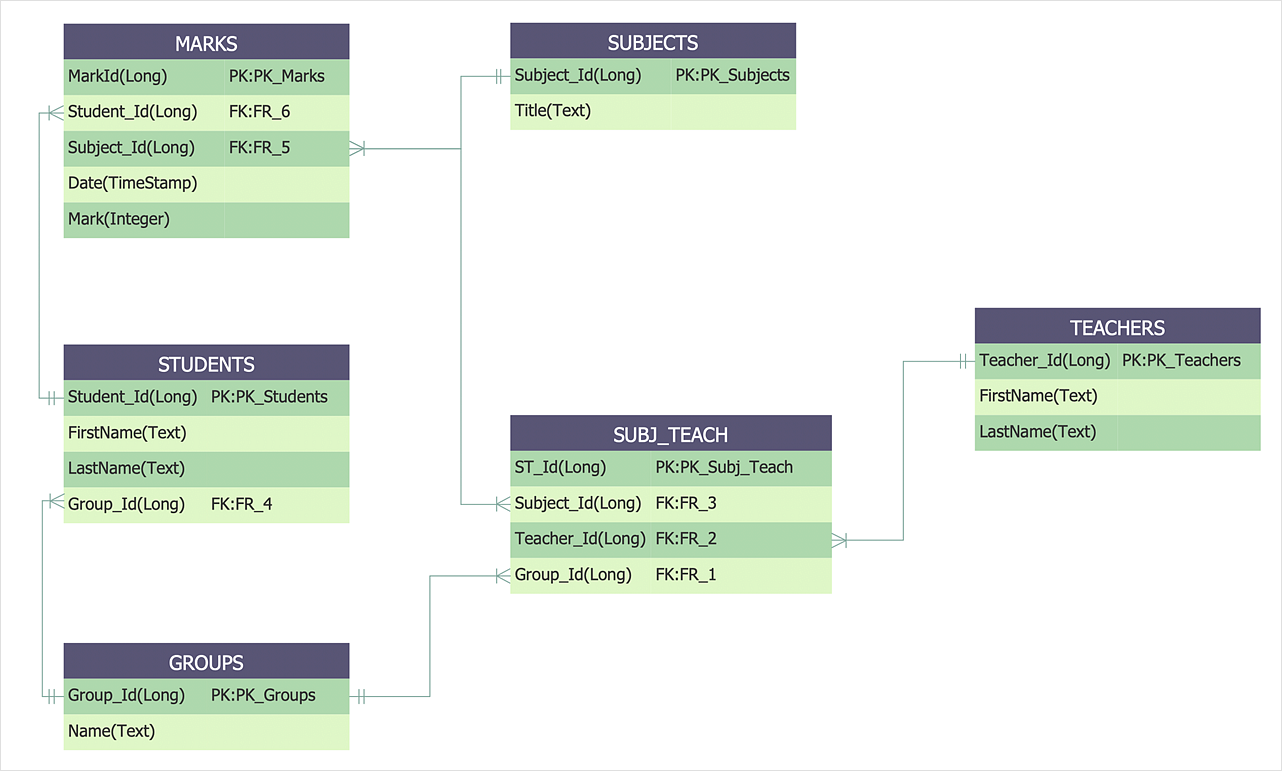
Data structure diagram (DSD) is intended for description of conceptual models of data (concepts and connections between them) in the graphic format for more obviousness. Data structure diagram includes entities description, connections between them and obligatory conditions and requirements which connect them. Create Data structure diagram with ConceptDraw DIAGRAM.Software development with ConceptDraw DIAGRAM
Modern software development requires creation of large amount of graphic documentation, these are the diagrams describing the work of applications in various notations and cuts, also GUI design and documentation on project management. ConceptDraw DIAGRAM technical and business graphics application possesses powerful tools for software development and designing technical documentation for object-oriented projects. Solutions included to the Software Development area of ConceptDraw Solution Park provide the specialists with possibility easily and quickly create graphic documentation. They deliver effective help in drawing thanks to the included package of templates, samples, examples, and libraries with numerous ready-to-use vector objects that allow easily design class hierarchies, object hierarchies, visual object-oriented designs, flowcharts, GUI designs, database designs, visualize the data with use of the most popular notations, including the UML and Booch notations, easy manage the development projects, automate projection and development.
 Entity-Relationship Diagram (ERD)
Entity-Relationship Diagram (ERD) solution extends ConceptDraw DIAGRAM software with templates, samples and libraries of vector stencils from drawing the ER-diagrams by Chen's and crow’s foot notations.
ConceptDraw DIAGRAM Database Modeling Software
ConceptDraw DIAGRAM is a very easy-to-use and intuitive database design tool which can save you hundreds of work hours. See database diagram samples created with ConceptDraw DIAGRAM database modeling database diagram software.- Database Flowchart Symbols | Basic Flowchart Symbols and ...
- Basic Flowchart Symbols and Meaning | Flowchart design ...
- Process Flowchart | Software and Database Design with ...
- Create Database Flowchart
- Visio Files and ConceptDraw | Process Flowchart | Data Flow ...
- Software and Database Design with ConceptDraw PRO | Process ...
- Basic Flowchart Symbols and Meaning | Flow Chart Symbols ...
- Data flow diagram template
- Best Flowchart Software | Flow Chart Creator | How to Create ...
- Entity Relationship Diagram Symbols and Meaning ERD Symbols ...
- Basic Flowchart Symbols and Meaning | Database Flowchart ...
- Top 5 Android Flow Chart Apps | Flowchart Programming Project ...
- Software and Database Design with ConceptDraw PRO | Process ...
- Data Flow Diagram | Process Flowchart | Types of Flowchart ...
- Software and Database Design with ConceptDraw PRO | Examples ...
- Process Flowchart | Create Flow Chart on Mac | Flowchart Software ...
- Cross-Functional Flowcharts | How to Create a Cross - Functional ...
- Database Flowchart Symbols | Data Flow Diagram Symbols. DFD ...
- Symbols In Database Design


-audit-flowcharts---vector-stencils-library.png--diagram-flowchart-example.png)


-audit-flowcharts---vector-stencils-library.png--diagram-flowchart-example.png)


-audit-flowcharts---vector-stencils-library.png--diagram-flowchart-example.png)


-audit-flowcharts---vector-stencils-library.png--diagram-flowchart-example.png)


