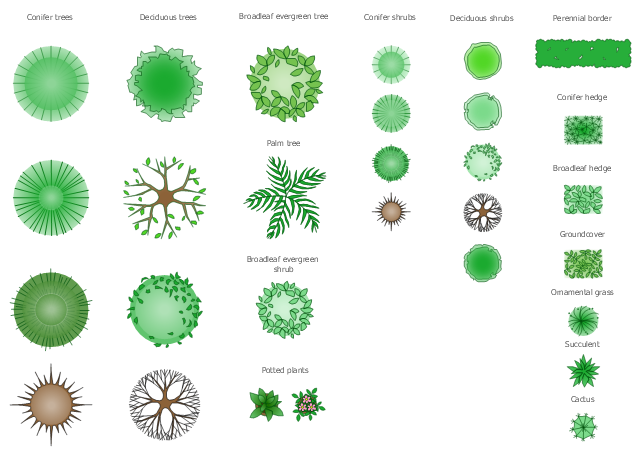
The design elements library Trees and plants contains 29 symbols of trees, hedges, groundcovers, greenery, and shrubbery.
"Landscape design is an independent profession and a design and art tradition, practised by landscape designers, combining nature and culture. In contemporary practice landscape design bridges between landscape architecture and garden design.
Landscape design focuses on both the integrated master landscape planning of a property and the specific garden design of landscape elements and plants within it." [Landscape design. Wikipedia]
Use the vector stencils library Trees and plants to draw the plans of landscape architecture, lawns, gardens, yards, parks planning, groundskeeping, landscape design, and arboretums using the ConceptDraw PRO diagramming and vector drawing software.
The shapes library Trees and plants is contained in the Site Plans solution from the Building Plans area of ConceptDraw PRO Solution Park.
HelpDesk
How to Create a Fault Tree Analysis Diagram (FTD) in ConceptDraw PRO
Fault Tree Diagram are logic diagram that shows the state of an entire system in a relationship of the conditions of its elements. Fault Tree Diagram are used to analyze the probability of functional system failures and safety accidents. ConceptDraw PRO allows you to create professional Fault Tree Diagrams using the basic FTD symbols. An FTD visualize a model of the processes within a system that can lead to the unlikely event. A fault tree diagrams are created using standard logic symbols . The basic elements in a fault tree diagram are gates and events.
 Landscape & Garden
The Landscape and Gardens solution for ConceptDraw PRO v10 is the ideal drawing tool when creating landscape plans. Any gardener wondering how to design a garden can find the most effective way with Landscape and Gardens solution.
HelpDesk
How To Create Root Cause Analysis Diagram Using ConceptDraw Office
Root Cause Analysis (RCA) is used to determine the main causes of the problem. If the certain factor is the root cause, this mean that its vanishing will help to prevent the further recurrence of the problem. Root Cause Analysis diagram is used to analyze the root causes of factors that influence the problem. It helps to identify the root causes for a factor and then propose possible corrective actions. A diagram is constructed separately for each high priority factor. The ability to create a RCA tree diagram from a mind map is supported by the ConceptDraw Seven Management and Planning Tools solution.
 Site Plans
Vivid and enticing plan is the starting point in landscape design and site plan design, it reflects the main design idea and gives instantly a vision of the end result after implementation of this plan. Moreover site plan, architectural plan, detailed engineering documents and landscape sketches are obligatory when designing large projects of single and multi-floor buildings.
 ConceptDraw Solution Park
ConceptDraw Solution Park collects graphic extensions, examples and learning materials
 Fault Tree Analysis Diagrams
This solution extends ConceptDraw PRO v9.5 or later with templates, fault tree analysis example, samples and a library of vector design elements for drawing FTA diagrams (or negative analytical trees), cause and effect diagrams and fault tree diagrams.
HelpDesk
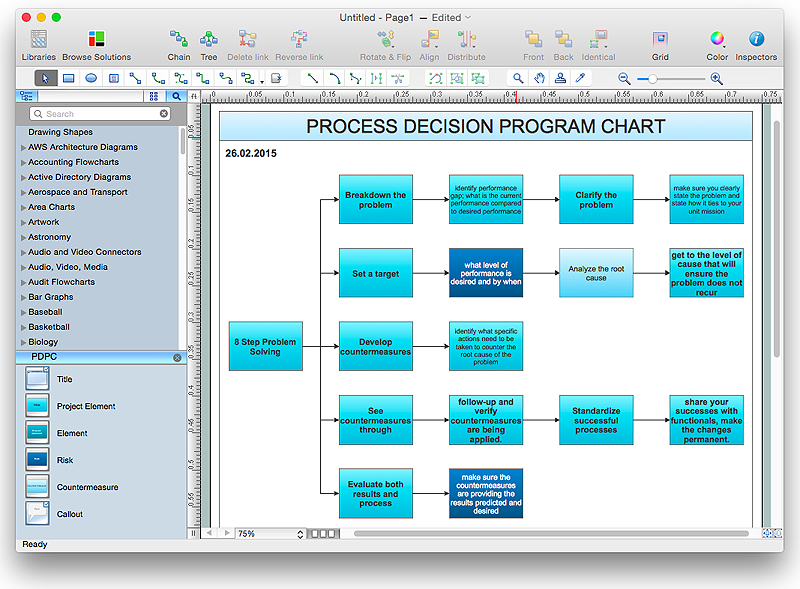
How To Create Risk Diagram (PDPC)
Article on how to identify possible risks when carrying out corrective actions, and define preventive actions
 Sport Field Plans
Construction of sport complex, playgrounds, sport school, sport grounds and fields assumes creation clear plans, layouts, or sketches. In many cases you need represent on the plan multitude of details, including dimensions, placement of bleachers, lighting, considering important sport aspects and other special things.
 Plant Layout Plans
This solution extends ConceptDraw PRO v.9.5 plant layout software (or later) with process plant layout and piping design samples, templates and libraries of vector stencils for drawing Plant Layout plans. Use it to develop plant layouts, power plant desig
 Universal Diagramming Area
This area collects solutions for drawing diagrams, charts, graphs, matrices, geographic and road maps for education, science, engineering, business.
 ATM UML Diagrams
The ATM UML Diagrams solution lets you create ATM solutions and UML examples. Use ConceptDraw PRO as a UML diagram creator to visualize a banking system.
- Design elements - Trees and plants | Landscape Design Palm Tree ...
- Design elements - Parking and roads | Building Drawing Software ...
- Design elements - Trees and plants | Design elements - Site ...
- New Year card template - Christmas Winter Landscape | How To ...
- Landscape architecture with ConceptDraw PRO | Design elements ...
- Design elements - Trees and plants | How To use Landscape ...
- Landscape architecture with ConceptDraw PRO | How To use ...
- How To Draw Nature Landscapes For Art And Designs
- Bubble diagrams in Landscape Design with ConceptDraw PRO ...
- Bubble diagrams in Landscape Design with ConceptDraw PRO ...
- How to Design a Garden Using ConceptDraw PRO | Landscape ...
- Architecture Trees Landscape Elements
- How To use Landscape Design Software | Building Drawing ...
- Vector clipart - Professions | When I grow up... | Design elements ...
- Building Drawing Design Element: Storage and Distribution | Interior ...
- How To use Landscape Design Software | Bubble diagrams in ...
- Landscape architecture with ConceptDraw PRO | Design elements ...
- Plant Layout Plans | Design elements - Trees and plants | Building ...
- Bubble diagrams in Landscape Design with ConceptDraw PRO ...
- Landscape architecture with ConceptDraw PRO | Bubble diagrams ...


