Examples of Flowcharts, Org Charts and More
ConceptDraw DIAGRAM covers a broad spectrum of business graphics categories and offers at ConceptDraw STORE enormous online collection of pictorial examples and samples for different thematics and application areas. It is a plentiful source of inspiration and wonderful examples of professionally designed diagrams, flowcharts, UML diagrams, organizational charts, databases, ERDs, network diagrams, business charts, different thematic charts, schematics, infographics and plans developed specially for knowledge workers, engineers, managers, businessmen, marketing specialists, analytics, scientists, students, professors, journalists and also for a large number of other people that every day use various diagrams and drawings in their work and life activity. Each of these examples is a real art, all they are well thought-out and designed without efforts with help of powerful tools of ConceptDraw DIAGRAM software. ConceptDraw examples display all variety of tasks, possibilities and results that ConceptDraw Product Line lets achieve fast and easy. ConceptDraw is one of the best Visio alternatives for Mac. It open all Visio formats like.vsdx,.vss,.vdx files and allows you to export files to Visio formats.
HelpDesk
How to Draw a Gantt Chart
A Gantt chart is intended to provide a visualization of a project schedule. It is developed to help planning, coordinating, and tracking on project tasks implementation. One of the most critical resources for project implementation are time resources. Gantt chart - is one of the most convenient and popular ways of graphical representation of a project tasks progress in conjunction with the corresponding time consumption. Gantt chart's function is to show project tasks completed in progress and to make a project manager sure that project tasks were completed on time. ConceptDraw Office is a clear and easy-to-use tool for project management. It is a very handy visual tool that helps make a project processing clear.HelpDesk
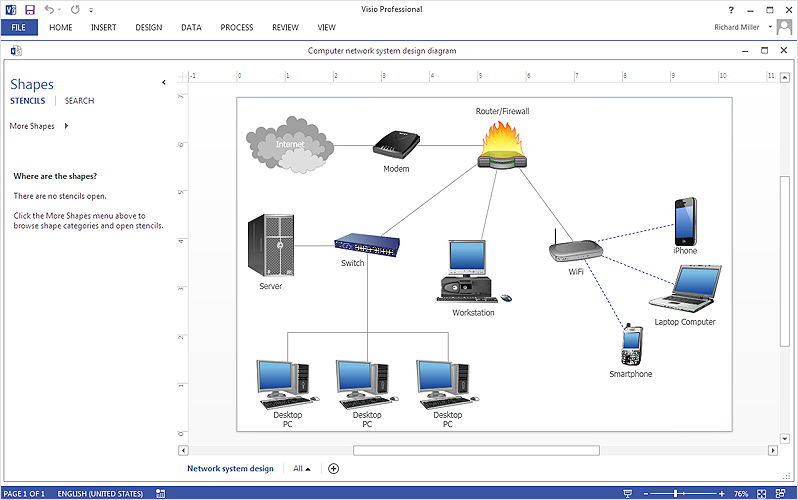
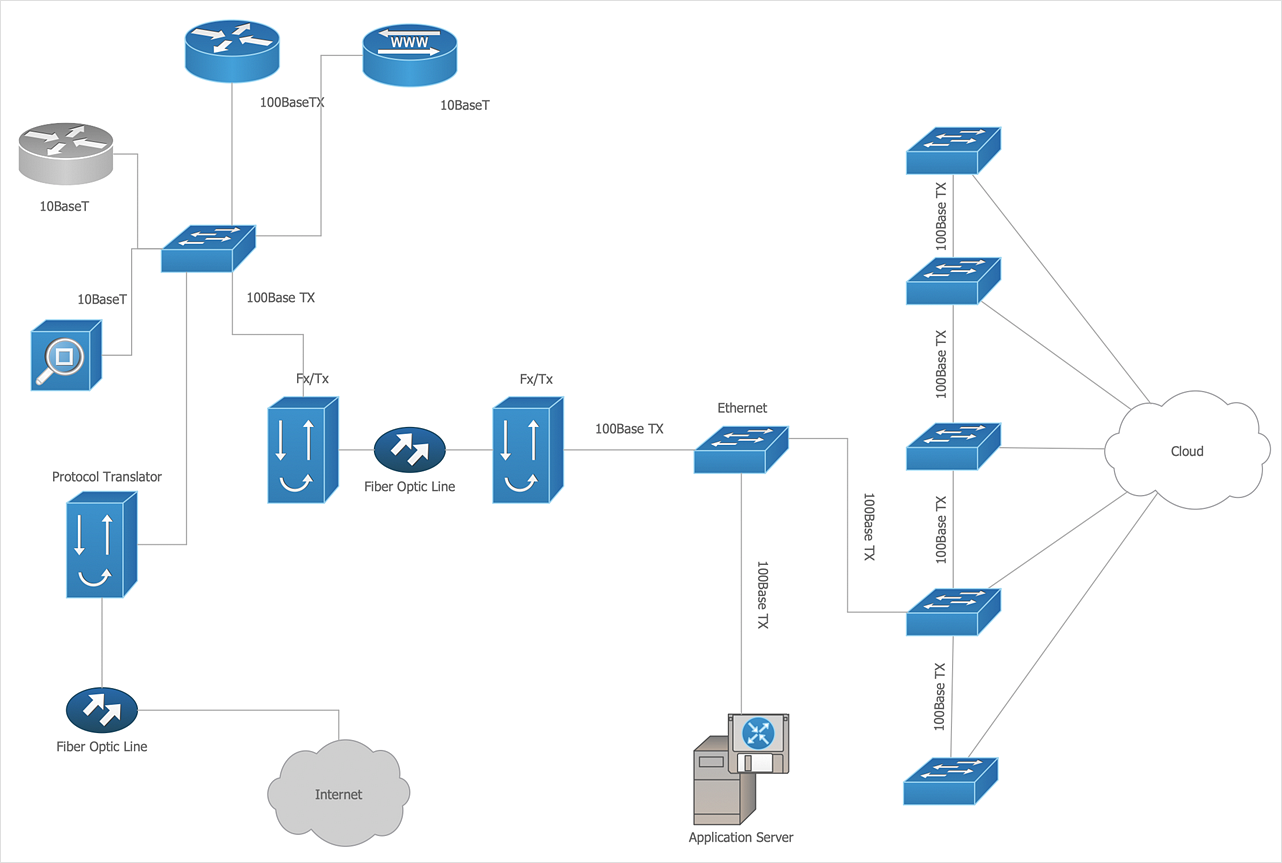
How To Create Visio Network Diagram
IT professionals are accustomed to using MS Visio for their network diagrams. Nevertheless, ConceptDraw DIAGRAM also powers, and in some cases and more feature-rich product. Given the fact that many professional people committed to MS Visio, ConceptDraw DIAGRAM developers provided users with the opportunity to share their diagrams with MS Visio users. You can use the export to VSDX and VSD format. By exporting your network diagram to MS Visio, you can easily solve the issues in communication with the users of this widespread software product.HelpDesk
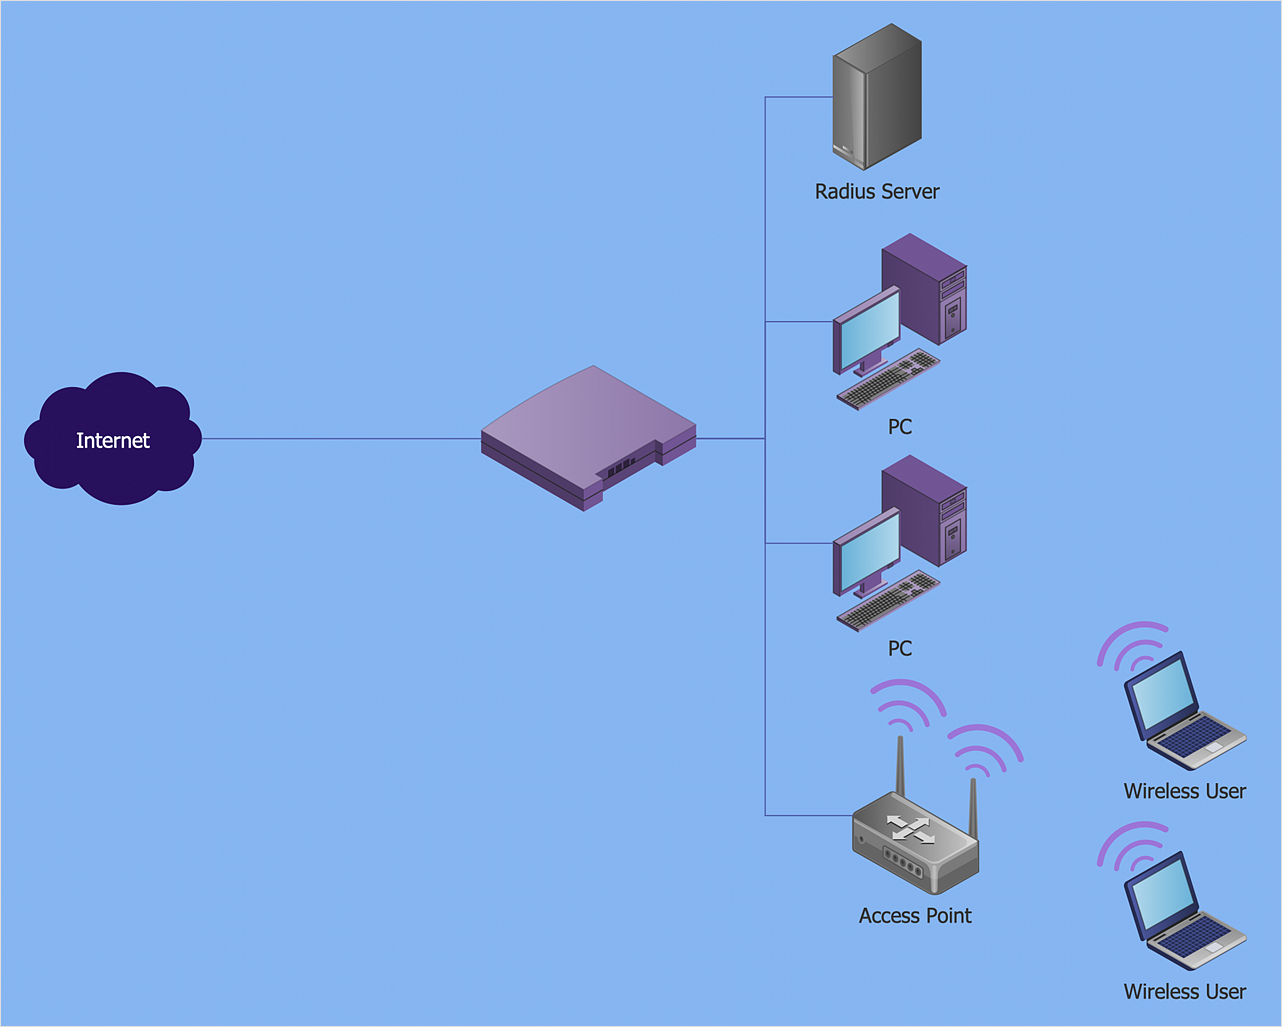
How to Create a Wireless Network Diagram Using ConceptDraw Solutions
A wireless network diagram is a specialized type of computer network diagrams. Wireless Network diagrams are used to develop, operate and maintain the WLAN systems. Making a Wireless Network diagram involves many different elements that can be managed using ConceptDraw DIAGRAM. With ConceptDraw DIAGRAM you can easily create and communicate the Wireless Network diagram of any complexity.HelpDesk
How to Create a Timeline Diagram
A Timeline is a chart which displays a project plan schedule in chronological order. A Timeline is used in project management to depict project milestones and visualize project phases and show project progress. The graphic form of a timeline makes it easy to understand critical project milestones, such as the progress of a project schedule. Timelines are particularly useful for project scheduling or project management when accompanied with a Gantt chart. It captures the main of what the project will accomplish and how it will be done. making a project timeline is one of the most important skills a project manager needs have. Making comprehensive, accurate timelines allows you getting every project off in the best way. ConceptDraw DIAGRAM allows you to draw a timeline chart using a special library.HelpDesk
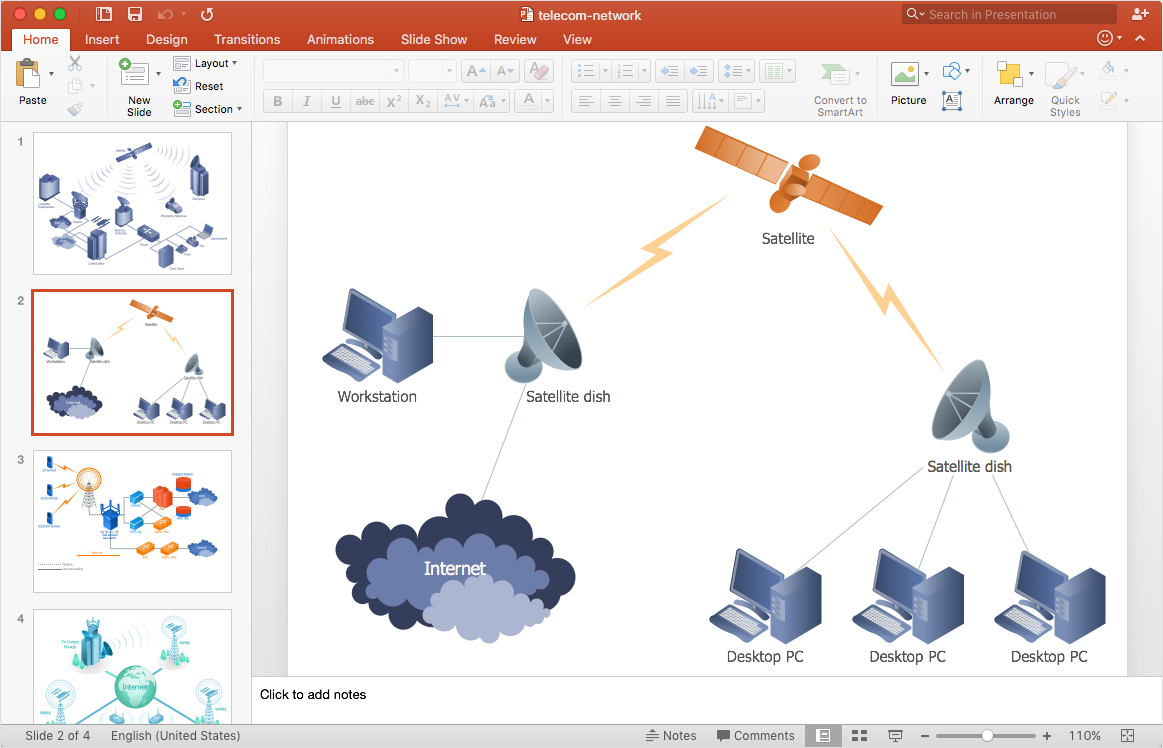
How to Add a Telecommunication Network Diagram to a PowerPoint Presentation
Telecommunication network diagram represents a system consisting of computers, servers, telecommunication devices, switches, satellites, wireless transmitters, antennas, cables, etc., that link a set of remote nodes. It also describes a telephone exchange, that connects calls between landlines. ConceptDraw DIAGRAM allows you to easily create telecommunication network diagrams and then make a PowerPoint Presentation from your network documentation in a few clicks. Telecommunication network diagrams are used to show components and connections in a telecommunications network: how they are interacted between each other and with end-users. The PowerPoint presentation on a conception of telecom network can be very informative and helpful. ConceptDraw DIAGRAM allows you to make an MS PowerPoint Presentation from your telecommunication network diagrams in a few clicks.HelpDesk
How to Create Project Diagrams on Mac
Diagrams are very useful for project implementation because they help teams visualize important details such as interrelations between tasks, critical paths, timelines, milestones, calendars, and also resource usage.HelpDesk
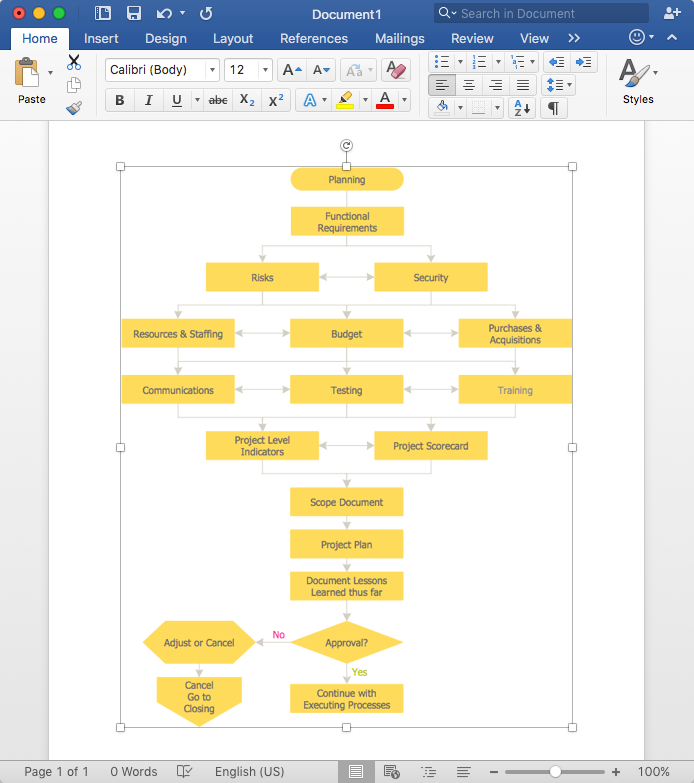
How to Add a Flowchart to MS Word Document
ConceptDraw DIAGRAM allows you to easily create flowcharts and then insert them into a MS Word document.HelpDesk
How to Create Flowchart Using Standard Flowchart Symbols
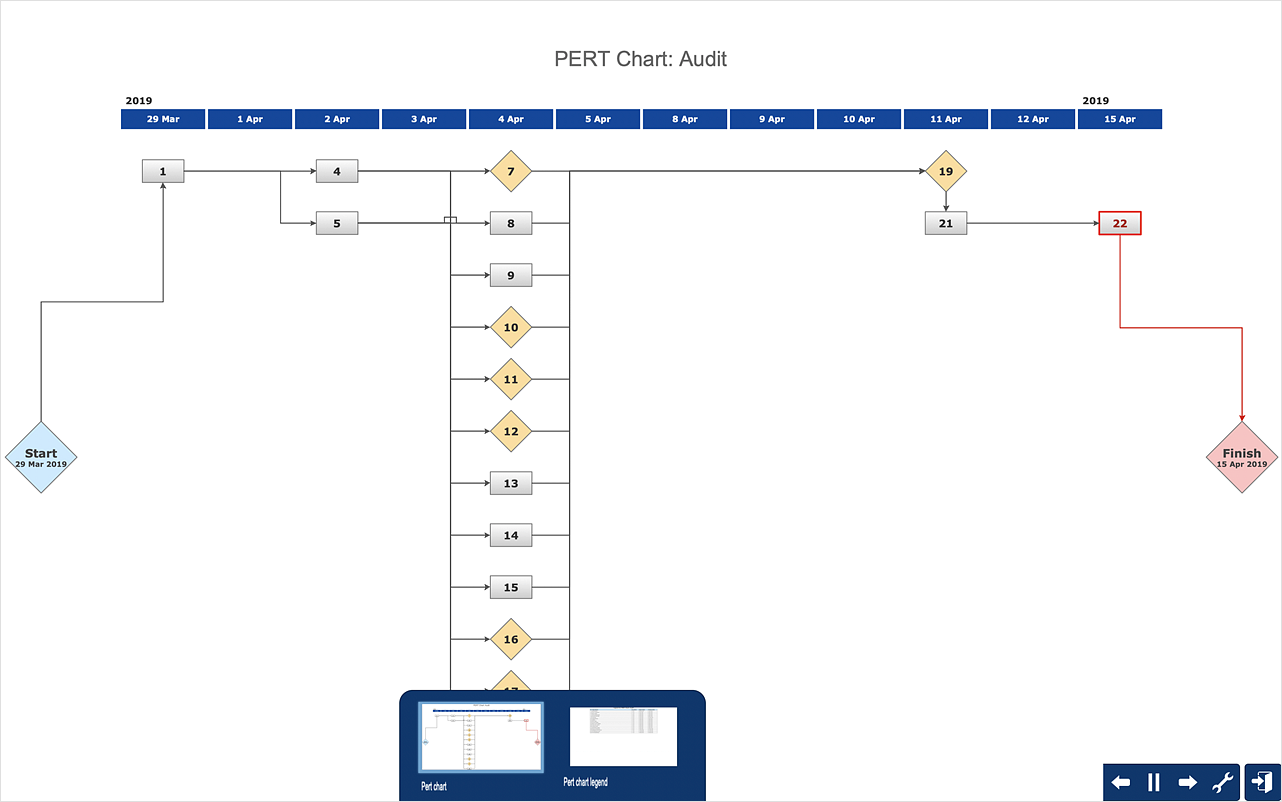
Flowcharts are used to display an algorithm for consistent execution of certain steps. Flowchart is probably the easiest way to make a graphical representation of any process. Flowcharts use the set of standard geometric symbols and arrows to define relationships. ConceptDraw DIAGRAM allows you to create professional flowchart quickly and easily. The ability to create flowcharts is contained in the Flowcharts solution. The solution provides a set of special tools for creating flowcharts.Activity on Node Network Diagramming Tool
Activity on Node Network Diagramming Tool — Activity Network and Project Evaluation and Review Technique, or PERT, charts are a way of documenting and analyzing the tasks in a project. This sample shows the Activity on node network diagramming method. It was created in ConceptDraw DIAGRAM diagramming and vector drawing software using the Seven Management and Planning Tools solution from the Management area of ConceptDraw Solution Park.HelpDesk
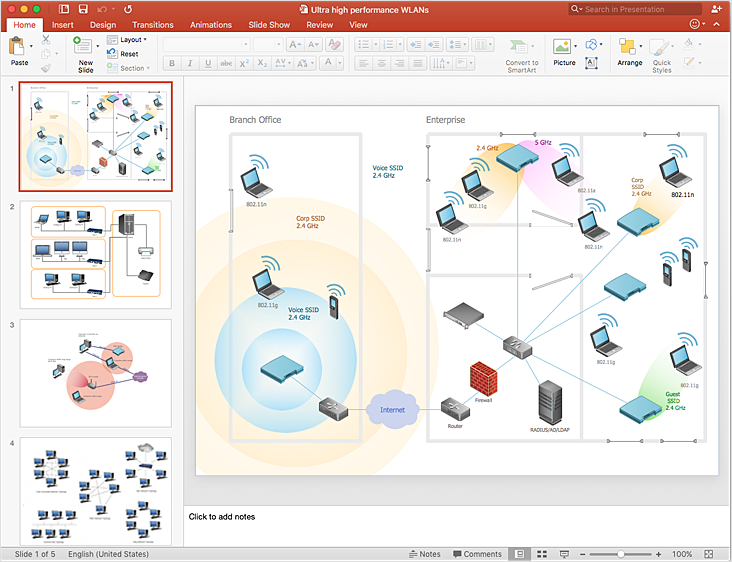
How to Add a Wireless Network Diagram to a PowerPoint Presentation
The PowerPoint presentation of the wireless network can be very informative. ConceptDraw DIAGRAM allows you to easily create wireless network diagrams and then make a PowerPoint Presentation from your diagrams in a single click.HelpDesk
How to Create Cisco Network Diagram
The easiest way to design Cisco Network diagram using standard Cisco product symbols is using ConceptDraw DIAGRAM powered by Cisco Network Diagrams solution. The Cisco Network Diagrams solution uses Cisco network symbols to visually document the topology and design of Cisco networks. Use a Cisco Network diagram to display the topology of a Cisco network. A diagram clearly depicting servers, computers, routers, and other parts of your network help to easily manage and control the network and the services it uses.HelpDesk
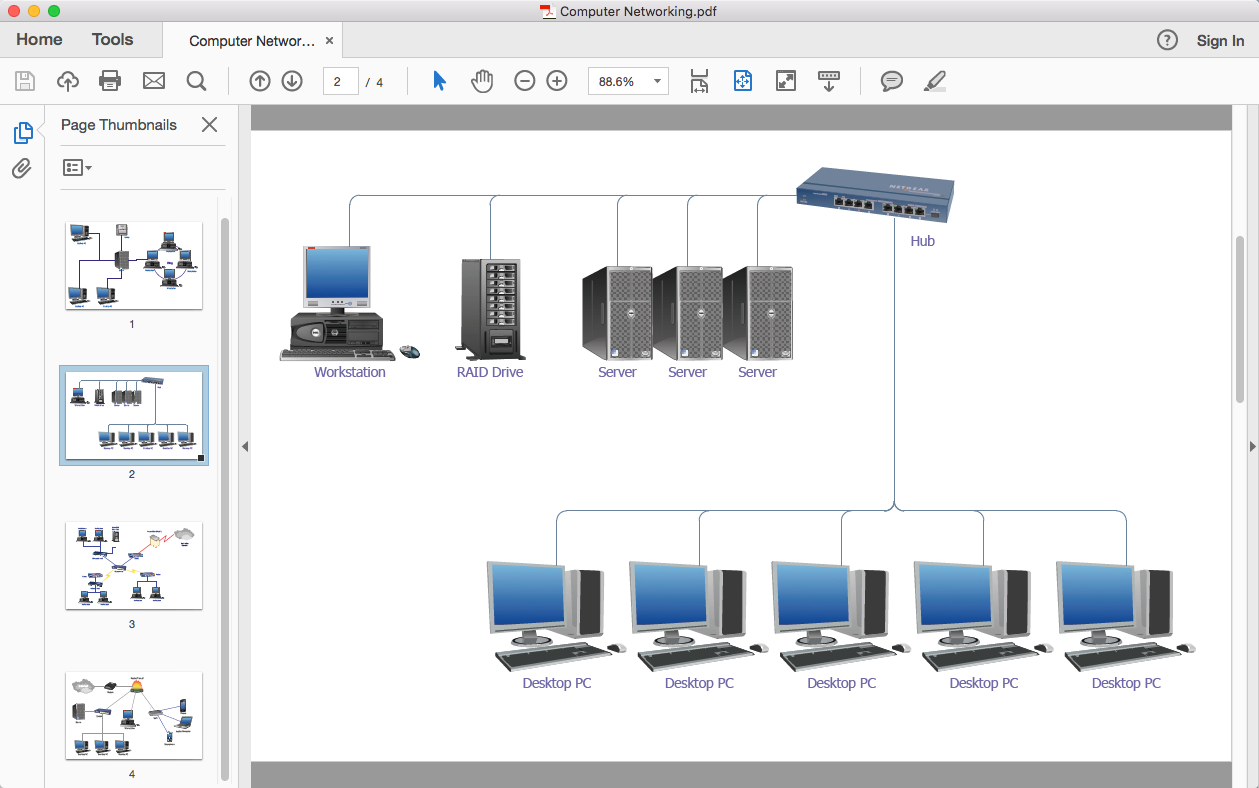
How To Convert a Computer Network Diagram to Adobe PDF
ConceptDraw DIAGRAM allows you to easy transmit your network documentation between different computers with different operating systems and applications using its export capabilities. You can get clear network documentation pack in pdf format and avoid any problems while communicating it with stakeholders.HelpDesk
How to Import MS Project File to a Mind Map Using the Project Exchange Solution
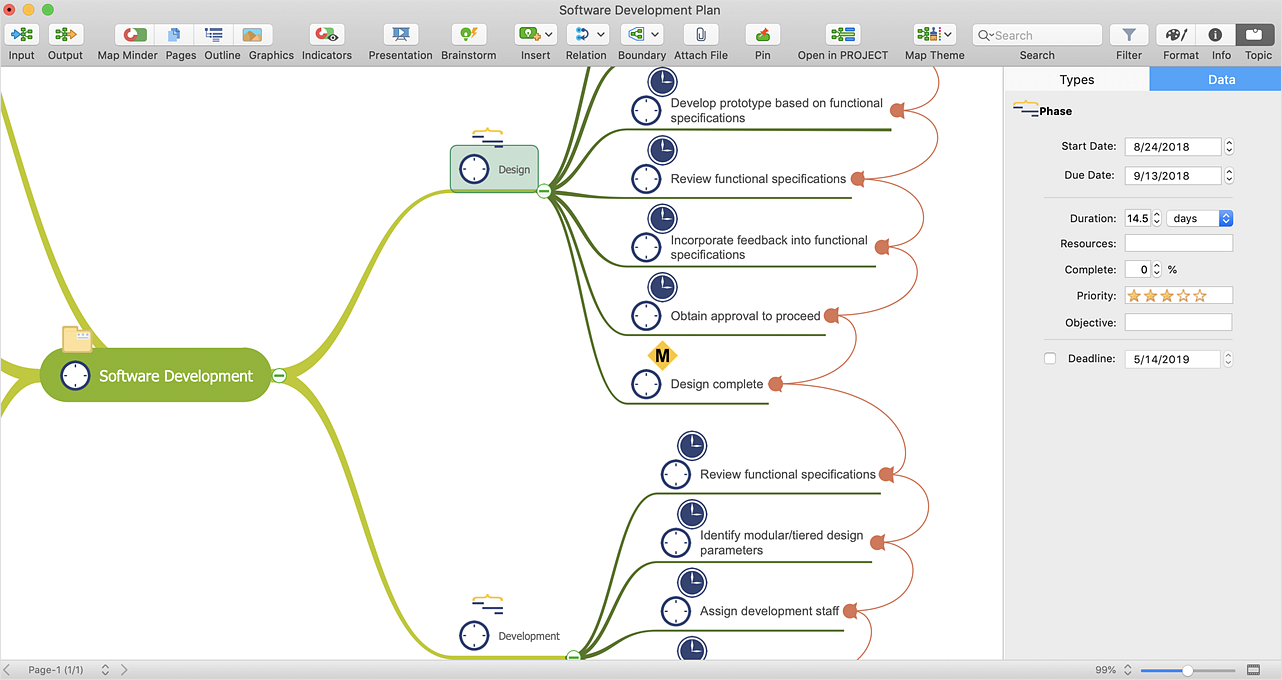
ConceptDraw MINDMAP can export a mind map to MS Project; it can also import a project file from MS Project, making a working visual map of a planned project. ConceptDraw MINDMAP supports inputting external data into a map with one click. Input capabilities are critical because it makes your data visual. When your data is visual, you can manage and communicate it using newly generated documents and/or presentations. Data you can input into your map can come from just about anywhere. Data can come from Microsoft Word, Excel, Outlook, Project, the web, a mind map, and other electronic sources. You can input data as a task list, resource list, Gantt chart, brainstorm or search results.HelpDesk
How to Publish Project Reports to a Web Site
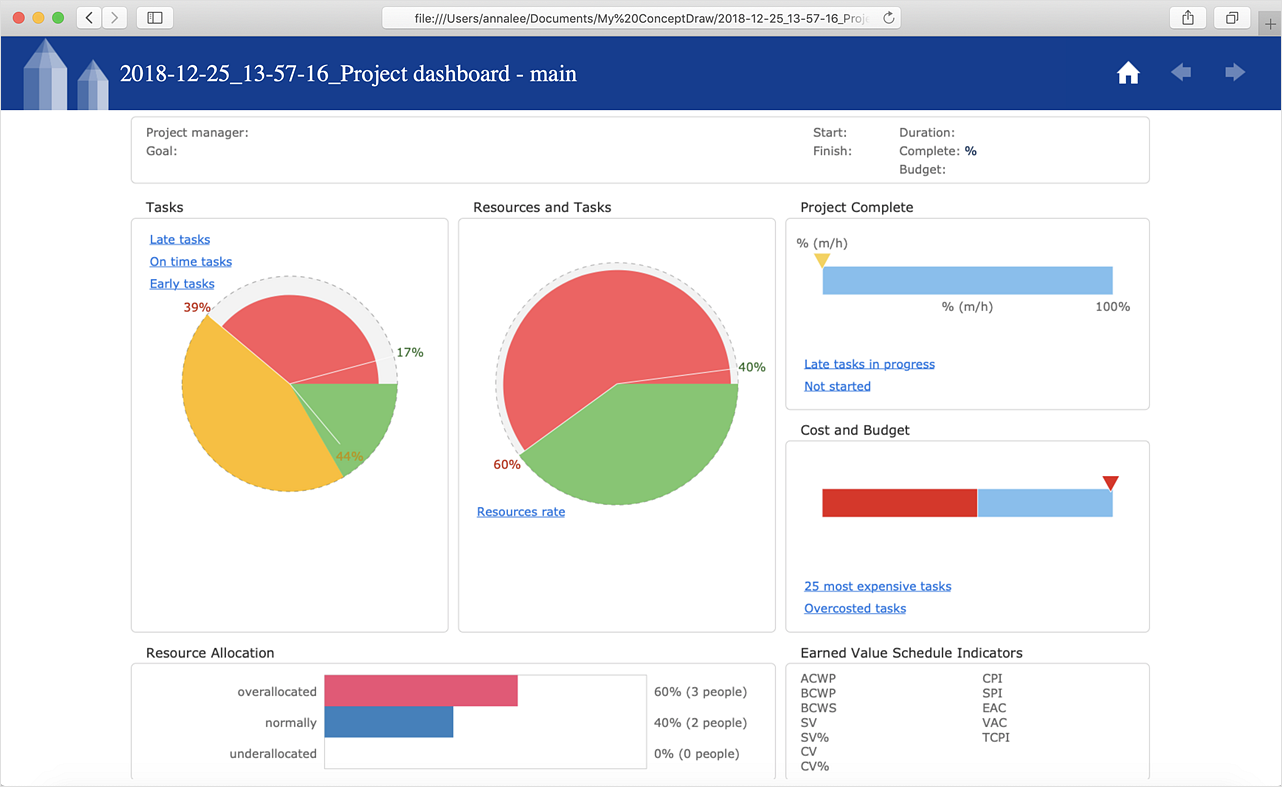
Reporting is an important part of project management. Every project manager is regularly asked how the project is progressing. ConceptDraw Office offers different ways in which to provide a project status.- How to Draw a Computer Network Diagrams | Computer and ...
- Flowchart Programming Project . Flowchart Examples | Sample ...
- Gantt Chart For Computer Network Project
- Activity Network Diagram Method | How to Create Presentation of ...
- Network Diagram Project Management Template
- Examples of Flowcharts , Organizational Charts, Network Diagrams ...
- How To Draw System Flow Diagram For Networking Project
- Examples of Flowcharts , Org Charts and More | ConceptDraw PRO ...
- Project Chart Of Computer Network
- Project Network Diagram Example Of Software Project
- ConceptDraw PRO Network Diagram Tool | Examples of Flowcharts ...
- ConceptDraw PRO Network Diagram Tool | Examples of Flowcharts ...
- Organizational Structure | Sample Project Flowchart . Flowchart ...
- Examples of Flowcharts , Org Charts and More | Network Diagram ...
- Examples of Flowcharts , Org Charts and More | Network Diagram ...
- Activity on Node Network Diagramming Tool | Activity Network ...
- Examples Of Network Diagrams Project Management
- Examples of Flowcharts , Org Charts and More | Network Diagrams ...
- Examples of Flowcharts , Org Charts and More | Network Diagram ...


