 Biology
Biology solution extends ConceptDraw PRO software with samples, templates and libraries containing biological vector symbols, to help you create scientific and educational designs in the field of biology.
 ConceptDraw Solution Park
ConceptDraw Solution Park collects graphic extensions, examples and learning materials
Sentence Diagram
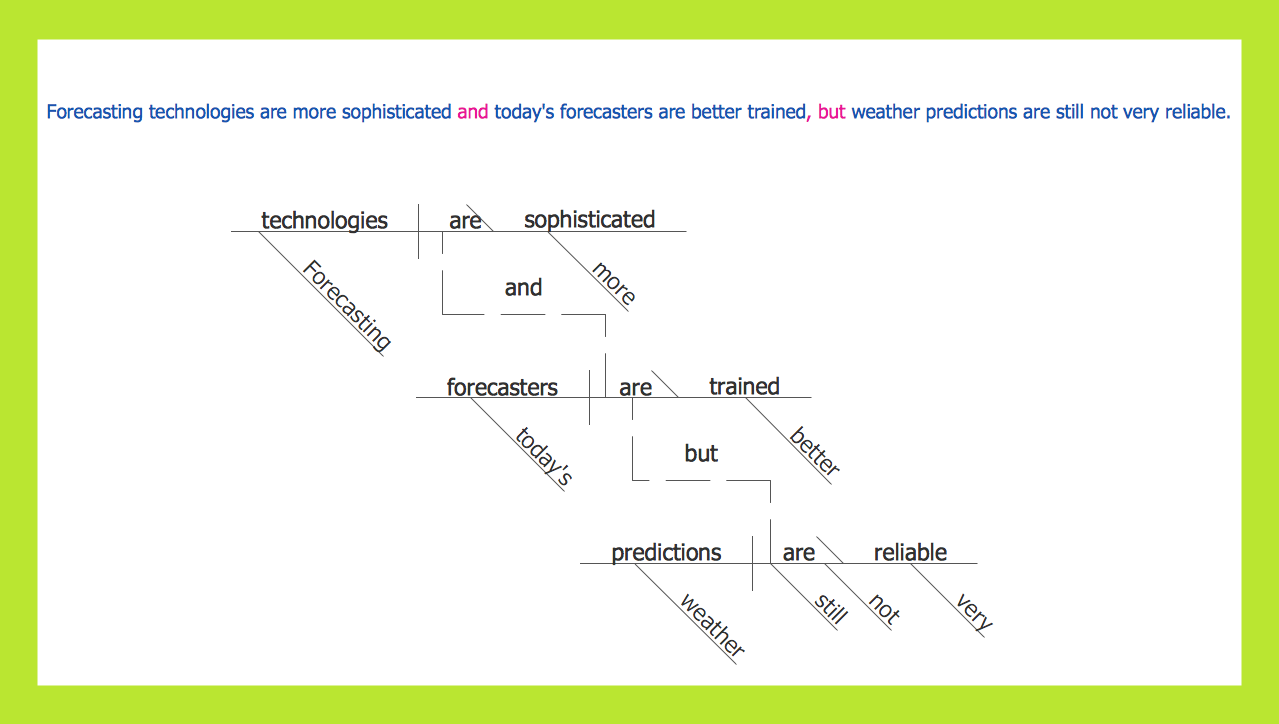
In pedagogy and theoretical syntax, a sentence diagram or parse tree is a pictorial representation of the grammatical structure of a sentence. The term "sentence diagram" is used more in pedagogy, where sentences are diagrammed.ConceptDraw PRO diagramming and vector drawing software extended with Language Learning solution from the Science and Education area is ideal for quick and easy drawing sentence diagrams of any complexity.
 Value Stream Mapping
Value stream mapping solution extends ConceptDraw PRO software with templates, samples and vector stencils for drawing the Value Stream Maps (VSM) in lean manufacturing practice.
 Physics
Physics solution extends ConceptDraw PRO software with templates, samples and libraries of vector stencils for drawing the physical illustrations, diagrams and charts.
 Plant Layout Plans
This solution extends ConceptDraw PRO v.9.5 plant layout software (or later) with process plant layout and piping design samples, templates and libraries of vector stencils for drawing Plant Layout plans. Use it to develop plant layouts, power plant desig
 Event-driven Process Chain Diagrams
Event-driven Process Chain (EPC) Diagram is a type of flowchart widely used for modeling in business engineering and reengineering, business process improvement, and analysis. EPC method was developed within the Architecture of Integrated Information Systems (ARIS) framework.
 Business Process Diagrams
The Business Process Diagram Solution extends ConceptDraw PRO v10 BPMN software with its RapidDraw interface, templates, samples, and libraries based on the BPMN 1.2 and BPMN 2.0 standards. This powerful solution permits you to visualize easily both simple and complex processes, as well as design business models. The Business Process Diagram solution allows one to quickly develop and document in detail any business processes at any stage of a project’s planning and implementation.
 Entity-Relationship Diagram (ERD)
An Entity-Relationship Diagram (ERD) is a visual presentation of entities and relationships. That type of diagrams is often used in the semi-structured or unstructured data in databases and information systems. At first glance ERD is similar to a flowch
 Cross-Functional Flowcharts
Cross-functional flowcharts are powerful and useful tool for visualizing and analyzing complex business processes which requires involvement of multiple people, teams or even departments. They let clearly represent a sequence of the process steps, the order of operations, relationships between processes and responsible functional units (such as departments or positions).
 Venn Diagrams
Venn Diagrams are actively used to illustrate simple set relationships in set theory and probability theory, logic and statistics, mathematics and computer science, linguistics, sociology, and marketing. Venn Diagrams are also often used to visually summarize the status and future viability of a project.
 Bubble Diagrams
Bubble diagrams have enjoyed great success in software engineering, architecture, economics, medicine, landscape design, scientific and educational process, for ideas organization during brainstorming, for making business illustrations, presentations, planning, design, and strategy development. They are popular because of their simplicity and their powerful visual communication attributes.
 Australia Map
For graphic artists creating accurate maps of Australia. The Australia Map solution - allows designers to map Australia for their needs, offers a collection of scalable graphics representing the political geography of Australia, split into distinct state
 Circle-Spoke Diagrams
Examples of subject areas that are well suited to this approach are marketing, business, products promotion, process modeling, market, resource, time, and cost analysis. Circle-Spoke Diagrams are successfully used in presentations, conferences, management documents, magazines, reportages, reviews, reports, TV, and social media.
- Catabolism schematic - Biochemical diagram | Biology | Biology ...
- Physics Diagram Maker
- How To Make A Pictorial Diagram
- Biology | Business Diagram Software | Catabolism schematic ...
- How to Create a CCTV Diagram in ConceptDraw PRO | Amine ...
- UML Class Diagram Example - Medical Shop
- Venn Diagram Examples for Problem Solving. Computer Science ...
- Physics Symbols | Sentence Diagram | Astronomy and Astrology ...
- How to Draw Biology Diagram in ConceptDraw PRO | Biology ...
- Biology Drawing Software | How to Draw Biology Diagram in ...
- Physics Diagrams | Mathematical Diagrams | Business Productivity ...
- Language Learning | Sentence Diagram | Language School E ...
- Language Learning | Sentence Diagram | Language School E ...
- Bio Flowchart Lite | How to Draw Biology Diagram in ConceptDraw ...
- How To Create CCTV Network Diagram | CCTV Surveillance ...
- Venn Diagram Examples for Problem Solving. Computer Science ...
- Process Flowchart | Network Diagram Software LAN Network ...
- Citric acid cycle (TCA cycle) | Biology | Catabolism schematic ...
- Sample Pictorial Chart. Sample Infographics | Pie Donut Chart. Pie ...
- Venn Diagram Examples for Problem Solving. Computer Science ...
