Learn how to create a current state value stream map
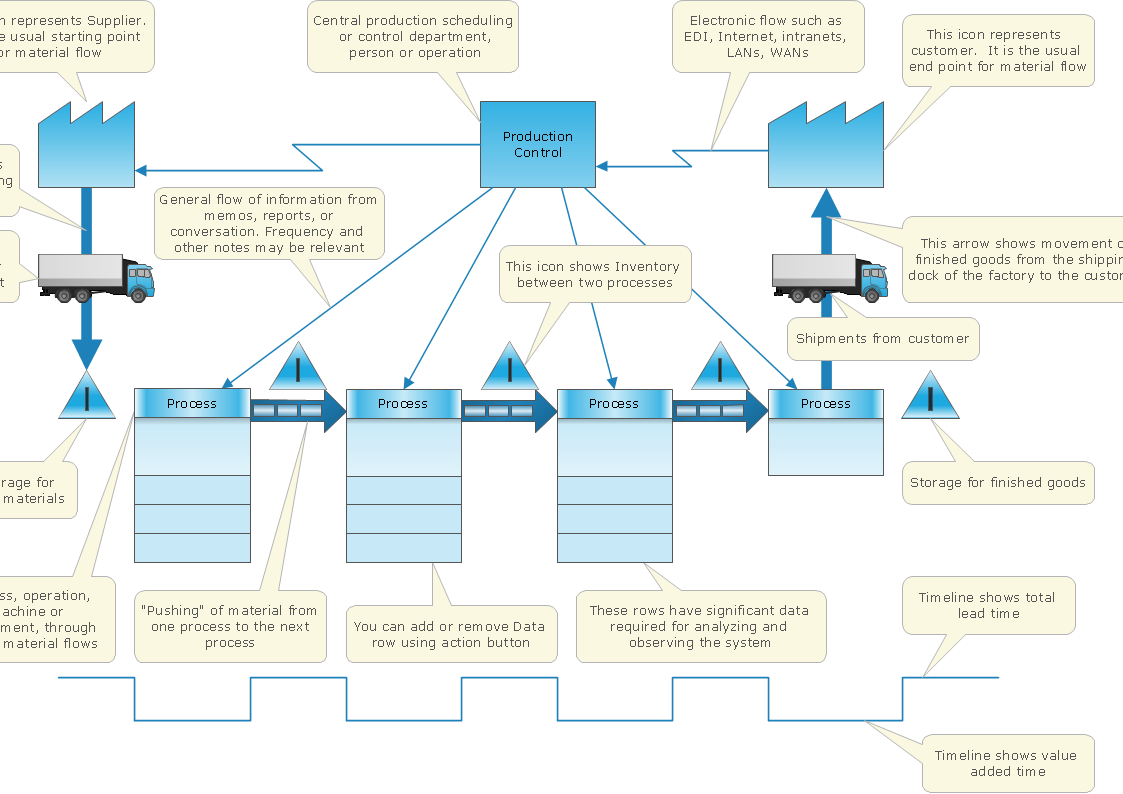
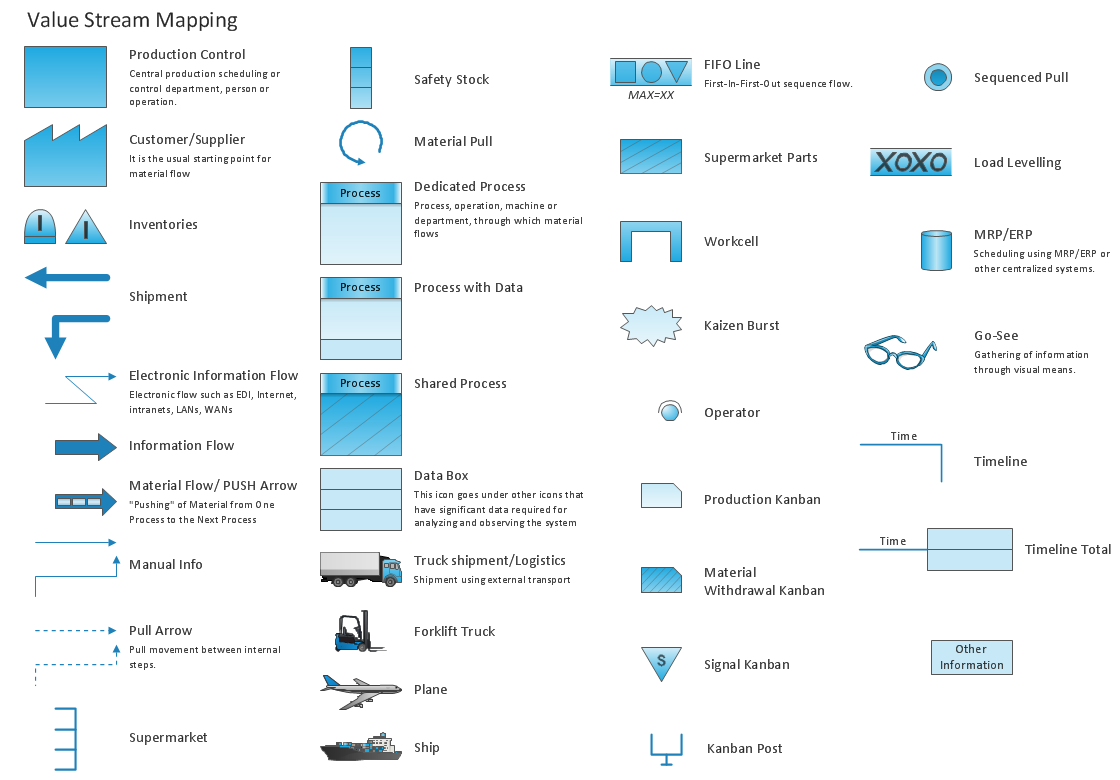
Value Stream Mapping solution extends ConceptDraw PRO software with templates, samples and vector shapes for drawing the current state value stream maps.Value Stream Mapping and Analysis
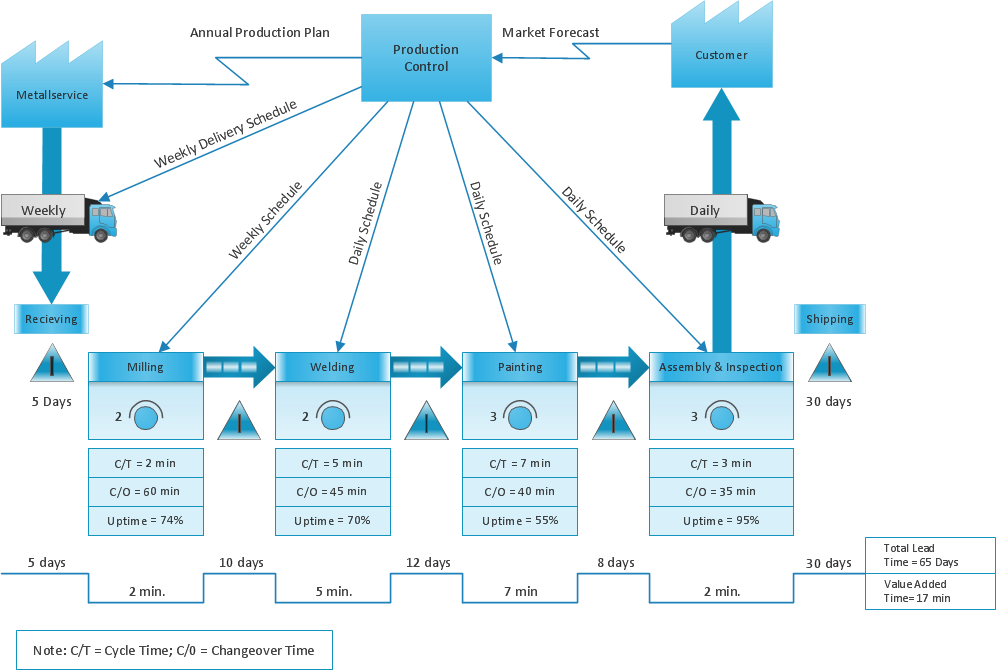
Value Stream Maps are used in lean methodology for analysis of manufacturing process and identification of the improvement opportunities.HelpDesk
How to Create a VSM Diagram Using ConceptDraw Value Stream Mapping Solution
Value Stream Mapping is a Lean Manufacturing tool that uses a flow diagram to document in great detail every step of a manufacturing process. This graphical representation of a process is a powerful tool that helps in the diagnosis of process efficiency and allows companies to develop improved processes. Many lean practitioners use Value Stream Mapping as a fundamental tool to identify waste, cut process cycle times, and implement process improvement. Many organizations use value stream mapping as a key portion of their lean efforts. Value Stream Maps are used to analyze and design the flow of materials and information required to bring a product or service to a consumer. You can create a Value Stream Mapping flowchart using ConceptDraw PRO tools.Value-Stream Mapping for Manufacturing
Create value stream maps - for value stream analysis and value stream management, material and information flow mapping, using our quick start templates included with ConceptDraw.Value Stream Mapping for the Lean Office
Value Stream Mapping for the lean office is a tool that uses a flow diagram to document in great detail every step of a manufacturing process.Create a Value Stream Map
Use ConceptDraw PRO software extended with Value Stream Mapping solution to create your own VSM diagrams.Value Stream Maps Visualize
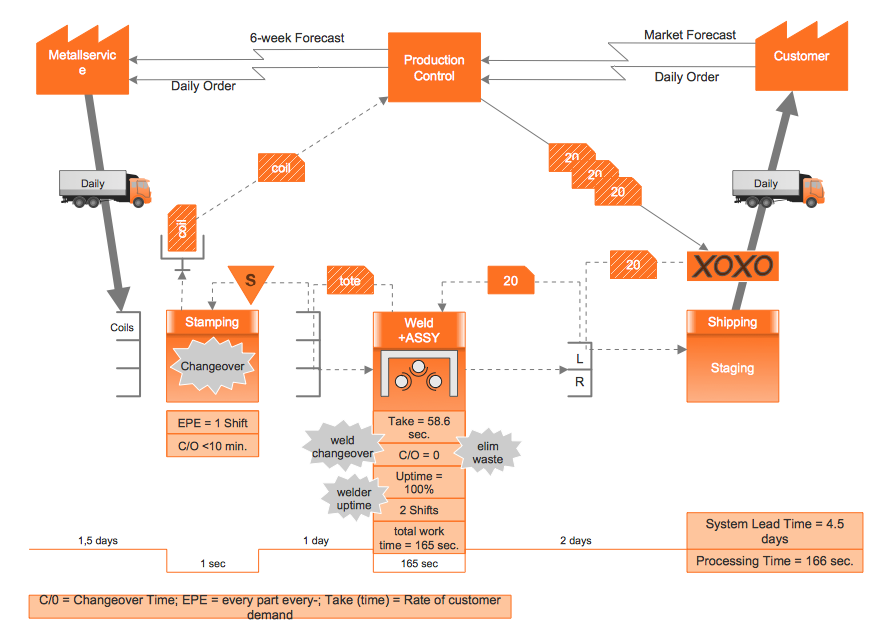
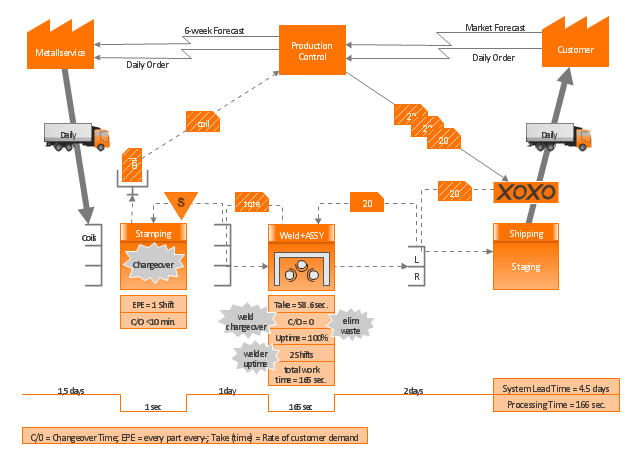
ConceptDraw Value Stream Maps visualize for a manufacturing plant the material and information flow."Value Stream Map (VSM)
1. A tool used to improve a process by identifying added value and eliminating waste.
2. A process map that follows the value creation process.
A. “strap yourself to the product (or service) and see where you go”
3. A process map with data added.
A. Times: processing, wait, cycle.
B. Quality: number of rejects.
C. Inventory.
D. Resources.
1) Number of people.
2) Space.
3) Distance traveled.
E. Whatever else is useful for analyzing the process." [ocw.mit.edu/ courses/ aeronautics-and-astronautics/ 16-660j-introduction-to-lean-six-sigma-methods-january-iap-2012/ lecture-notes/ MIT16_ 660JIAP12_ 1-6.pdf]
This sample VSM flowchart shows the value stream in a manufacturing, production control and shipping processes.
This value stream mapping diagram example was created using the ConceptDraw PRO diagramming and vector drawing software extended with the Value Stream Mapping solution from the Quality area of ConceptDraw Solution Park.
Lean Six Sigma Diagram Software
Lean Six Sigma (LSS) is a well-known in all over the world methodology of quality improvement and business perfection. ConceptDraw PRO diagramming and vector drawing software is a powerful Lean Six Sigma Diagram Software thanks to the included Value Stream Mapping solution from the Quality Area of ConceptDraw Solution Park.- Value Stream Mapping | How to Create a VSM Diagram Using ...
- Value Stream Mapping | How to Create a VSM Diagram Using ...
- Value Stream Diagram | Quality Engineering Diagrams | Value ...
- Value Stream Mapping for the Lean Office | Value stream with ...
- Value Stream Mapping
- How to Create a VSM Diagram Using ConceptDraw Value Stream ...
- How to Create a VSM Diagram Using ConceptDraw Value Stream ...
- Value Stream Mapping Symbols
- Value Stream Diagram | What is Value Stream Mapping ? | How to ...
- Value Stream Mapping Examples Produc
- Payroll process - Swim lane process mapping diagram | Design ...
- Value Stream Mapping
- Value Stream Mapping Symbols | How to Create a VSM Diagram ...
- Value Stream Mapping
- How to Create a VSM Diagram Using ConceptDraw Value Stream ...
- Value Stream Mapping
- Value Stream Mapping Icons | How to Create a VSM Diagram Using ...
- Life cycle analysis - Ring chart | How to Create a VSM Diagram ...
- ConceptDraw Solution Park | Business Process Workflow Diagrams ...

