HelpDesk
How to Create Flowchart Using Standard Flowchart Symbols
Flowcharts are used to display an algorithm for consistent execution of certain steps. Flowchart is probably the easiest way to make a graphical representation of any process. Flowcharts use the set of standard geometric symbols and arrows to define relationships. ConceptDraw PRO allows you to create professional flowchart quickly and easily. The ability to create flowcharts is contained in the Flowcharts solution. The solution provides a set of special tools for creating flowcharts.Process Flowchart
The main reason of using Process Flowchart or PFD is to show relations between major parts of the system. Process Flowcharts are used in process engineering and chemical industry where there is a requirement of depicting relationships between major components only and not include minor parts. Process Flowcharts for single unit or multiple units differ in their structure and implementation. ConceptDraw PRO is Professional business process mapping software for making Process flowcharts, Process flow diagram, Workflow diagram, flowcharts and technical illustrations for business documents and also comprehensive visio for mac application. Easier define and document basic work and data flows, financial, production and quality management processes to increase efficiency of your business with ConcepDraw PRO. Business process mapping software with Flowchart Maker ConceptDraw PRO includes extensive drawing tools, rich examples and templates, process flowchart symbols and shape libraries, smart connectors that allow you create the flowcharts of complex processes, process flow diagrams, procedures and information exchange. Process Flowchart Solution is project management workflow tools which is part ConceptDraw Project marketing project management software. Drawing charts, diagrams, and network layouts has long been the monopoly of Microsoft Visio, making Mac users to struggle when needing such visio alternative like visio for mac, it requires only to view features, make a minor edit to, or print a diagram or chart. Thankfully to MS Visio alternative like ConceptDraw PRO software, this is cross-platform charting and business process management tool, now visio alternative for making sort of visio diagram is not a problem anymore however many people still name it business process visio tools.
HelpDesk
Accounting Information Systems Flowchart Symbols
Accounting Information system is a combination of software and hardware, as well as organizational support. Information system - it is not only the software and computers with network equipment, but also a list of instructions and standards which can be notated using Accounting information systems flowchart symbols. All information systems can be divided into information retrieval and data processing systems. Data Flow model is a hierarchical model. Each process can be divided into structural components, that depict by corresponding flowchart symbols, showing the accounting information system in communication with the external environment. The major components of accounting information systems flowchart are: entities, processes, data stores, and data flows. The set of standard accounting information flowchart symbols is intended to show the relationships between the system components. ConceptDraw PRO can help to draw clear accounting information system diagrams using special flowchart symbols.Account Flowchart. Flowchart Examples
Create your own flow charts of computer or network system account processing using the ConceptDraw PRO diagramming and vector drawing software extended with the Cross-Functional Flowcharts solution from the Business Processes area of ConceptDraw Solution Park. The flow chart example shows the computer network system account processing.
 Flowcharts
The Flowcharts solution for ConceptDraw PRO is a comprehensive set of examples and samples in several varied color themes for professionals that need to represent graphically a process. Solution value is added by the basic flow chart template and shapes' libraries of flowchart notation. ConceptDraw PRO flow chart creator lets one depict the processes of any complexity and length, as well as design the Flowchart either vertically or horizontally.
HelpDesk
How to Create a Timeline Diagram in ConceptDraw PRO
A Timeline is a chart which displays a project plan schedule in chronological order. A Timeline is used in project management to depict project milestones and visualize project phases, and show project progress. The graphic form of a timeline makes it easy to understand critical project milestones, such as the progress of a project schedule. Timelines are particularly useful for project scheduling or project management when accompanied with a Gantt chart. It captures the main of what the project will accomplish and how it will be done. making a project timeline is one of the most important skills a project manager needs have. Making comprehensive, accurate timelines allows you getting every project off in the best way. ConceptDraw PRO allows you to draw a timeline charts using special library.HelpDesk
How to Make a Rapid Draw Object
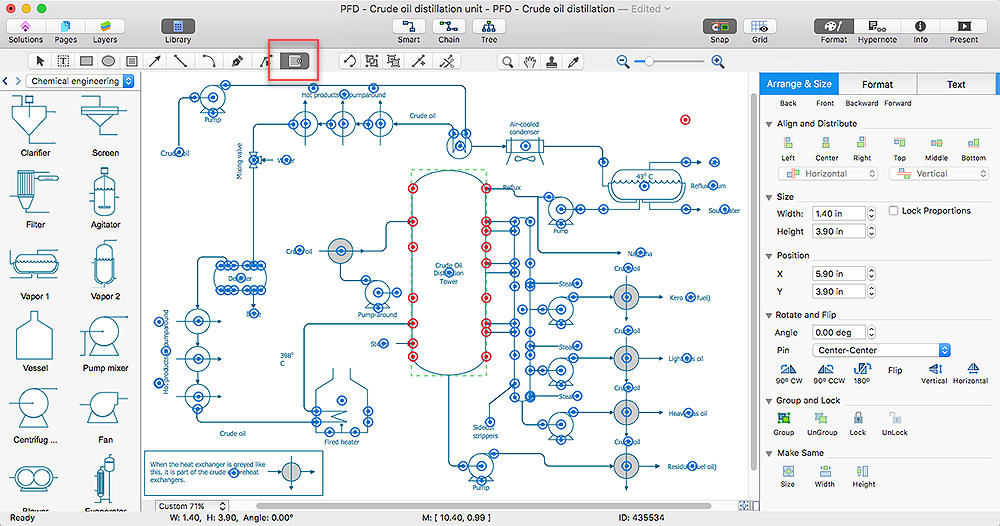
The Rapid Draw technology is an automatic drawing system. It is designed to significantly reduce the time of creating flowcharts and diagrams. Especially those, consisting from some typical entities. You can extend the standard ConceptDraw PRO object libraries with new objects by customizing any item from any library and assigning it with Rapid Draw features. You can quickly create and edit complex drawings using Rapid Draw technology and your self-created objects.HelpDesk
How to Work with Custom Properties
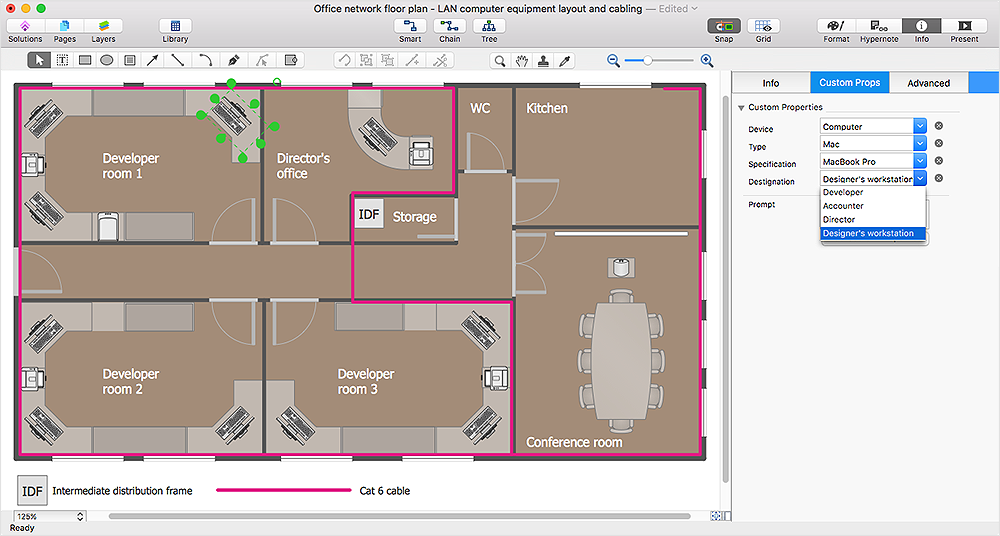
ConceptDraw PRO can store additional, user-defined data that can be assigned to a particular shape. This data is stored in the Custom Properties options.
 ConceptDraw Solution Park
ConceptDraw Solution Park collects graphic extensions, examples and learning materials
HelpDesk
How to Create a Business Process Workflow Diagram Using ConceptDraw PRO
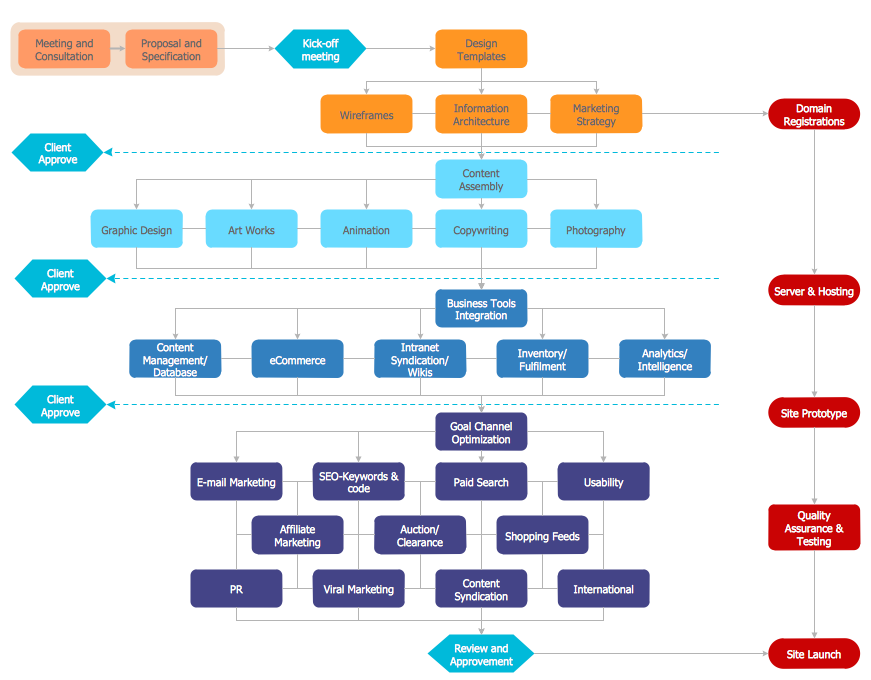
Any business process consists from a set of activities and tasks intended to accomplish a particular business objective. Making a business process workflow diagram is a visual way for business process analysis. Business process workflow diagram should show how various process participants interact with each other to accomplish business tasks and how the corresponding information flows through the business process stages. A business process workflow diagram can be in help when there is a need to improve the business process. It provides the clear vision on what steps, decisions or activities involved in a process need to be improved . The simplicity of business process workflow diagrams makes them useful tools for process communicating, documenting and guidance on how to do a particular work. ConceptDraw PRO, with the extended functionality of the Business Process Workflow Diagrams solution, is the ideal medium for creating designs of this type. Business Process The Workflow Diagrams solution contains the set of libraries that help to represent various steps and kinds of business processes.HelpDesk
How To Create MS Visio Flowchart
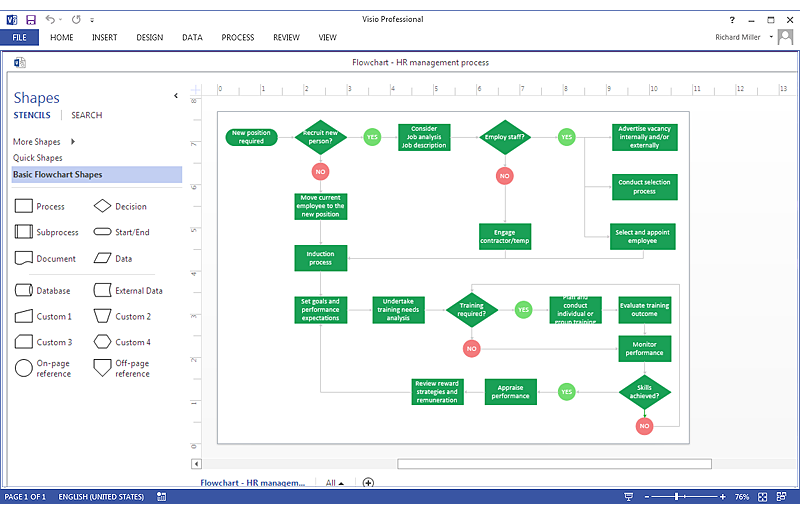
Making a process or work flow step-by-step visualization helps you to better understand it and effectively communicate with your audience. Flowcharting is the best way to do this. Flowchart is a diagram that successively depicts all process steps. Basic flowchart is the most easy and understandable type of a flowchart. Using ConceptDraw PRO you can design flowcharts of any complexity on Windows or OS X . Then you can export them to Visio format to share with the users of MS Visio. Moreover, using ConceptDraw PRO you can open and edit a flowchart made in Visio, regardless of whether you are using OS X or Windows.HelpDesk
How to Add, Move, or Delete Connection Points on Mac
Some tips on how to manage connection points in ConceptDraw PRO drawings on Macintosh. A connection point is a special point on an object that allows one to connect a connector. You can add connection points to any object or to the blank area in your document.HelpDesk
How to Create a New Library
Sometimes, when creating a diagram, you need to use a large set of elements from different libraries. If you are using ConceptDraw , in such case, we recommend you to create a new library, which consists of vector library objects from other ConceptDraw libraries. You also can add some custom unique objects into such library. Each object that contains in a new library can be provided with a unique description and keyword list. Thus, the new library and its objects will be indexed to be searched and used in the further diagrams.HelpDesk
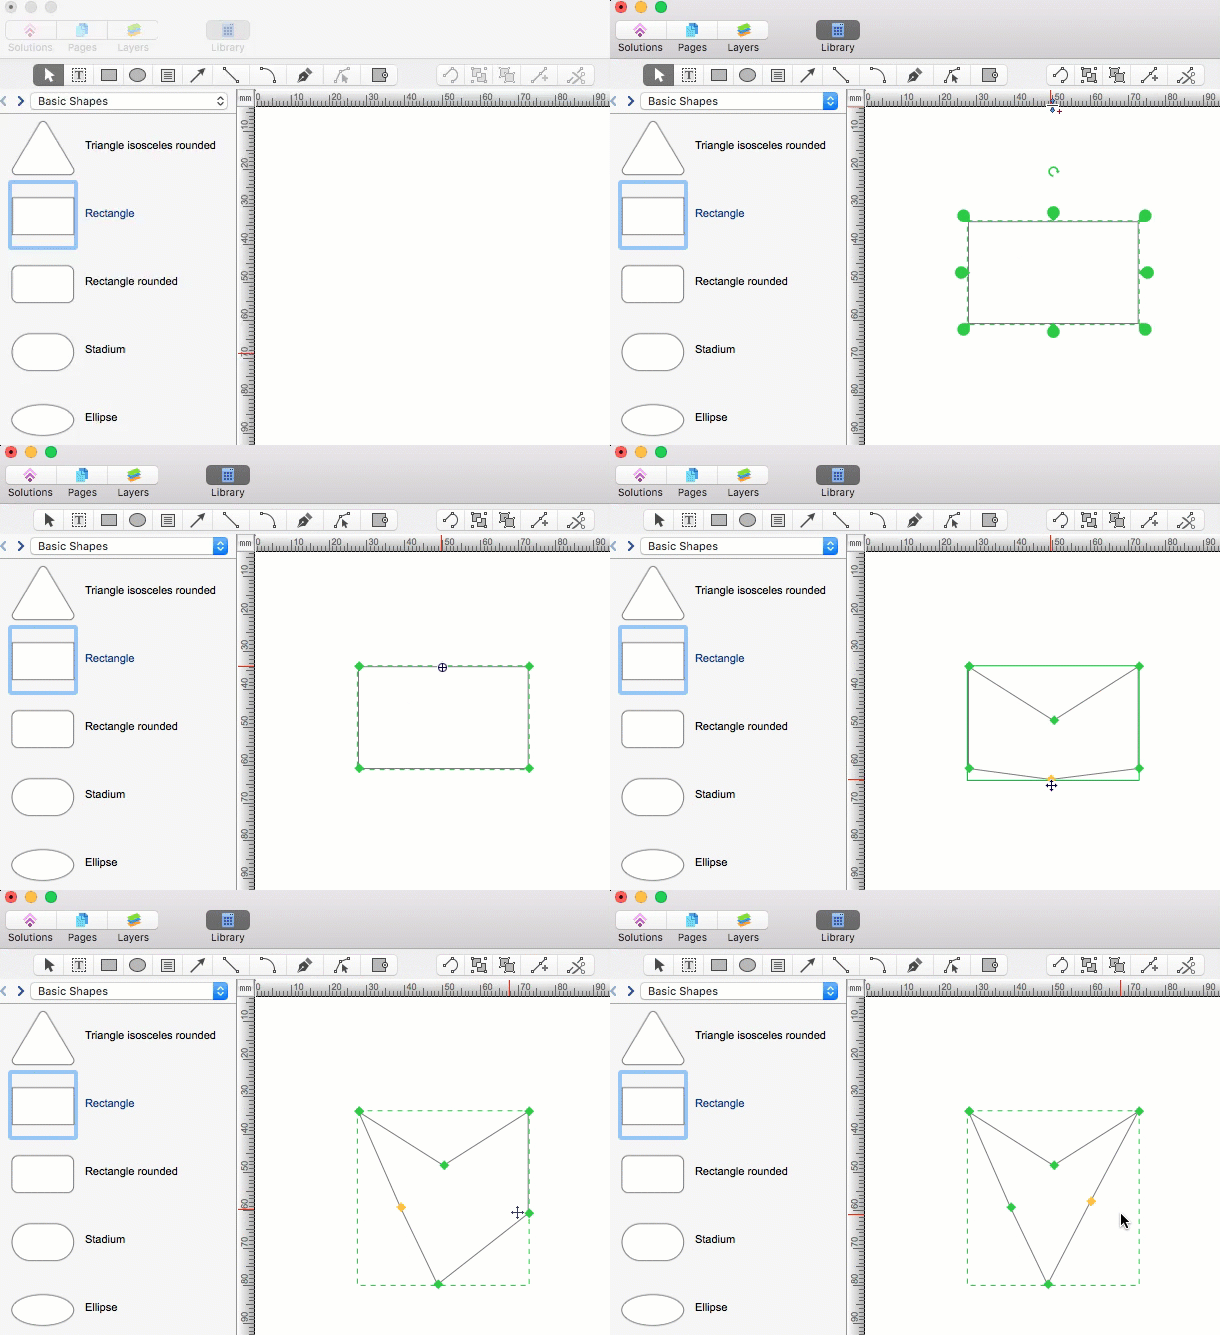
How to Reshape an Object Using Vertex Tool on Mac
To create complex objecrts or change existing ones in ConceptDraw PRO , you can use the Vertex tool. Using vertexes you can modify the geometry of any object in ConceptDraw PRO.HelpDesk
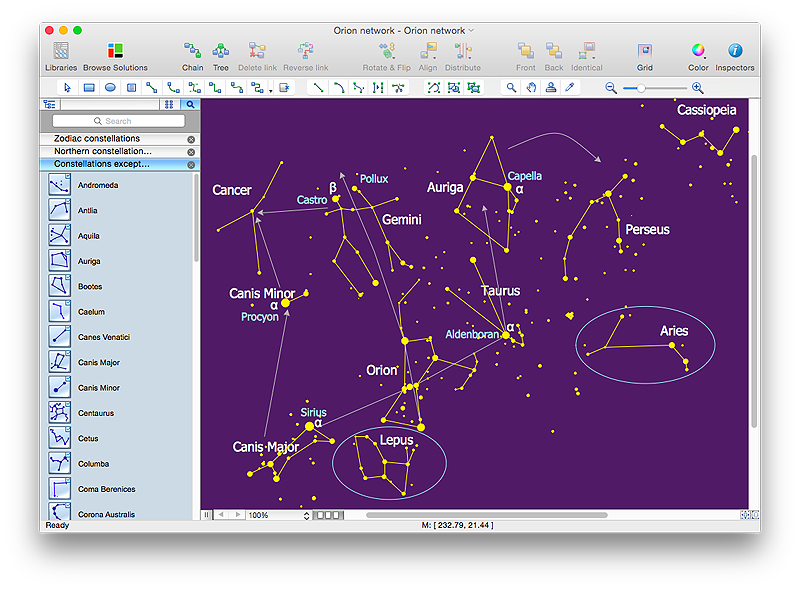
How to Draw a Сonstellation Сhart
Astronomic maps are used to locate stars, planets and other objects in the sky for a certain date, time and observing location. ConceptDraw Astronomy solution can be used as a tool for creating astronomy maps, charts and illustrations that contains astronomy symbols of constellations, galaxies, stars and planets. It allows you to draw the map of any constellation quickly and easily using the special templates and vector stencils libraries.- Basic Flowchart Symbols and Meaning | Audit Flowchart Symbols ...
- Basic Flowchart Symbols and Meaning | Flowchart design ...
- Identity Matrix Flowchart
- Process Flowchart | Basic Flowchart Symbols and Meaning | How to ...
- Basic Flowchart Symbols and Meaning | Process Flowchart | Cross ...
- Process Flowchart | Basic Flowchart Symbols and Meaning | Cross ...
- Basic Flowchart Symbols and Meaning | Cross Functional Flowchart ...
- Basic Flowchart Symbols and Meaning | Sample Project Flowchart ...
- Process Flowchart | Basic Flowchart Symbols and Meaning | Flow ...
- Block diagram - Branding strategies | Basic Flowchart Symbols and ...
- Basic Flowchart Symbols and Meaning | Process Flowchart | Basic ...
- Basic Flowchart Symbols and Meaning | Process Flowchart | Types ...
- Basic Flowchart Symbols and Meaning | Cross-Functional Flowchart ...
- Process Flowchart | Basic Flowchart Symbols and Meaning ...
- Basic Flowchart Symbols and Meaning | Process Flow Diagram ...
- Basic Flowchart Symbols and Meaning | Process Flowchart | Flow ...
- Basic Flowchart Symbols and Meaning | IDEF0 Flowchart Symbols ...
- Types of Flowcharts | Types of Flowchart - Overview | Basic ...
- Basic Flowchart Symbols and Meaning | Database Flowchart ...


