 Spatial Infographics
Spatial infographics solution extends ConceptDraw PRO software with infographic samples, map templates and vector stencils libraries with design elements for drawing spatial information graphics.
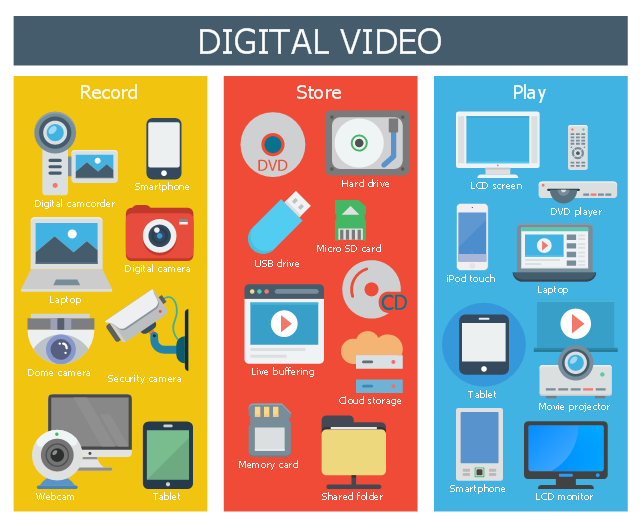
This infographic sample shows digital video devices for video record, store and play.
"Digital video is a representation of moving visual images in the form of encoded digital data. ...
QuickTime, Apple Computer's architecture for time-based and streaming data formats appeared in June, 1991. Initial consumer-level content creation tools were crude, requiring an analog video source to be digitized to a computer-readable format. While low-quality at first, consumer digital video increased rapidly in quality, first with the introduction of playback standards such as MPEG-1 and MPEG-2 (adopted for use in television transmission and DVD media), and then the introduction of the DV tape format allowing recordings in the format to be transferred direct to digital video files (containing the same video data recorded on the transferred DV tape) on an editing computer and simplifying the editing process, allowing non-linear editing systems (NLE) to be deployed cheaply and widely on desktop computers with no external playback/ recording equipment needed, save for the computer simply requiring a FireWire port to interface to the DV-format camera or VCR. The widespread adoption of digital video has also drastically reduced the bandwidth needed for a high-definition video signal (with HDV and AVCHD, as well as several commercial variants such as DVCPRO-HD, all using less bandwidth than a standard definition analog signal) and tapeless camcorders based on flash memory and often a variant of MPEG-4." [Digital video. Wikipedia]
The infographic example "Digital video" was created using the ConceptDraw PRO diagramming and vector drawing software extended with the Audio, Video, Media solution from the Illustrations area of ConceptDraw Solution Park.
Sample Pictorial Chart. Sample Infographics
Sample Pictorial Chart - Pictorial Infographics solution provides easy-to-use design infographics drawing tools, large collection of different sample infographics and infograms, sample pictorial chart and templates to be filled in, and 10 libraries with great quantity of predesigned vector pictograms. Use Pictorial Infographics solution to draw your own design pictorial infographics documents quick and easy.Spatial Infographics
Not everyone can make spatial infographics from scratch, ConceptDraw will help you to create your own infographics.Scrum
What is Scrum? Scrum is the famous agile software development methodology which depicts an iterative and incremental approach for the work on the complex projects. Use ConceptDraw PRO diagramming and vector drawing software extended with SCRUM Workflow solution to draw various types of professional-looking Scrum Charts, Scrum Workflow Diagrams, Scrum Mind Maps, Scrum boards and attractive Scrum Infographics.Winter Sports Vector Clipart. Medal Map. Spatial Infographics
Tracking Olympic results in visual format is the most modern way to deliver statistics to a broad audience. This is a good example of an illustrated table you may easily modify, print, or publish on web from ConceptDraw Winter Sports solution .HelpDesk
ConceptDraw Office for Windows Installation Definition
With the introduction of version 3, ConceptDraw Office has been redesigned to better accommodate future developments and solution plugins. ConceptDraw Office 3 includes ConceptDraw PRO 10, ConceptDraw MINDMAP 8, and ConceptDraw PROJECT 7. Owners of ConceptDraw Office v1 and ConceptDraw Office v2, please read this description of the specific features of the ConceptDraw Office 3 installation for Windows before updating.HelpDesk
ConceptDraw Office for Apple macOS Installation Definition
With the introduction of version 3, ConceptDraw Office has been redesigned to better accommodate future developments and solution plugins. ConceptDraw Office 3 includes ConceptDraw PRO 10, ConceptDraw MINDMAP 8, and ConceptDraw PROJECT 7. The renewed ConceptDraw STORE helps user manage downloads of ConceptDraw products and solutions. The following article provides owners of the previous versions of ConceptDraw products with important information on updating on ConceptDraw Office v3.How to draw Metro Map style infographics? Moscow, New York, Los Angeles, London
The solution handles designs of any complexity, and the comprehensive library covers all key aspects of a transportation system. To further enhance your map design, there is the option to embed links, that can display station images or other relevant, important information. We have also included a set of samples in the solution, that show the possible real-world application — complex tube systems including the London Tube and New York City Subway show the level of detail possible when using the Metro Map Solution.Pyramid Diagram
ConceptDraw Pyramid Diagram software allows drawing column charts using predesigned objects or drawing tools.How to Draw Pictorial Chart. How to Use Infograms
How to draw pictorial chart quick, easy and effective? ConceptDraw PRO offers the unique Pictorial Infographics Solution that will help you! Pictorial Infographics solution contains large number of libraries with variety of predesigned vector pictograms that allows you design infographics in minutes. There are available 10 libraries with 197 vector pictograms.
 Business Process Mapping
The Business Process Mapping solution for ConceptDraw PRO is for users involved in process mapping and creating SIPOC diagrams.
- HR Flowchart Symbols | Design Pictorial Infographics . Design ...
- LLNL Flow Charts | What are Infographic Area | Pyramid Chart ...
- Spatial Infographics | Double Bar Graph Definition Wikipedia
- Digital video | Infographic For Mpeg
- Agile Definition Of Done Infographic
- Spatial Infographics | Event-driven Process Chain (EPC) Diagrams ...
- Desktop Vs Analog Infographic
- Buffering Video Infographic
- Scrum Framework Infographic
- Stakeholder Infographic
- Cloud computing stack | Network Glossary Definition | Thin Client
- Roles on DAD teams | Create Project Vision | Scrum | Infographic ...
- Marketing Plan Infographic | Basic Flowchart Symbols and Meaning ...
- Infographic Recording Audio
- Basic Flowchart Symbols and Meaning | What are Infographic Area ...
- Scrum sprint cycle | Scrum | Scrum workspace | Scrum Infographic
- Infographic Symbols Hvac
- Agile Scrum Infographic
- Infographic Scrum


