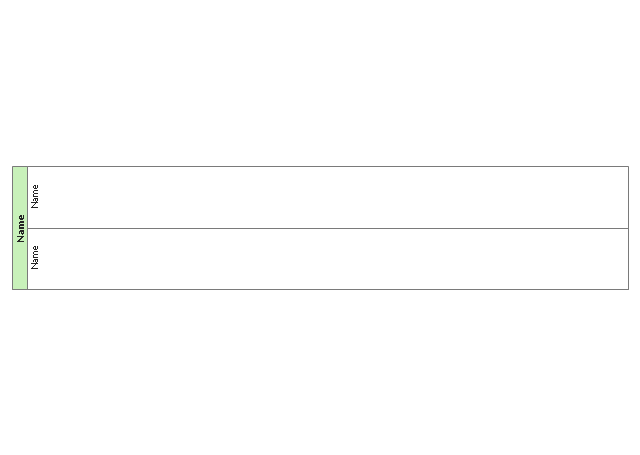
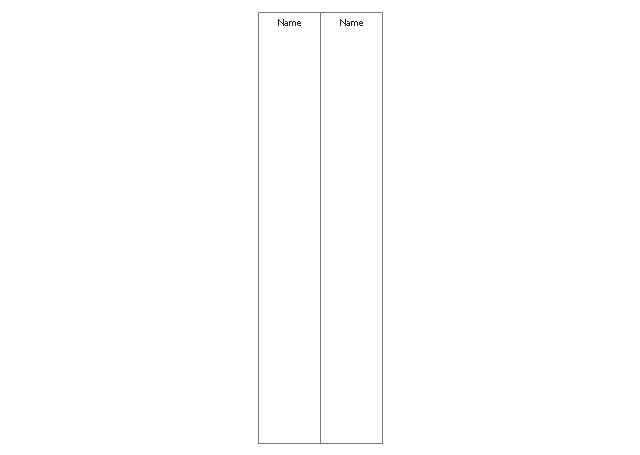
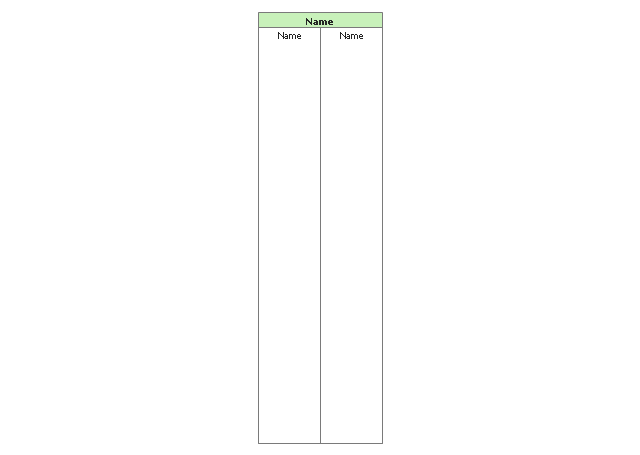
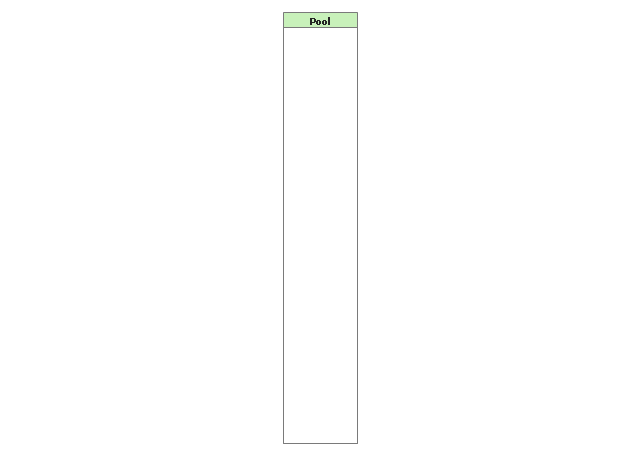
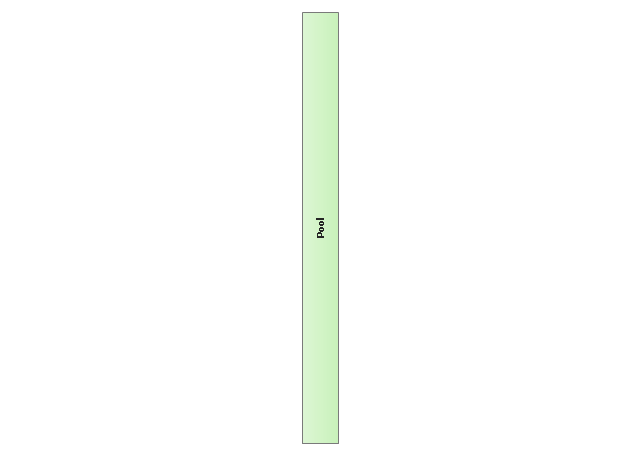
The vector stencils library "Swimlanes" contains 20 swimlane symbol shapes.
Use it for drawing business process diagrams (BPMN 2.0) in the ConceptDraw PRO diagramming and vector drawing software extended with the Business Process Diagram solution from the Business Processes area of ConceptDraw Solution Park.
www.conceptdraw.com/ solution-park/ business-process-diagram
Use it for drawing business process diagrams (BPMN 2.0) in the ConceptDraw PRO diagramming and vector drawing software extended with the Business Process Diagram solution from the Business Processes area of ConceptDraw Solution Park.
www.conceptdraw.com/ solution-park/ business-process-diagram
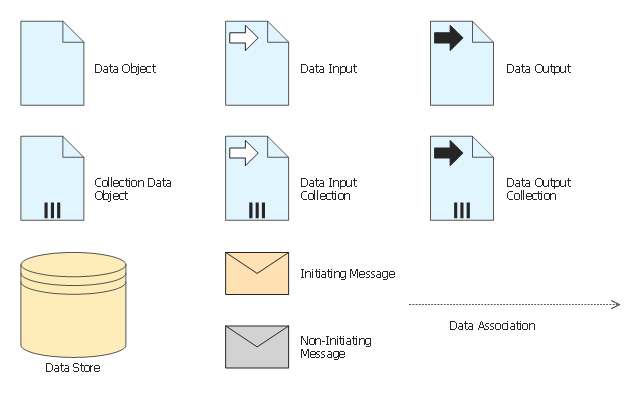
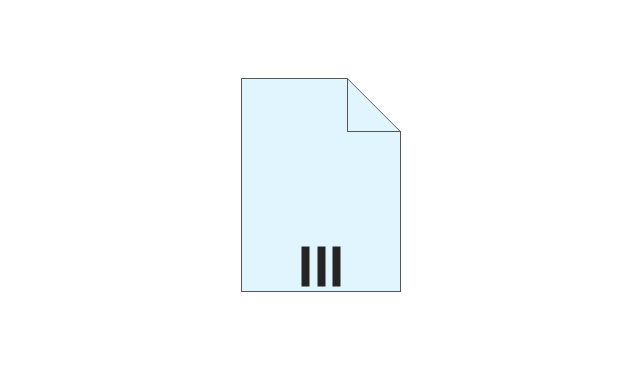
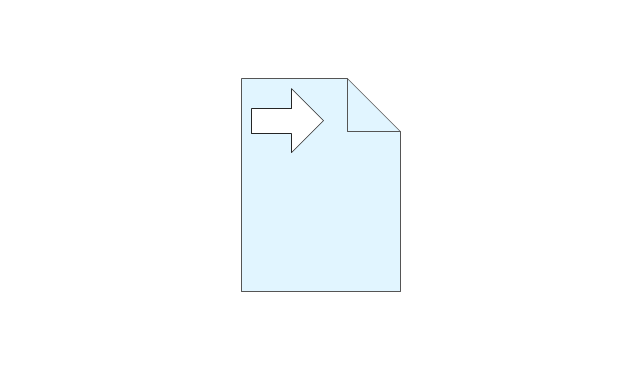
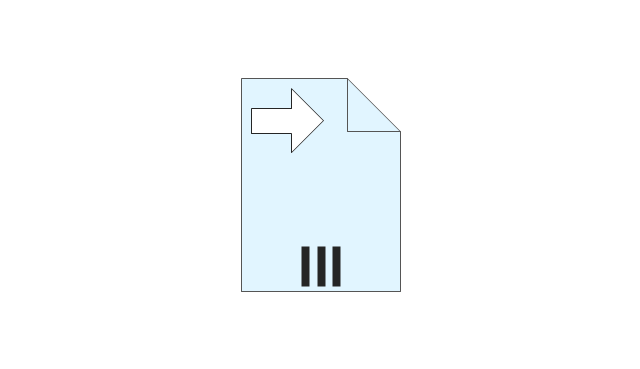
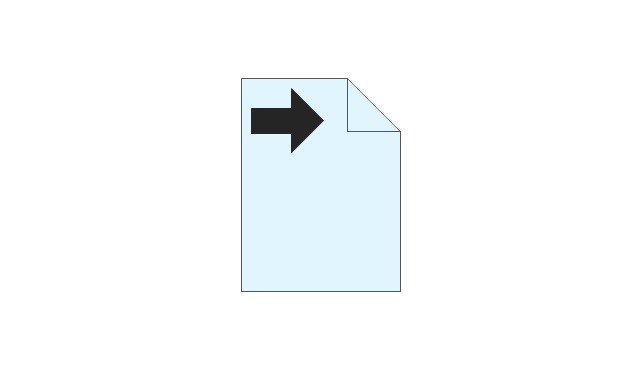
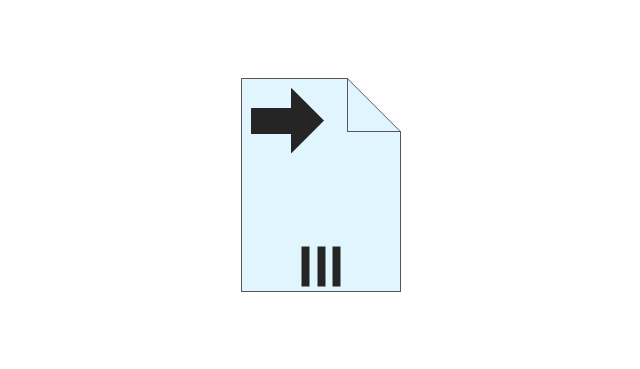
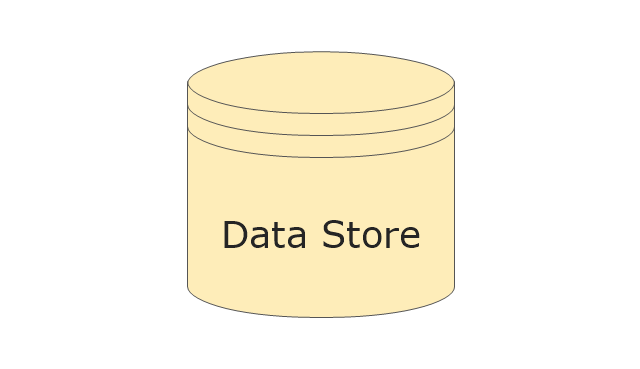
The vector stencils library "Data" contains 10 data symbols: data object, collection data object, data input and output, data input and output collections, data store, initiating and non-initiating messages, data association.
Use these shapes for drawing business process diagrams (BPMN 2.0) in the ConceptDraw PRO diagramming and vector drawing software extended with the Business Process Diagram solution from the Business Processes area of ConceptDraw Solution Park.
www.conceptdraw.com/ solution-park/ business-process-diagram
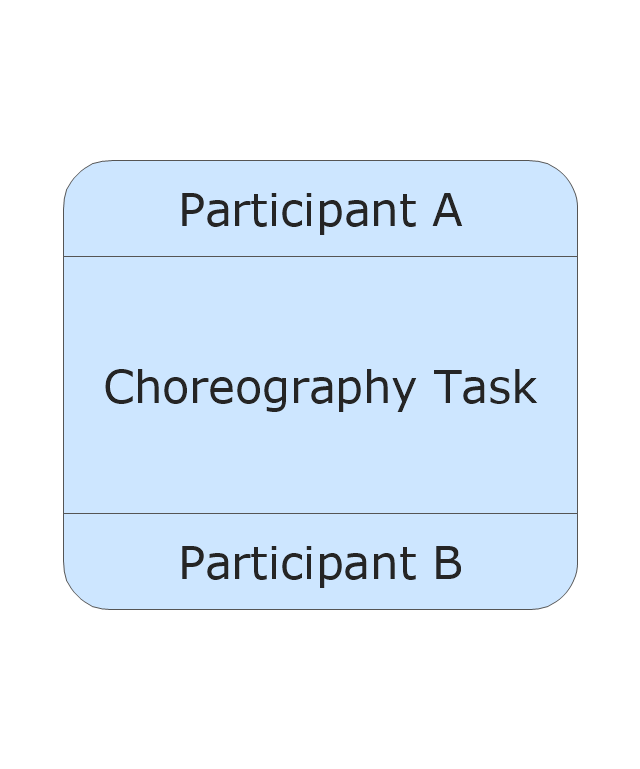
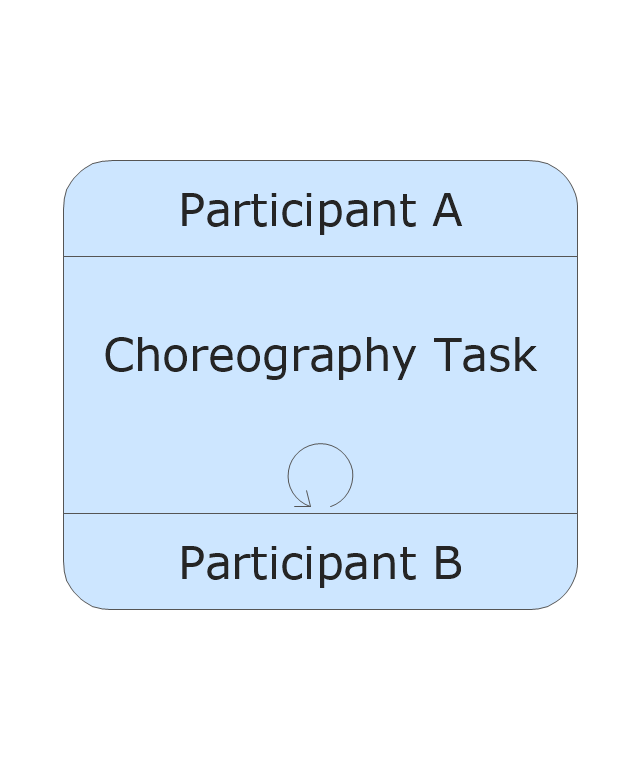
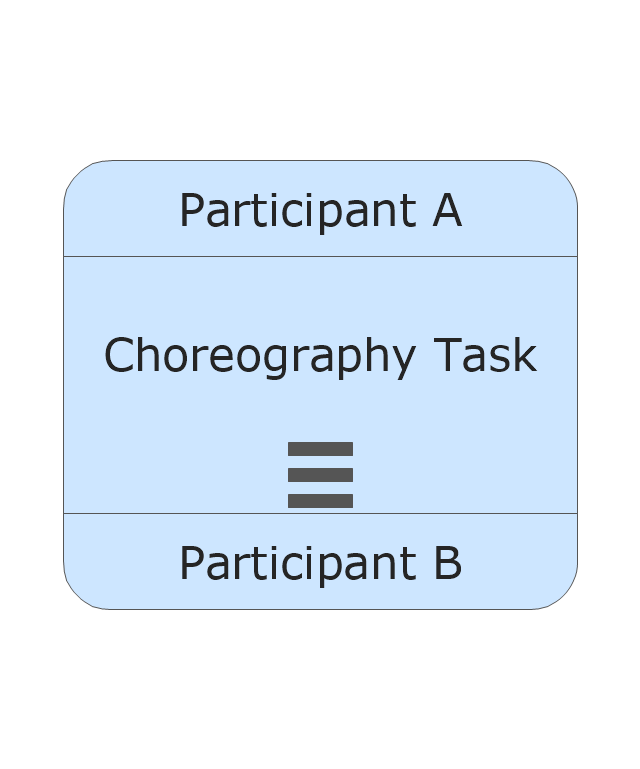
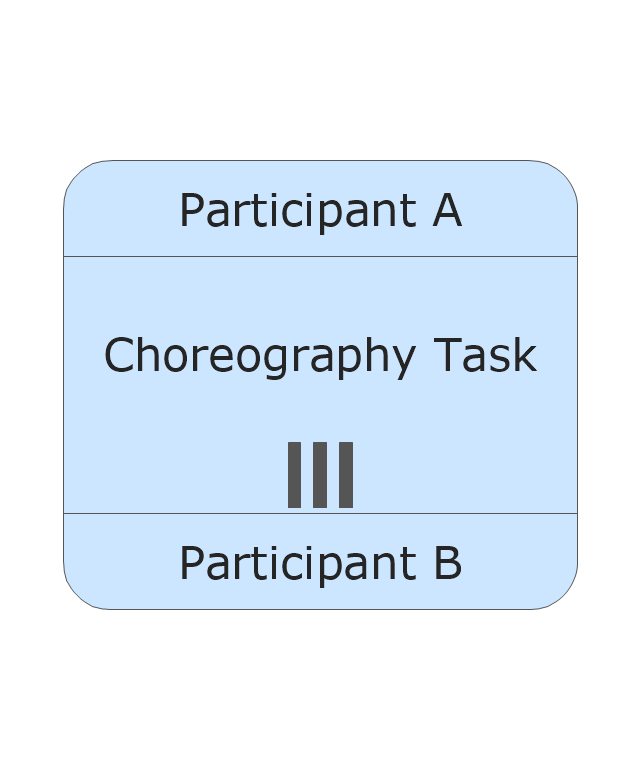
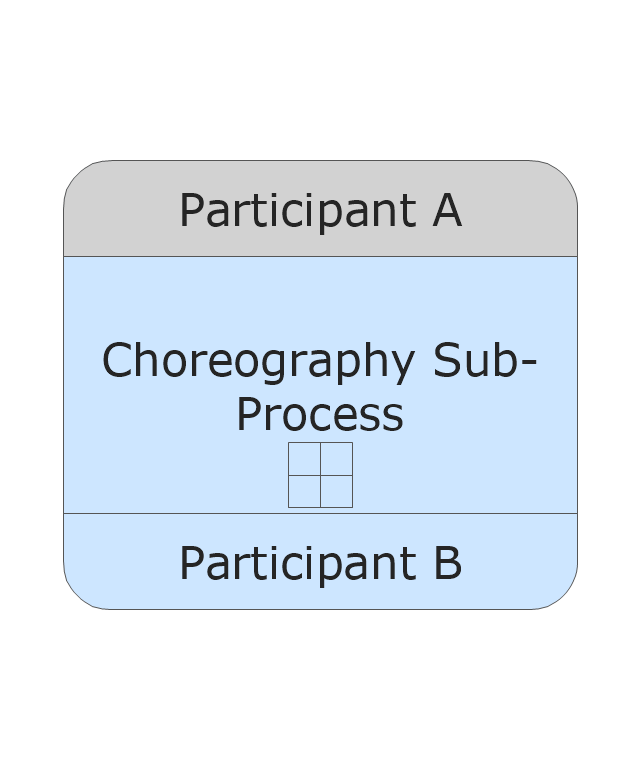
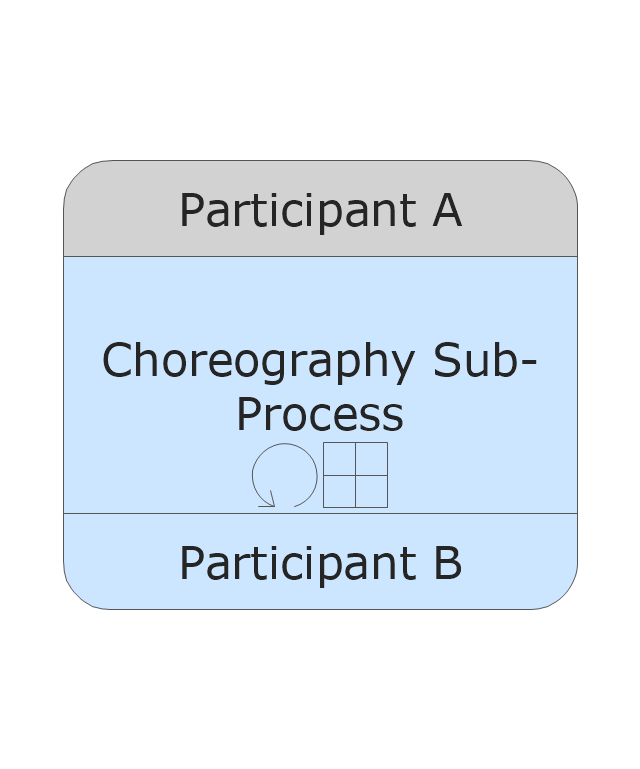
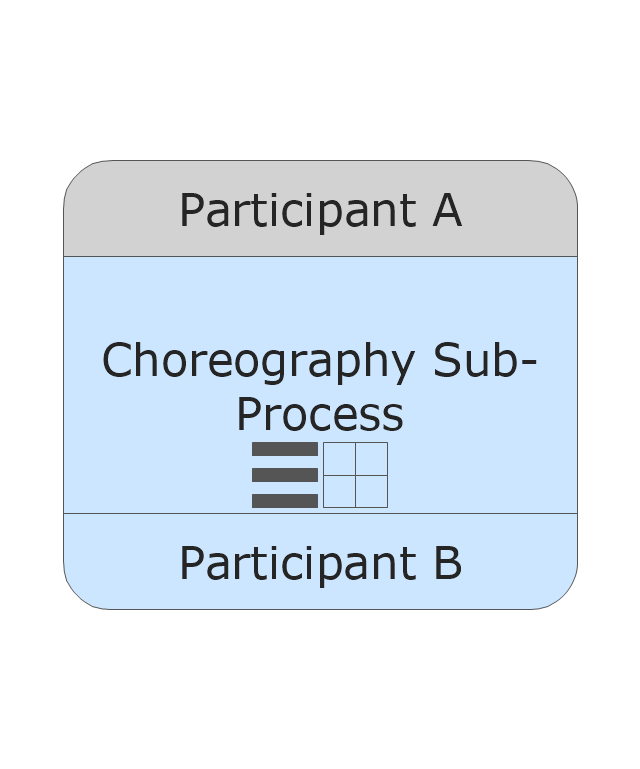
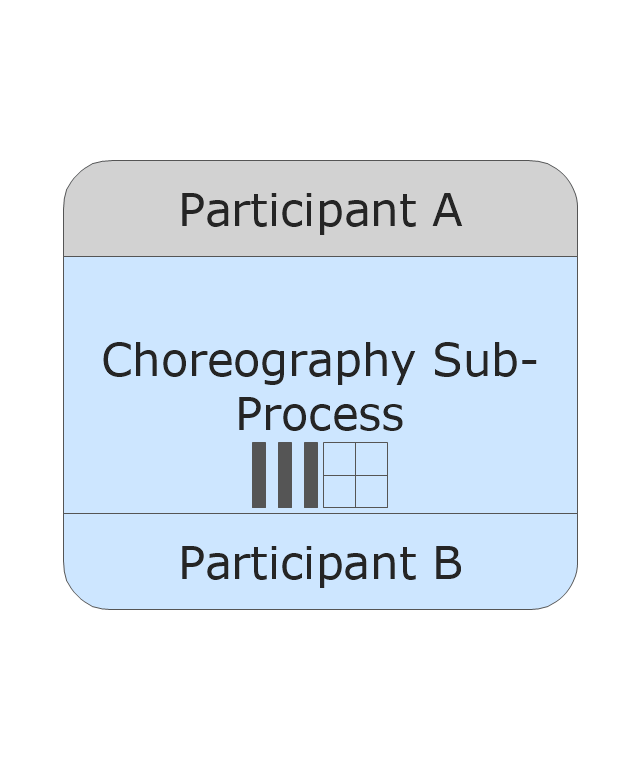
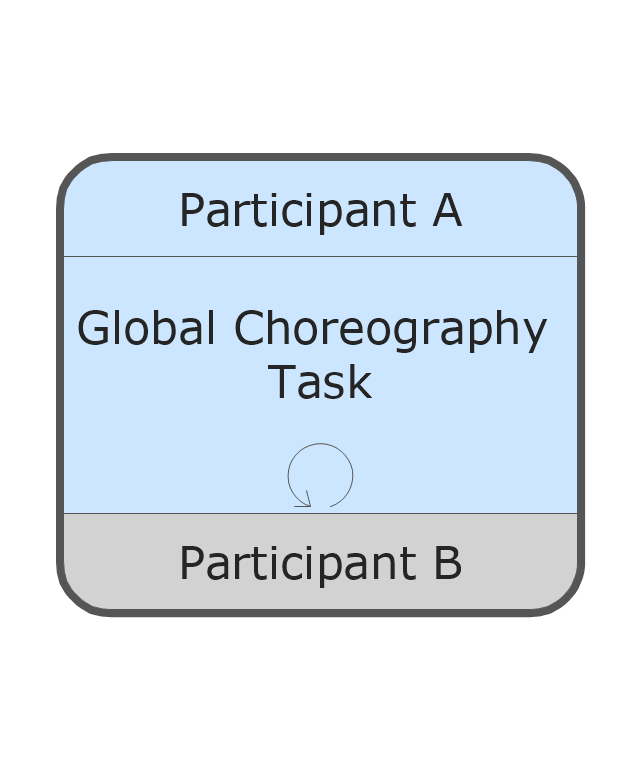
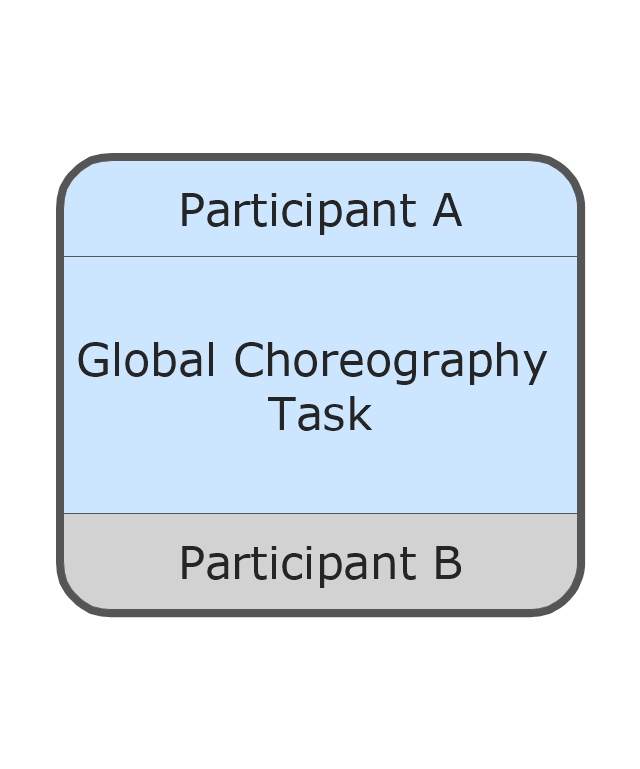
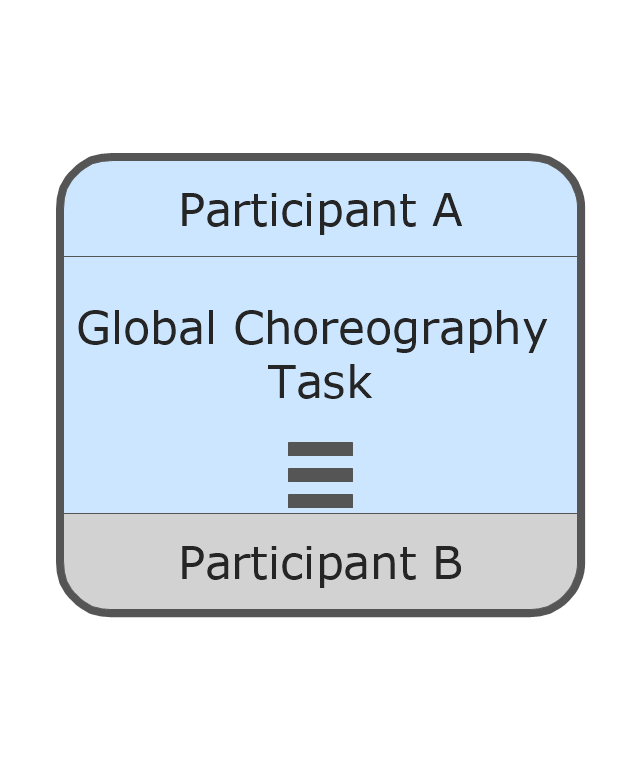
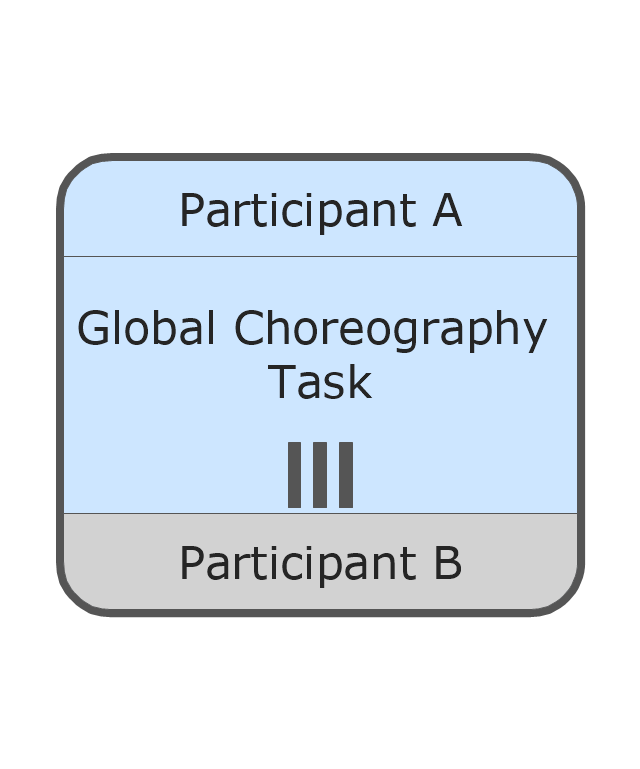
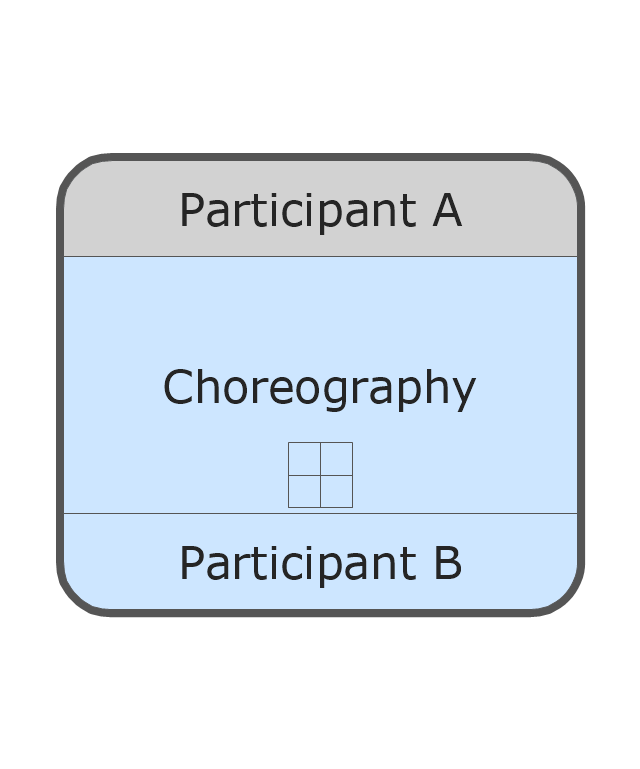
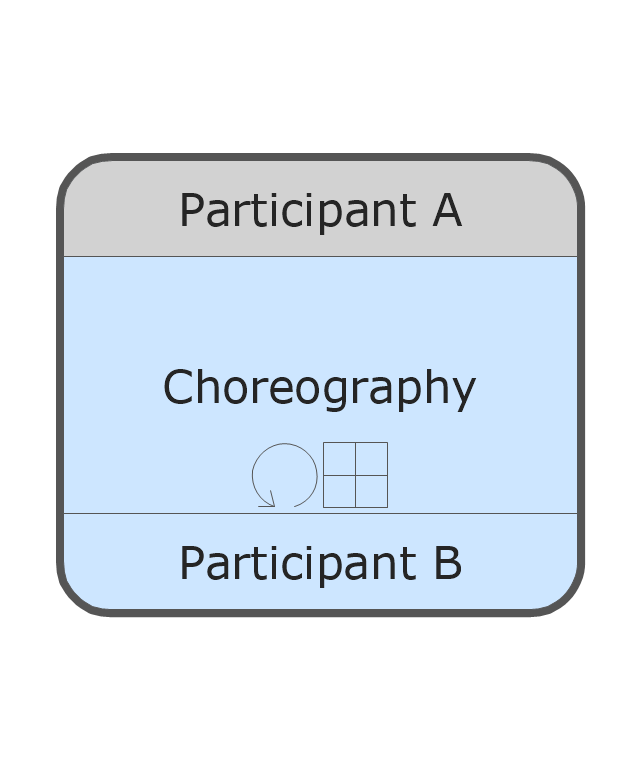
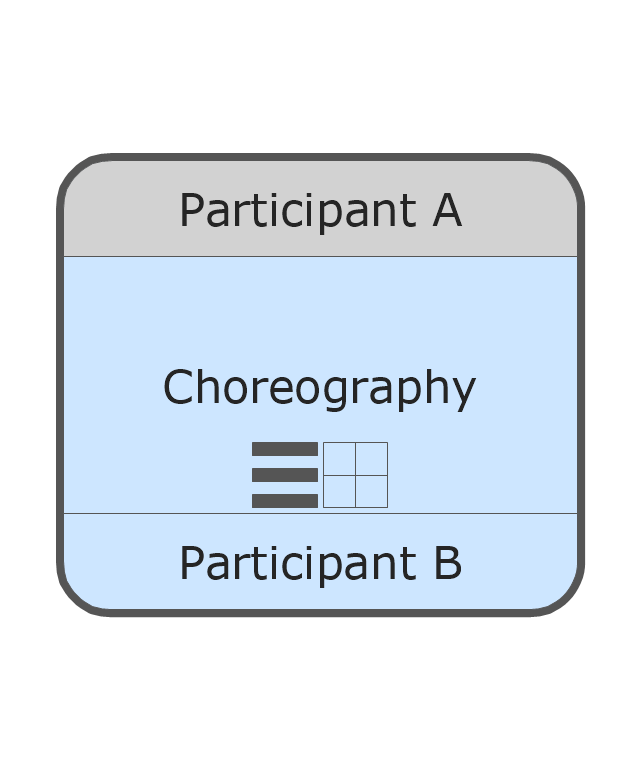
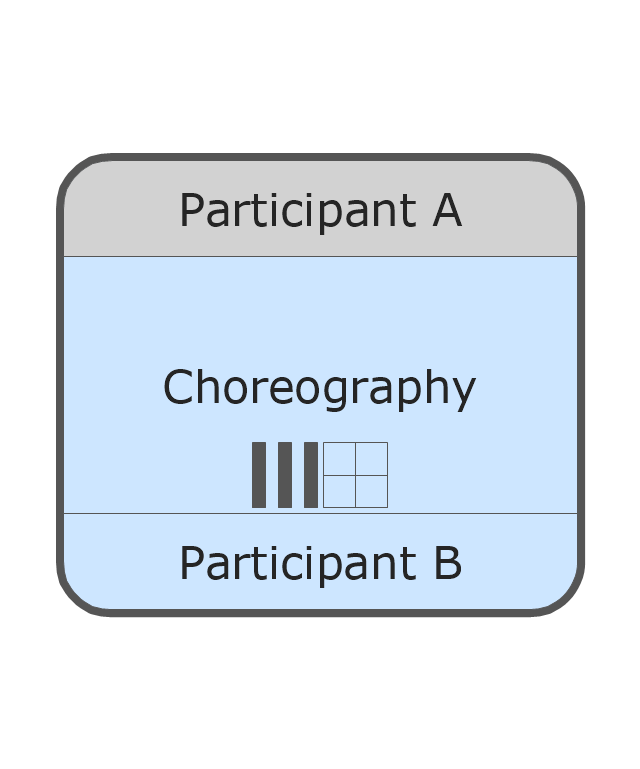
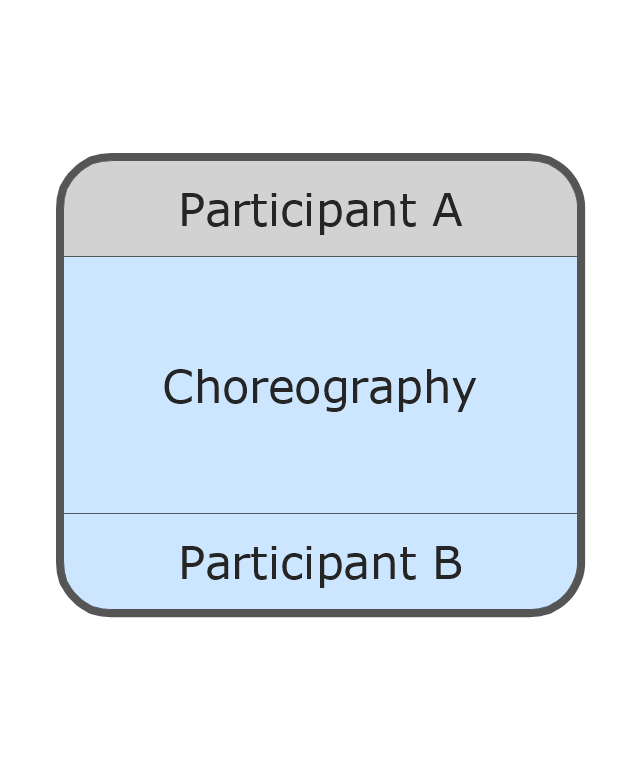
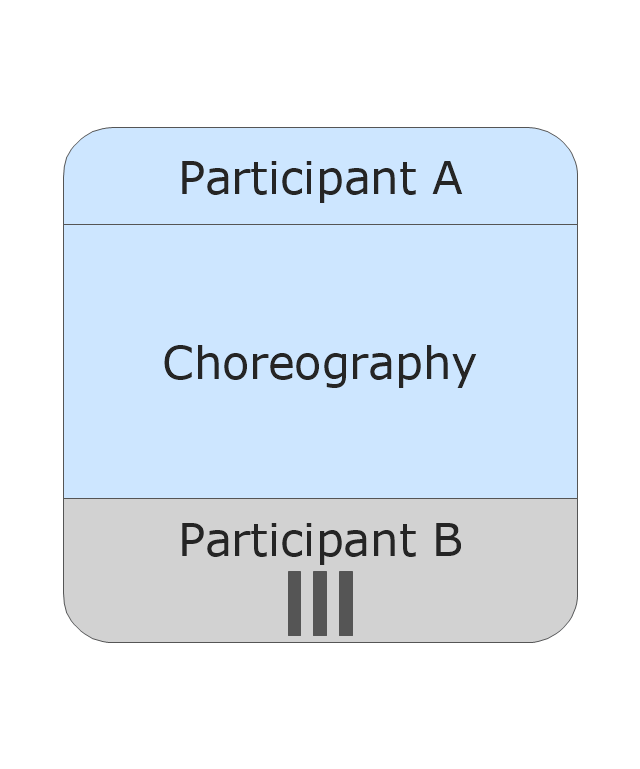
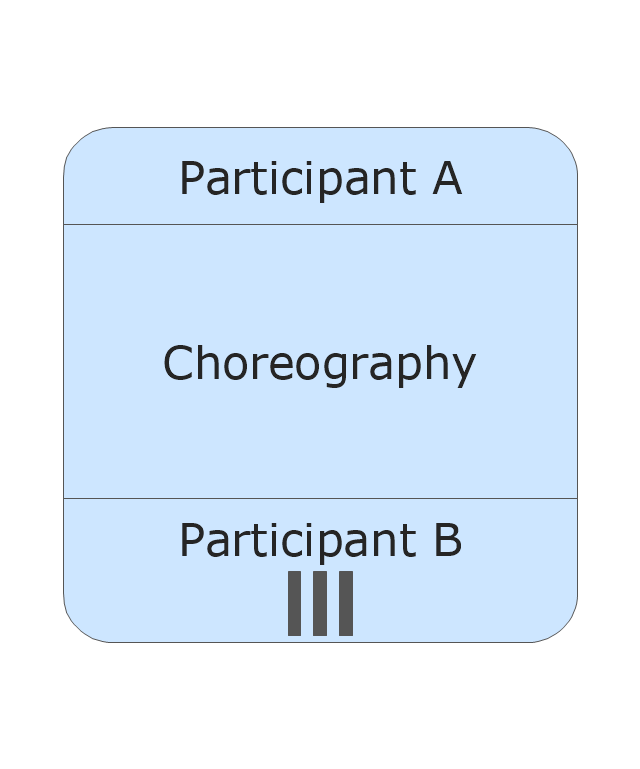
The vector stencils library "Choreographies" contains 28 choreography symbols.
Use it for drawing business process diagrams (BPMN 2.0) in the ConceptDraw PRO diagramming and vector drawing software extended with the Business Process Diagram solution from the Business Processes area of ConceptDraw Solution Park.
www.conceptdraw.com/ solution-park/ business-process-diagram
Use it for drawing business process diagrams (BPMN 2.0) in the ConceptDraw PRO diagramming and vector drawing software extended with the Business Process Diagram solution from the Business Processes area of ConceptDraw Solution Park.
www.conceptdraw.com/ solution-park/ business-process-diagram
The vector stencils library "Swimlanes" contains 20 swimlane symbol shapes.
Use it for drawing business process diagrams (BPMN 2.0) in the ConceptDraw PRO diagramming and vector drawing software extended with the Business Process Diagram solution from the Business Processes area of ConceptDraw Solution Park.
www.conceptdraw.com/ solution-park/ business-process-diagram
Use it for drawing business process diagrams (BPMN 2.0) in the ConceptDraw PRO diagramming and vector drawing software extended with the Business Process Diagram solution from the Business Processes area of ConceptDraw Solution Park.
www.conceptdraw.com/ solution-park/ business-process-diagram
The vector stencils library "Data" contains 10 data symbols: data object, collection data object, data input and output, data input and output collections, data store, initiating and non-initiating messages, data association.
Use these shapes for drawing business process diagrams (BPMN 2.0) using the ConceptDraw PRO diagramming and vector drawing software.
"Artifacts allow developers to bring some more information into the model/ diagram. In this way the model/ diagram becomes more readable. There are three pre-defined Artifacts and they are:
(1) Data objects: Data objects show the reader which data is required or produced in an activity.
(2) Group: A Group is represented with a rounded-corner rectangle and dashed lines. The group is used to group different activities but does not affect the flow in the diagram.
(3) Annotation: An annotation is used to give the reader of the model/ diagram an understandable impression." [Business Process Model and Notation. Wikipedia]
The example "Design elements - Data BPMN 2.0" is included in the Business Process Diagram solution from the Business Processes area of ConceptDraw Solution Park.
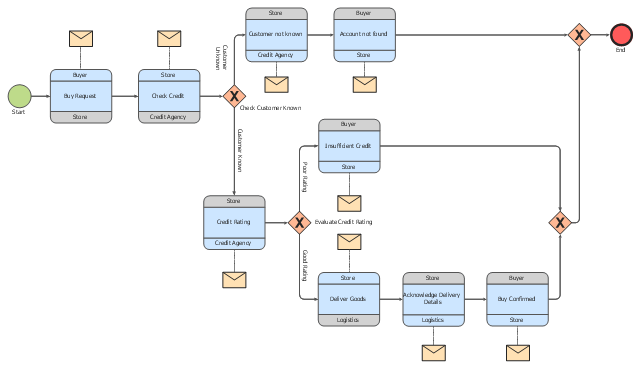
"Logistics is the management of the flow of goods between the point of origin and the point of consumption in order to meet some requirements, for example, of customers or corporations. The resources managed in logistics can include physical items, such as food, materials, animals, equipment and liquids, as well as abstract items, such as time, information, particles, and energy. The logistics of physical items usually involves the integration of information flow, material handling, production, packaging, inventory, transportation, warehousing, and often security. The complexity of logistics can be modeled, analyzed, visualized, and optimized by dedicated simulation software. The minimization of the use of resources is a common motivation in logistics for import and export." [Logistics. Wikipedia]
The BPMN 2.0 (Business Process Model and Notation) diagram example "Logistics" was created using the ConceptDraw PRO diagramming and vector drawing software extended with the Business Process Diagram solution from the Business Processes area of ConceptDraw Solution Park.
The BPMN 2.0 (Business Process Model and Notation) diagram example "Logistics" was created using the ConceptDraw PRO diagramming and vector drawing software extended with the Business Process Diagram solution from the Business Processes area of ConceptDraw Solution Park.
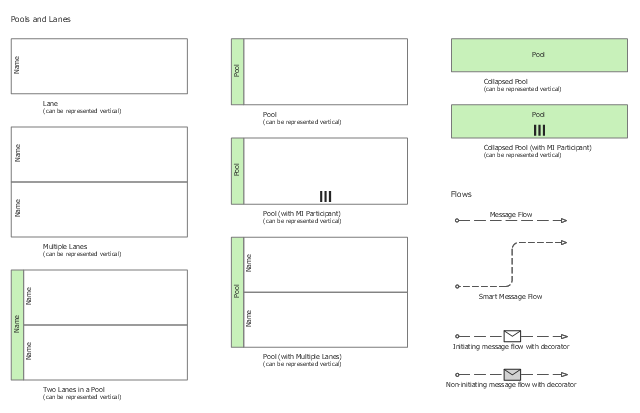
The vector stencils library "Swimlanes" contains 20 swimlane shapes for drawing business process diagrams (BPMN 2.0) using the ConceptDraw PRO diagramming and vector drawing software.
"Swim lanes are a visual mechanism of organising and categorising activities, based on cross functional flowcharting, and in BPMN consist of two types: (1) Pool. Represents major participants in a process, typically separating different organisations. A pool contains one or more lanes (like a real swimming pool). A pool can be open (i.e., showing internal detail) when it is depicted as a large rectangle showing one or more lanes, or collapsed (i.e., hiding internal detail) when it is depicted as an empty rectangle stretching the width or height of the diagram. (2) Lane. Used to organise and categorise activities within a pool according to function or role, and depicted as a rectangle stretching the width or height of the pool. A lane contains the flow objects, connecting objects and artifacts." [Business Process Model and Notation. Wikipedia]
The example "Design elements - Swimlanes BPMN 2.0" is included in the Business Process Diagram solution from the Business Processes area of ConceptDraw Solution Park.
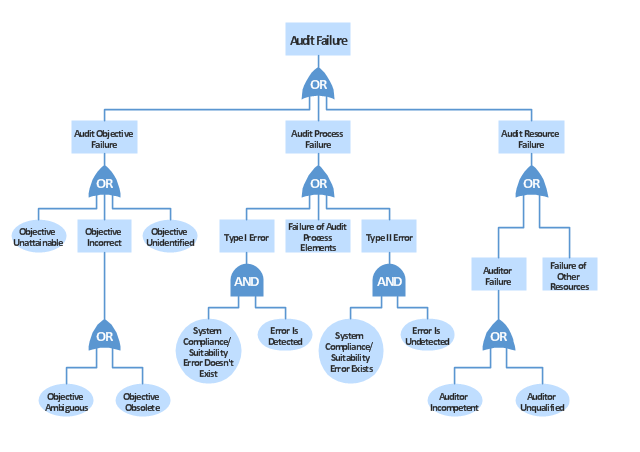
"Failure analysis is the process of collecting and analyzing data to determine the cause of a failure. It is an important discipline in many branches of manufacturing industry, such as the electronics industry, where it is a vital tool used in the development of new products and for the improvement of existing products. There are many companies which provide services to find the cause of failure in products, devices and in post disaster situations. The failure analysis process relies on collecting failed components for subsequent examination of the cause or causes of failure using a wide array of methods, especially microscopy and spectroscopy. The NDT or nondestructive testing methods (such as Industrial computed tomography scanning) are valuable because the failed products are unaffected by analysis, so inspection always starts using these methods." [Failure analysis. Wikipedia]
The example "Audit failure - Fault tree analysis diagram" was created using the ConceptDraw PRO diagramming and vector drawing software extended with the Fault Tree Analysis Diagrams solution from the Engineering area of ConceptDraw Solution Park.
The example "Audit failure - Fault tree analysis diagram" was created using the ConceptDraw PRO diagramming and vector drawing software extended with the Fault Tree Analysis Diagrams solution from the Engineering area of ConceptDraw Solution Park.
"A Guide to the Project Management Body of Knowledge - Fifth Edition provides guidelines for managing individual projects and defines project management related concepts. It also describes the project management life cycle and its related processes, as well as the project life cycle.
The Guide recognizes 47 processes that fall into five basic process groups and ten knowledge areas that are typical of almost all projects.
The five process groups are:
Initiating,
Planning,
Executing,
Monitoring and Controlling,
Closing.
The ten knowledge areas are:
Project Integration Management,
Project Scope Management,
Project Time Management,
Project Cost Management,
Project Quality Management,
Project Human Resource Management,
Project Communications Management,
Project Risk Management,
Project Procurement Management,
Project Stakeholders Management (added in 5th edition).
Each of the ten knowledge areas contains the processes that need to be accomplished within its discipline in order to achieve an effective project management program. Each of these processes also falls into one of the five basic process groups, creating a matrix structure such that every process can be related to one knowledge area and one process group." [A Guide to the Project Management Body of Knowledge. Wikipedia]
The flow chart example "Project management life cycle" was created using the ConceptDraw PRO diagramming and vector drawing software extended with the Flowcharts solution from the area "What is a Diagram" of ConceptDraw Solution Park.
The vector stencils library "Swimlanes" contains 20 swimlane symbol shapes.
Use it for drawing business process diagrams (BPMN 2.0) in the ConceptDraw PRO diagramming and vector drawing software extended with the Business Process Diagram solution from the Business Processes area of ConceptDraw Solution Park.
www.conceptdraw.com/ solution-park/ business-process-diagram
Use it for drawing business process diagrams (BPMN 2.0) in the ConceptDraw PRO diagramming and vector drawing software extended with the Business Process Diagram solution from the Business Processes area of ConceptDraw Solution Park.
www.conceptdraw.com/ solution-park/ business-process-diagram
The vector stencils library "Data" contains 10 data symbols: data object, collection data object, data input and output, data input and output collections, data store, initiating and non-initiating messages, data association.
Use these shapes for drawing business process diagrams (BPMN 2.0) in the ConceptDraw PRO diagramming and vector drawing software extended with the Business Process Diagram solution from the Business Processes area of ConceptDraw Solution Park.
www.conceptdraw.com/ solution-park/ business-process-diagram
Software development with ConceptDraw Products
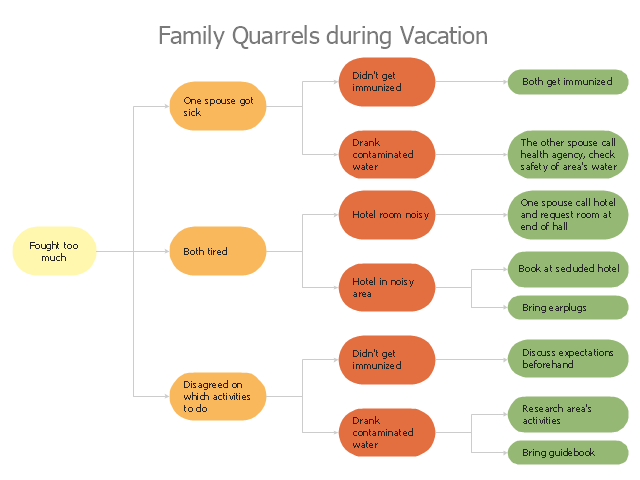
Internet solutions on ConceptDraw base. What may interest developers of Internet solutions."A root cause is an initiating cause of a causal chain which leads to an outcome or effect of interest. Commonly, root cause is used to describe the depth in the causal chain where an intervention could reasonably be implemented to change performance and prevent an undesirable outcome." [Root cause. Wikipedia]
"Problem-solving consists of using generic or ad hoc methods, in an orderly manner, for finding solutions to problems. Some of the problem-solving techniques developed and used in artificial intelligence, computer science, engineering, mathematics, medicine, etc. are related to mental problem-solving techniques studied in psychology." [Problem solving. Wikipedia]
This root cause analysis (RCA) tree diagram example "Personal problem solution" was created using the ConceptDraw PRO diagramming and vector drawing software extended with the Seven Management and Planning Tools solution from the Management area of ConceptDraw Solution Park.
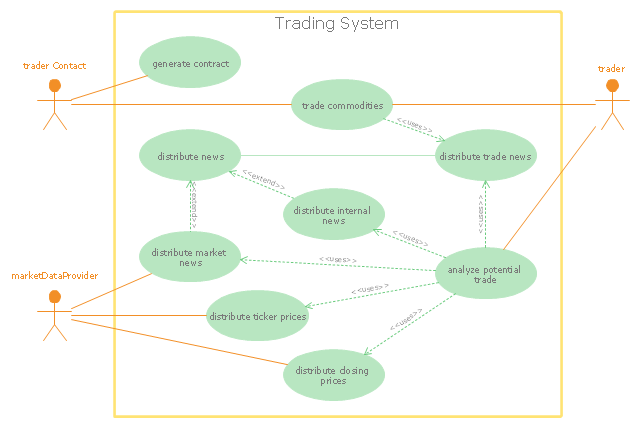
"Algorithmic trading, also called automated trading, black-box trading, or algo trading, is the use of electronic platforms for entering trading orders with an algorithm which executes pre-programmed trading instructions whose variables may include timing, price, or quantity of the order, or in many cases initiating the order by a "robot", without human intervention. Algorithmic trading is widely used by investment banks, pension funds, mutual funds, and other buy-side (investor-driven) institutional traders, to divide large trades into several smaller trades to manage market impact and risk. Sell side traders, such as market makers and some hedge funds, provide liquidity to the market, generating and executing orders automatically.
A special class of algorithmic trading is "high-frequency trading" (HFT), which is often most profitable during periods of high market volatility. During the past years, companies such as Algorates have employed HFT strategies, recording high profits even during periods in which the markets have seen steep declines." [Algorithmic trading. Wikipedia]
The UML use case diagram example "Trading system usage scenarios" was created using the ConceptDraw PRO diagramming and vector drawing software extended with the Rapid UML solution from the Software Development area of ConceptDraw Solution Park.
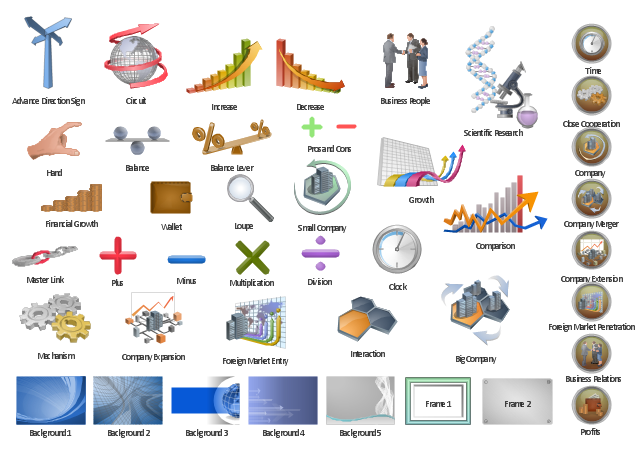
The vector clipart library "Presentation" design elements contains 45 symbols you can use to design your presentation slides and illustrations using the ConceptDraw PRO diagramming and vector drawing software.
"Although some think of presentations in a business meeting context, there are often occasions when that is not the case. For example, a non-profit organization presents the need for a capital fund-raising campaign to benefit the victims of a recent tragedy; a school district superintendent presents a program to parents about the introduction of foreign-language instruction in the elementary schools;an artist demonstrates decorative painting techniques to a group of interior designers; a horticulturist shows garden club members or homeowners how they might use native plants in the suburban landscape; a police officer addresses a neighborhood association about initiating a safety program. ...
A study done by Wharton School Of Business showed that the use of visuals reduced meeting times by 28 percent. Another study found that audiences believe presenters who use visuals are more professional and credible than presenters who merely speak. Other research indicates that meetings and presentations reinforced with visuals help participants reach decisions and consensus more quickly." [Presentation. Wikipedia]
The clip art example "Design elements - Presentation symbols" is included in the Presentation Clipart solution from the Illustration area of ConceptDraw Solution Park.
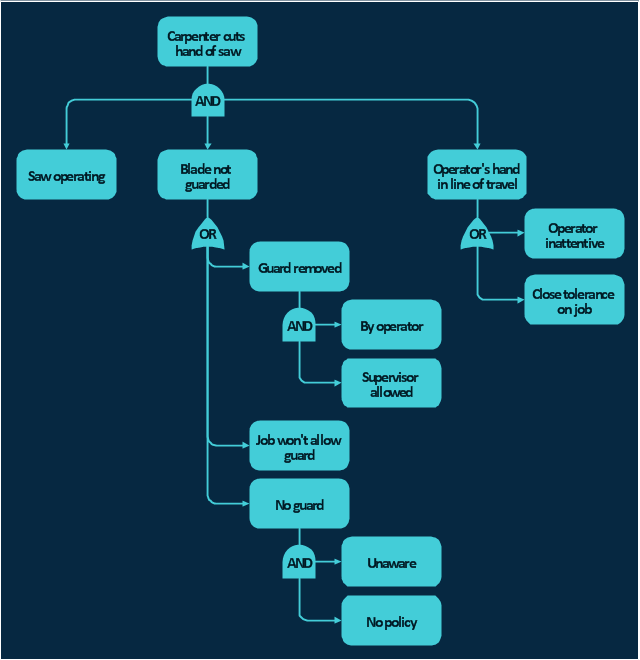
The FTA diagram example "Hazard analysis" was redesigned from the illustration of the article "Hazard Analysis Methodologies" from the Occupational Safety & Health Administration (OSHA) website.
"A fault tree analysis is a quantitative assessment of all of the undesirable outcomes, such as a toxic gas release or explosion, which could result from a specific initiating event. It begins with a graphic representation (using logic symbols) of all possible sequences of events that could result in an incident. The resulting diagram looks like a tree with many branches — each branch listing the sequential events (failures) for different independent paths to the top event. Probabilities (using failure rate data) are assigned to each event and then used to calculate the probability of occurrence of the undesired event. ...
This technique is particularly useful in evaluating the effect of alternative actions on reducing the probability of occurrence of the undesired event."
[osha.gov/ SLTC/ etools/ safetyhealth/ mod4_ tools_ methodologies.html]
The FTA diagram example "Hazard analysis" was created using the ConceptDraw PRO diagramming and vector drawing software extended with the Fault Tree Analysis Diagrams solution from the Engineering area of ConceptDraw Solution Park.
- Initiating Message Flow with Decorator
- Non- Initiating Message Flow with Decorator - Conceptdraw.com
- Initiating Message - Conceptdraw.com
- Non- Initiating Message - Conceptdraw.com
- Choreography - MI Participant - Initiating - Conceptdraw.com
- Design elements - Swimlanes BPMN 2.0 | Business process swim ...
- FTA diagram - Hazard analysis | Accident analytic tree - FTA ...
- Choreography BPMN 2.0 diagram - Logistics | Collaboration BPMN ...
- Fault tree diagram
- Fault tree analysis (FTA) diagram template | Fault Tree Diagram ...
- Fault tree analysis diagram | Seven Management and Planning ...
- Choreography BPMN 2.0 diagram - Logistics | Conversation BPMN ...
- Fault tree analysis diagram
- Business Process Modeling Software for Mac | Design elements ...
- Audit failure - Fault tree analysis diagram | Design elements - Fault ...
- Flowchart - Product life cycle process | Flowchart - Project ...
- Business process diagram BPMN 1.2 - Hiring process | Business ...
- Swimlanes - Vector stencils library
- Pictorial concepts - Clip art | Illustration | How to Create a Custom ...
- Data - Vector stencils library


-swimlanes---vector-stencils-library.png--diagram-flowchart-example.png)

-swimlanes---vector-stencils-library.png--diagram-flowchart-example.png)

-swimlanes---vector-stencils-library.png--diagram-flowchart-example.png)

-swimlanes---vector-stencils-library.png--diagram-flowchart-example.png)
-swimlanes---vector-stencils-library.png--diagram-flowchart-example.png)
-swimlanes---vector-stencils-library.png--diagram-flowchart-example.png)









-choreographies---vector-stencils-library.png--diagram-flowchart-example.png)


