Interactive Voice Response System
How to represent the Interactive Voice Response System? The commonly used way is to draw the IVR diagram. You can draw it manually in a graphic editor, but ConceptDraw DIAGRAM diagramming and vector drawing software offers you the more effective way - to use the powerful tools of the Interactive Voice Response Diagrams Solution for ConceptDraw Solution Park.Voice Actors
ConceptDraw DIAGRAM extended with Interactive Voice Response Diagrams Solution is a powerful software which provides a set of helpful tools for designing IVR and VoIP diagrams and visual representing the voice actors on them.
 Interactive Voice Response Diagrams
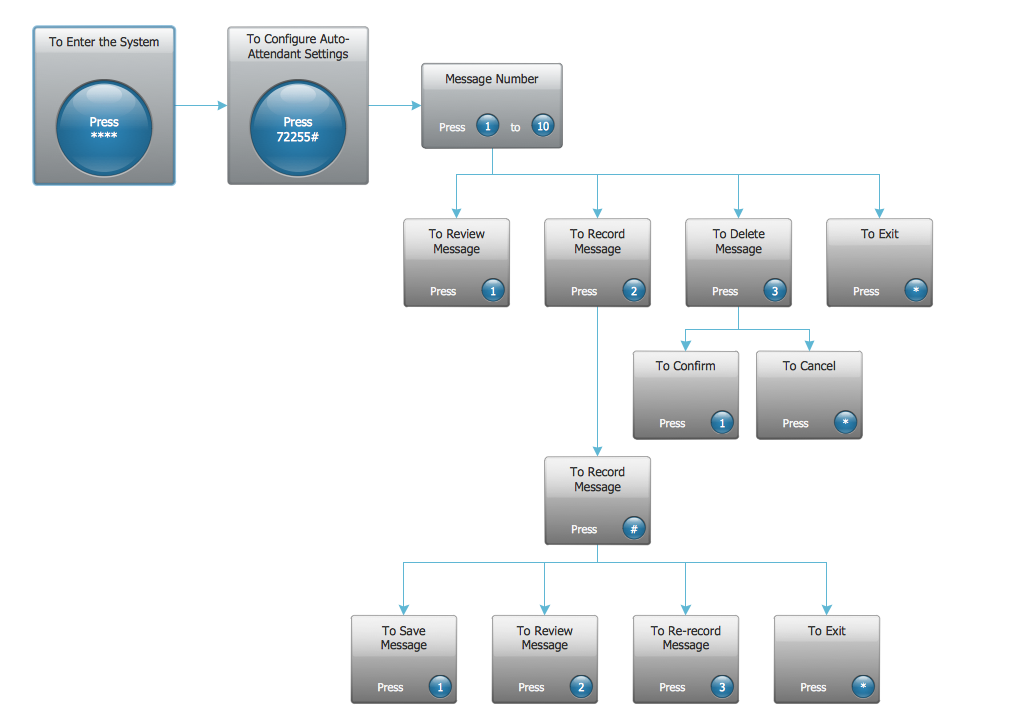
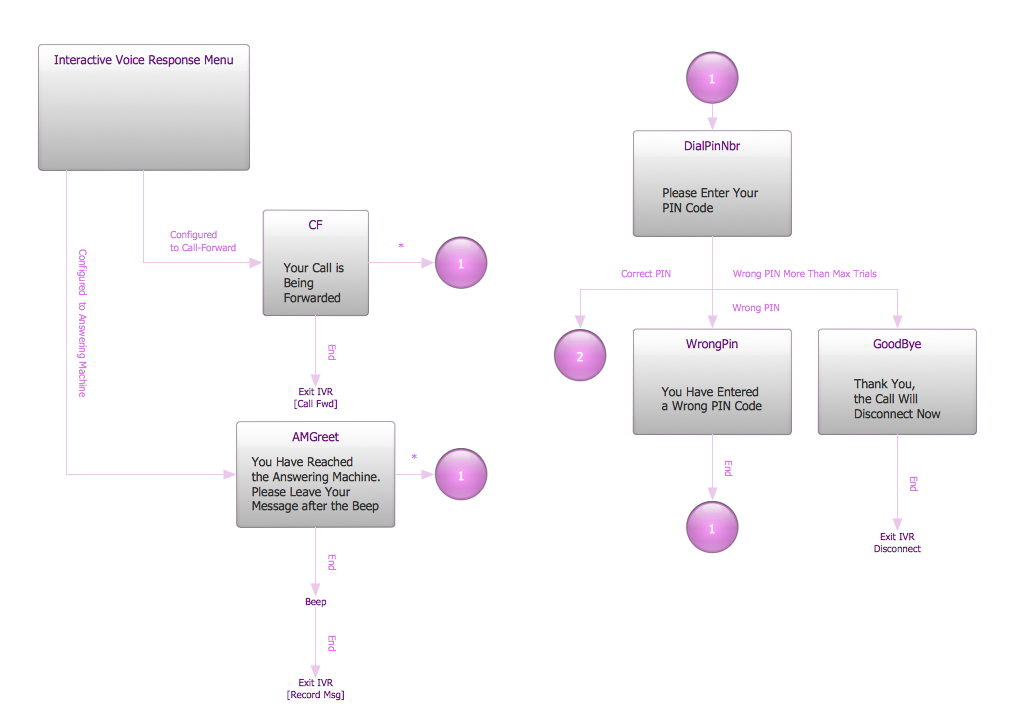
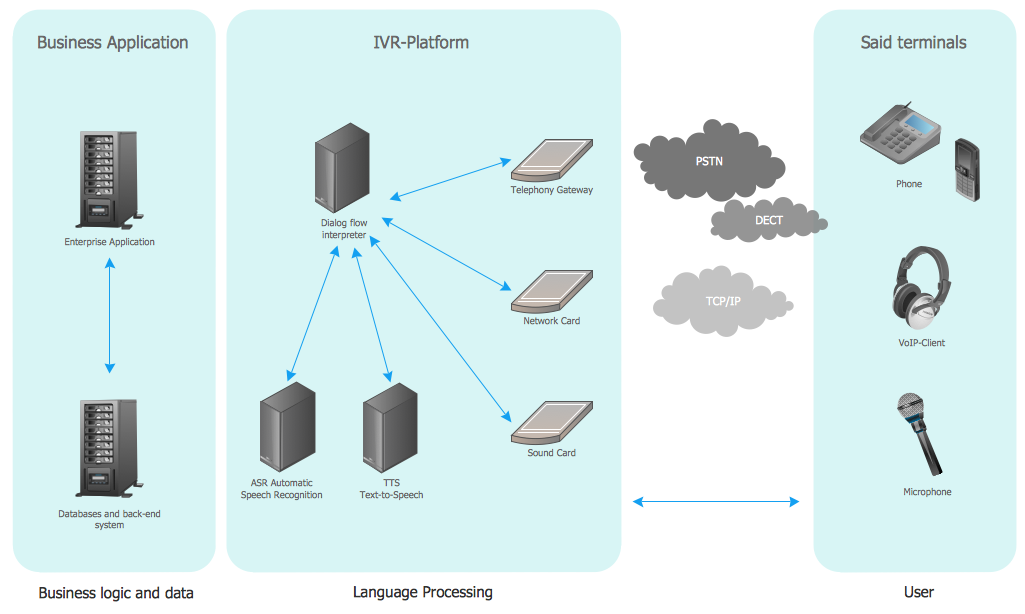
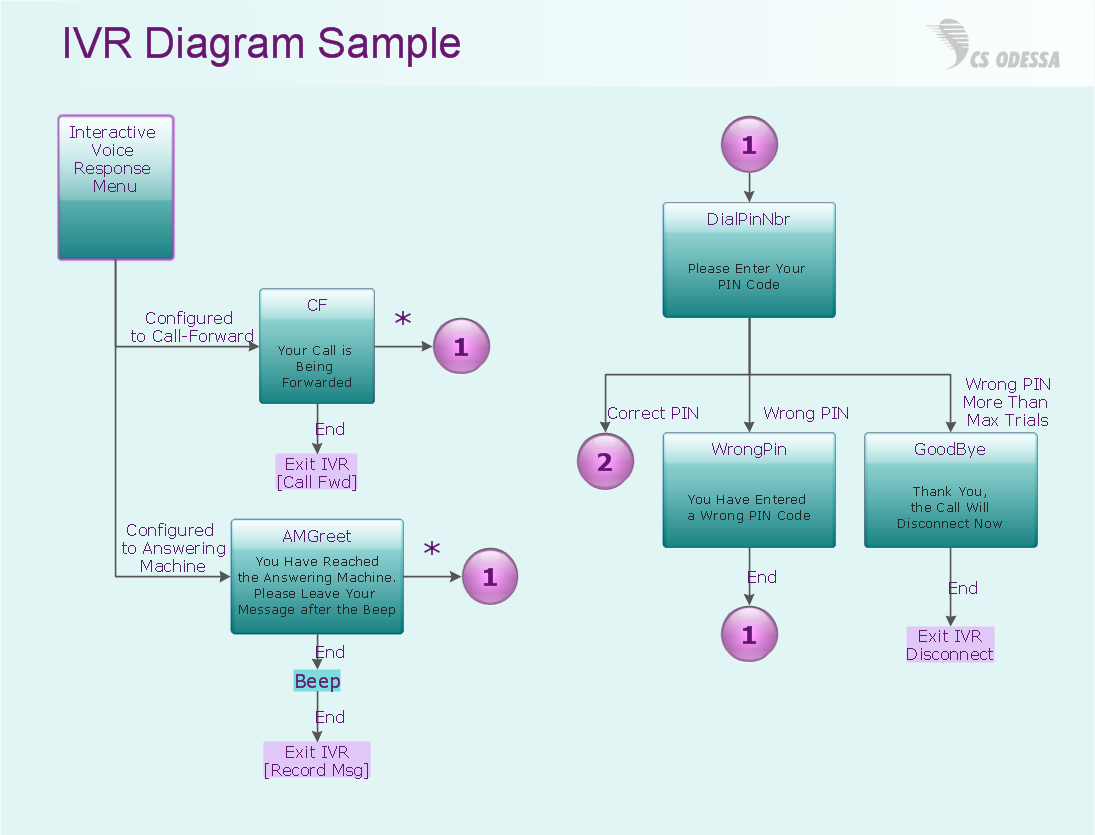
Interactive Voice Response Diagrams solution extends ConceptDraw DIAGRAM software with samples, templates and libraries of ready-to-use vector stencils that help create Interactive Voice Response (IVR) diagrams illustrating in details a work of interactive voice response system, the IVR system’s logical and physical structure, Voice-over-Internet Protocol (VoIP) diagrams, and Action VoIP diagrams with representing voice actions on them, to visualize how the computers interact with callers through voice recognition and dual-tone multi-frequency signaling (DTMF) keypad inputs.
IVR Systems
ConceptDraw DIAGRAM extended with Interactive Voice Response Diagrams Solution from the Computer and Networks Area enables to make quick and effective drawing the IVR diagrams describing the IVR systems of any complexity quick and effective.IVR
ConceptDraw DIAGRAM is a powerful diagramming and vector drawing software. Now, supplied with Interactive Voice Response Diagrams solution from the Computer and Networks area, ConceptDraw DIAGRAM became ideal for construction the IVR diagrams.HelpDesk
How to Create an Interactive Voice Response (IVR) Diagram
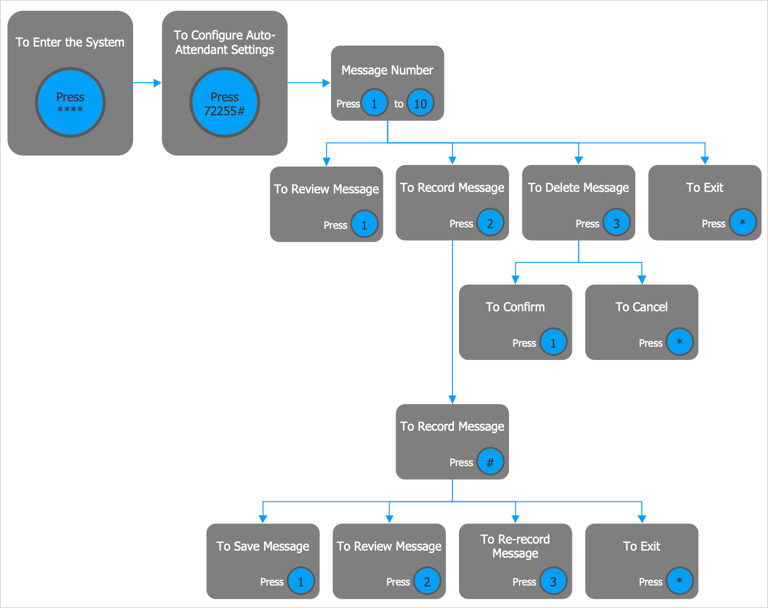
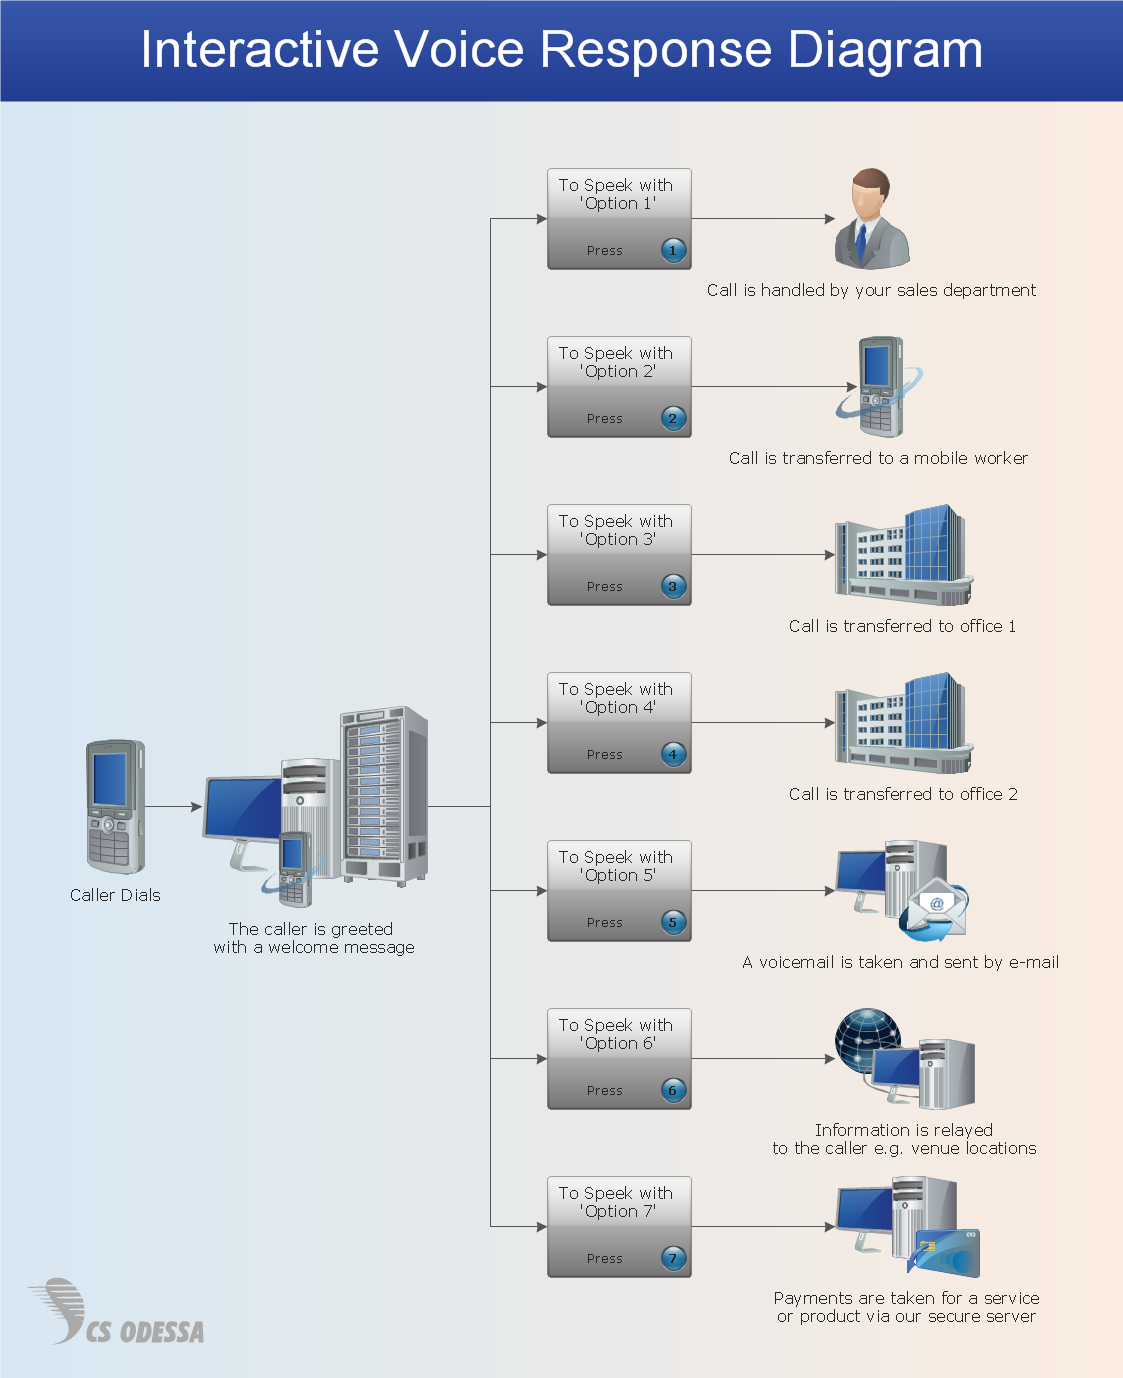
Interactive Voice Response (IVR) Diagram is used to create and conduct the Interactive Voice Response systems for call-centers and voice mail services. IVR diagrams intended to visualize the logical and physical structure of Interactive voice response systems. ConceptDraw solution for Interactive Voice Response (IVR) Diagram allows you to create and communicate the Interactive Voice Response diagram of any complexity. Interactive Voice Response (IVR) System is a telecommunication technology that enables a computer to automatically process voice and touch phone signals. IVR systems allows users to interact through a computer with various service systems, available by telephone. The objective of IVR system is to reduce customer service costs by delivering self service to customers and guiding them to the information that they look for.What is IVR?
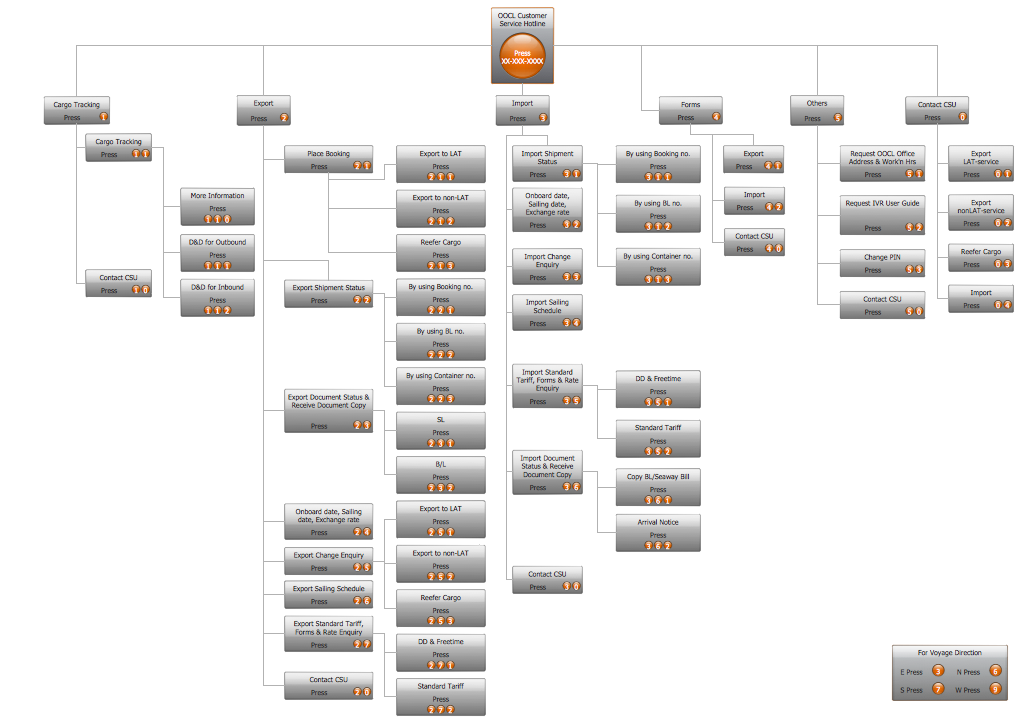
What is IVR? The Interactive voice response (IVR) is a popular and widely used technology which allows a computer to detect voice and keypad inputs, so it makes possible the interactions between computer and humans through the use of voice and dual-tone multi-frequency (DTMF) signals. For illustrating the logical and physical structure of IVR systems are used the IVR diagrams. ConceptDraw DIAGRAM software extended with Interactive Voice Response Diagrams solution allows you to make the IVR Diagrams quickly and easily.Interactive voice response (IVR) networks. Computer and Network Examples
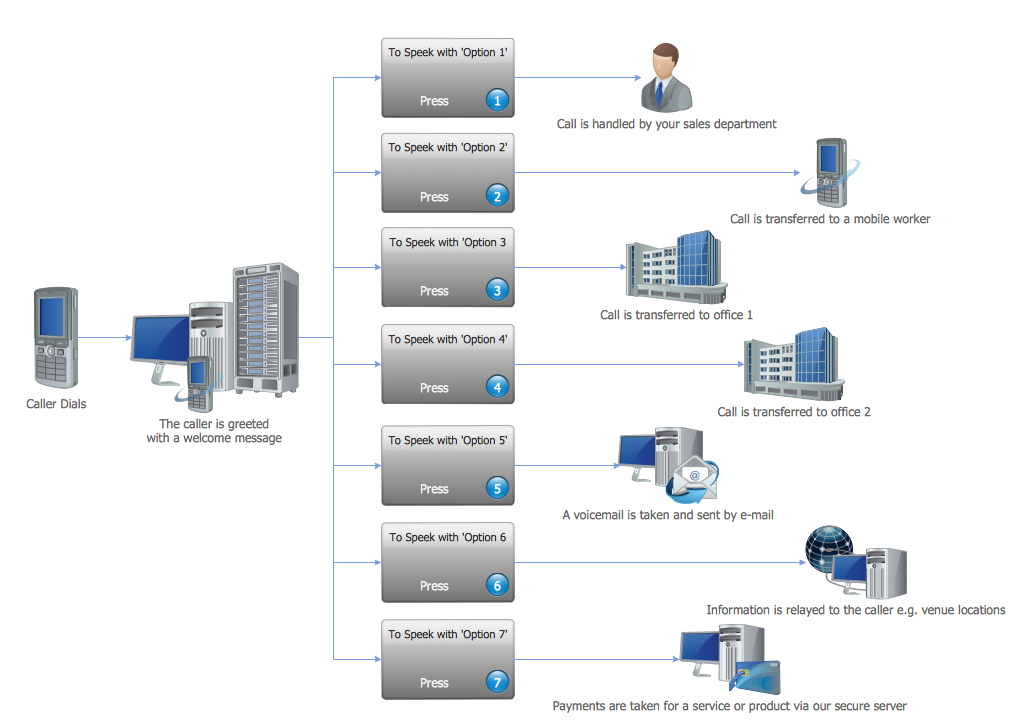
Interactive Voice Response (IVR) is a system of the prerecorded voice messages that allows a computer to interact with humans. IVR performs the function of the routing calls within a call center, using the information entered by the customer on the phone keypad in the touchtone mode. This example was created in ConceptDraw DIAGRAM using the Computer and Networks Area of ConceptDraw Solution Park and show the Interactive Voice Response (IVR) network.
Data Flow Diagram Examples
Data flow diagrams (DFDs) are effective to reveal relationships among the various components in a program or system. This type of diagrams is an important and useful technique for modeling an information system, its process aspects, for showing a system as a single high-level process. DFD lets illustrate the flow of data, how the input data are transformed to output results across the sequence of functional transformations. DFD consists of four major components: entities, processes, data stores, data flows. When you need to draw a Data Flow Diagram the ConceptDraw DIAGRAM diagramming and vector drawing software extended with Data Flow Diagrams solution will be helpful for you. Providing numerous collection of Data Flow Diagram examples, samples, templates and ready-to-use vector DFD symbols, Data Flow Diagrams solution ensures you with all needed tools for easy designing DFDs according to Gane-Sarson or Yourdon-Coad notation on your choice. Any from offered predesigned DFD examples can become a perfect base for your own diagram.Network VOIP. Computer and Network Examples
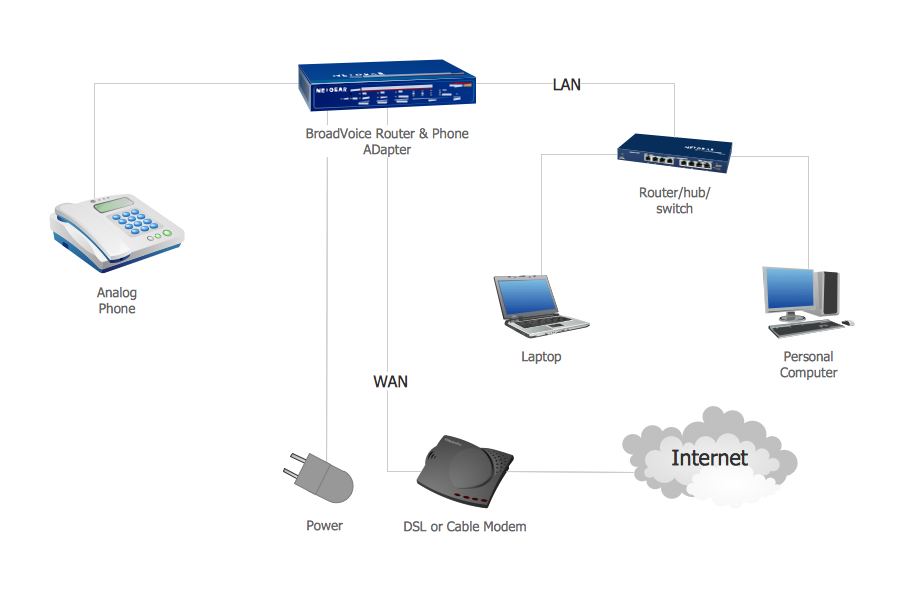
Voice-over-Internet protocol (VoIP) is a protocol of the voice communications and multimedia sessions through the Internet or other packet-switched networks. VoIP systems use the data compression techniques, encapsulated in a data-packet stream over IP. They allows users to use regular telephone networks through any internet service provider and anywhere. VoIP is also called IP telephony, Internet telephony, Voice over broadband (VoBB). This example was created in ConceptDraw DIAGRAM using the Computer and Networks Area of ConceptDraw Solution Park and shows the VoIP Network.
Netflow architecture. Computer and Network Examples
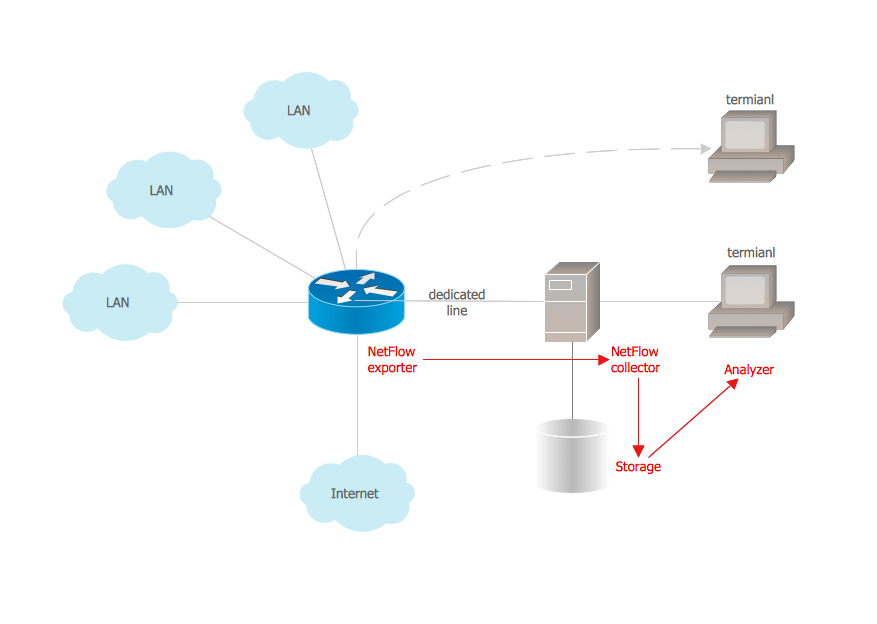
Netflow is a network protocol used for accounting the IP network traffic. It was developed by Cisco Systems. Now it is actually the industrial standard, it is supported by many devices. There are several versions of the protocol, but the most common are the versions 5 and 9. This diagram was created in ConceptDraw DIAGRAM using the Computer and Networks Area of ConceptDraw Solution Park and shows the Netflow architecture.
Database Design
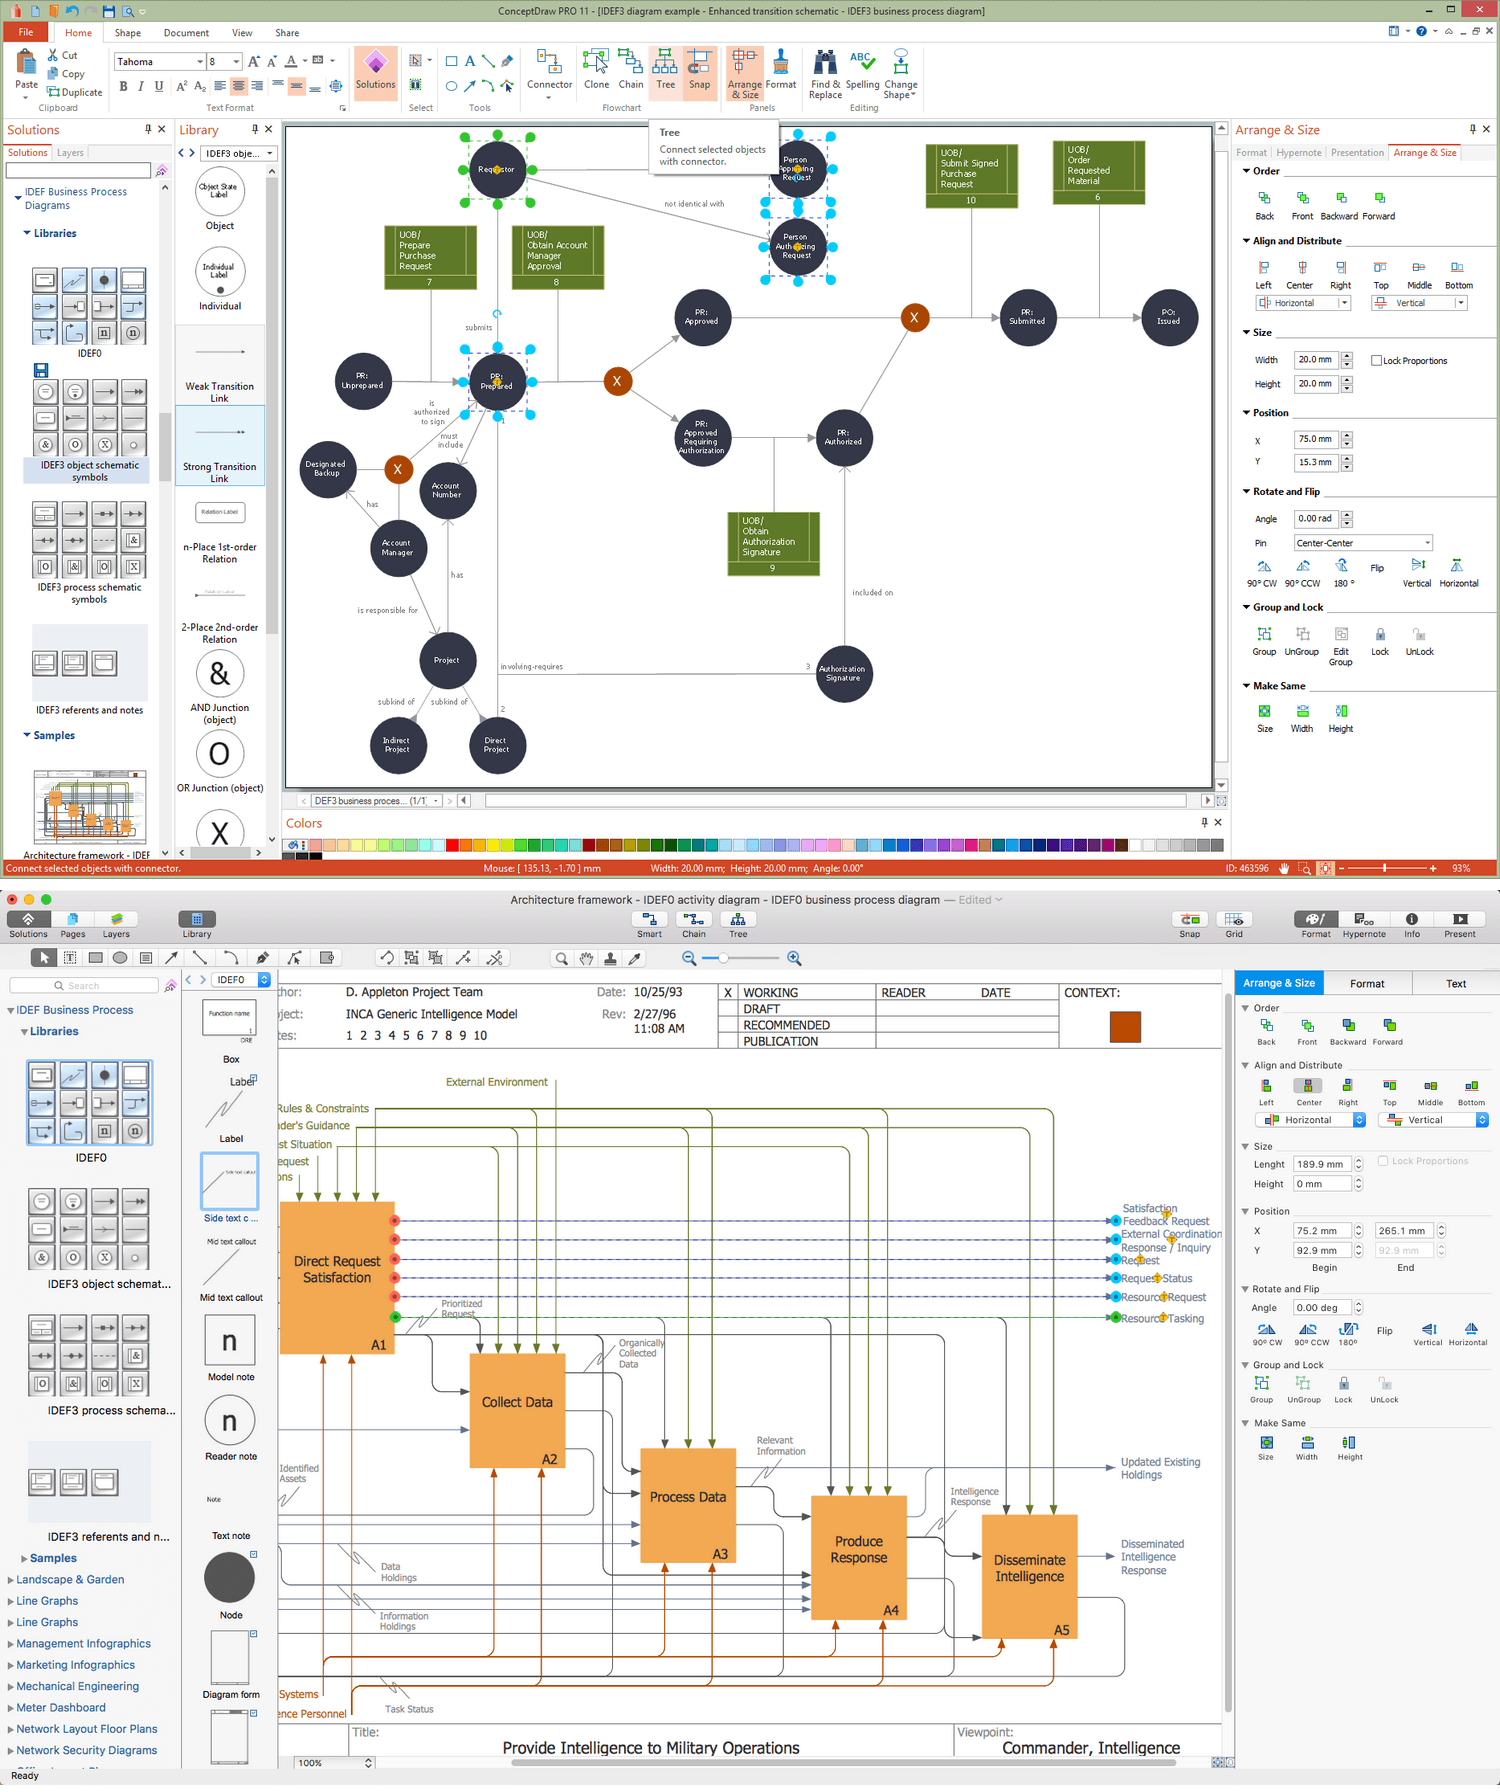
ConceptDraw DIAGRAM extended with IDEF Business Process Diagrams solution from the Business Processes area of ConceptDraw Solution Park is an ideal software for effective database design and drawing IDEF diagrams visually representing all steps of database design process.
 Soccer
The Soccer (Football) Solution extends ConceptDraw DIAGRAM.5 (or later) software with samples, templates, and libraries of vector objects for drawing soccer (football) diagrams, plays schemas, and illustrations. It can be used to make professional looking
- Ivr Architecture Ppt
- What is IVR ? | Network Diagram Software IVR Services | Voice ...
- Ivr System Ppt Images
- Interactive Voice Response System
- Ppt On Ivr Banking System
- All Bank Ivr Chart Flow In Ppt
- Interactive Voice Response Diagrams | What is IVR ? | IVR Systems ...
- IVR Systems | Interactive Voice Response Diagrams | How to Create ...
- Interactive Voice Response Diagrams | Network Topologies ...
- IVR flowchart - Store reporting
- Interactive Voice Response Diagrams | How to Create an Interactive ...
- HVAC Plans | How to Add a Block Diagram to a PowerPoint ...
- Wireless And Mobile Networks Ppt
- IVR flowchart - Store reporting | How to Create an Interactive Voice ...
- Er Diagram Of Restaurent Mgmt System Ppt File
- Network Structure Diagram In Powerpoint
- How to Add a Block Diagram to a PowerPoint Presentation Using ...
- Interactive Voice Response Network Diagram | Network ...
- Interactive Voice Response Diagrams | Interactive Venn Diagram ...
- Interactive Voice Response Diagrams | How to Create an Interactive ...
