Network Diagram Software LAN Network Diagrams & Diagrams for LAN Physical Office Network Diagrams
Physical LAN Diagrams illustrate the communication schemes of Local Area Networks, the physical network connection of computers and networks arrangement on the small areas - at homes, offices, and other buildings. ConceptDraw PRO is a perfect network diagramming software with samples and examples of WAN and LAN Diagrams, templates and collection of network components libraries. Computer Network Diagrams Solution for ConceptDraw PRO Mac and Windows is ideal for IT professionals, network engineers and network designers who need to visualize network architecture, to document LANs physical structure and arrangement, to draw Local Area Network (LAN) diagrams and schematics, WAN diagrams, physical office network diagrams and topologies, wiring drawings, etc. You can design all them easy using the predesigned vector objects of computers and computer network devices, hardware devices, peripheral devices, external digital devices, internet and logical symbols, and many other stencils from the Computer Network Diagrams libraries. ConceptDraw PRO offers a powerful and easy-to-use solution for those who looking for a Visio alternative for Mac. It is a world-class diagramming platform with dynamic presentation power.
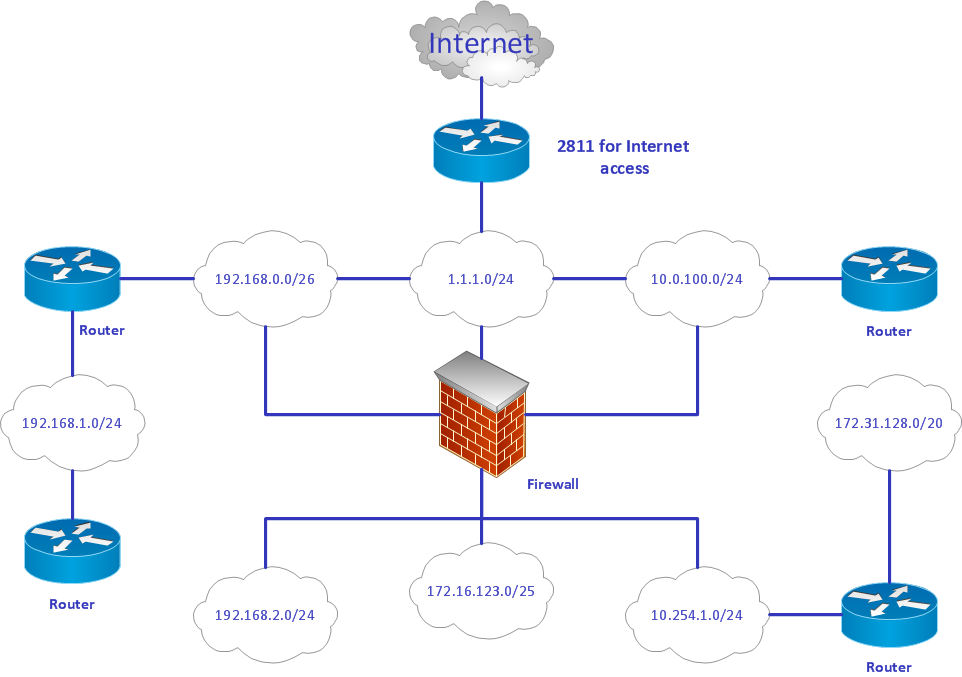
Diagram of a Basic Computer Network. Computer Network Diagram Example
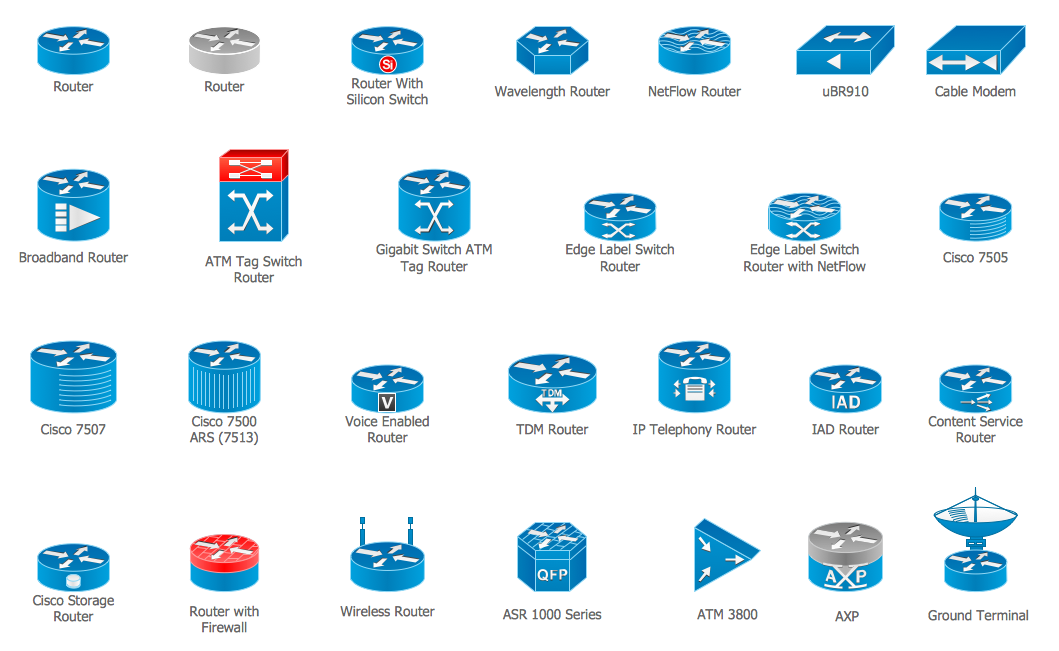
This sample was created in ConceptDraw PRO diagramming and vector drawing software using the Computer and Networks solution from Computer and Networks area of ConceptDraw Solution Park. This sample shows the connection scheme of the home WLAN equipment to the Internet.Cisco Routers. Cisco icons, shapes, stencils and symbols
Network infrastructure planning is a very important process in the network construction, and the share of time allocated to this within the scope of the entire project may reach 60-80%. A competent and thorough approach to planning contributes to the quick investment return, and also increases the reliability and flexibility of the final system, reducing the probability of additional costs related to the incorrect implementation. Any planning begins with an analysis of the business requirements to the final system. Basic network parameters, which should be assessed are the scalability, accessibility, cost, speed and safety. Speed and cost are often mistaken for the most important parameters, and the rest of the parameters aren't even remembered. This is not entirely correct. Initially, it is necessary to assess the business plans for the future, because sometimes it is more profitable to invest more money in the beginning. If the business is to develop, then, consequently, demands onProcess Flowchart
The main reason of using Process Flowchart or PFD is to show relations between major parts of the system. Process Flowcharts are used in process engineering and chemical industry where there is a requirement of depicting relationships between major components only and not include minor parts. Process Flowcharts for single unit or multiple units differ in their structure and implementation. ConceptDraw PRO is Professional business process mapping software for making Process flowcharts, Process flow diagram, Workflow diagram, flowcharts and technical illustrations for business documents and also comprehensive visio for mac application. Easier define and document basic work and data flows, financial, production and quality management processes to increase efficiency of your business with ConcepDraw PRO. Business process mapping software with Flowchart Maker ConceptDraw PRO includes extensive drawing tools, rich examples and templates, process flowchart symbols and shape libraries, smart connectors that allow you create the flowcharts of complex processes, process flow diagrams, procedures and information exchange. Process Flowchart Solution is project management workflow tools which is part ConceptDraw Project marketing project management software. Drawing charts, diagrams, and network layouts has long been the monopoly of Microsoft Visio, making Mac users to struggle when needing such visio alternative like visio for mac, it requires only to view features, make a minor edit to, or print a diagram or chart. Thankfully to MS Visio alternative like ConceptDraw PRO software, this is cross-platform charting and business process management tool, now visio alternative for making sort of visio diagram is not a problem anymore however many people still name it business process visio tools.
HelpDesk
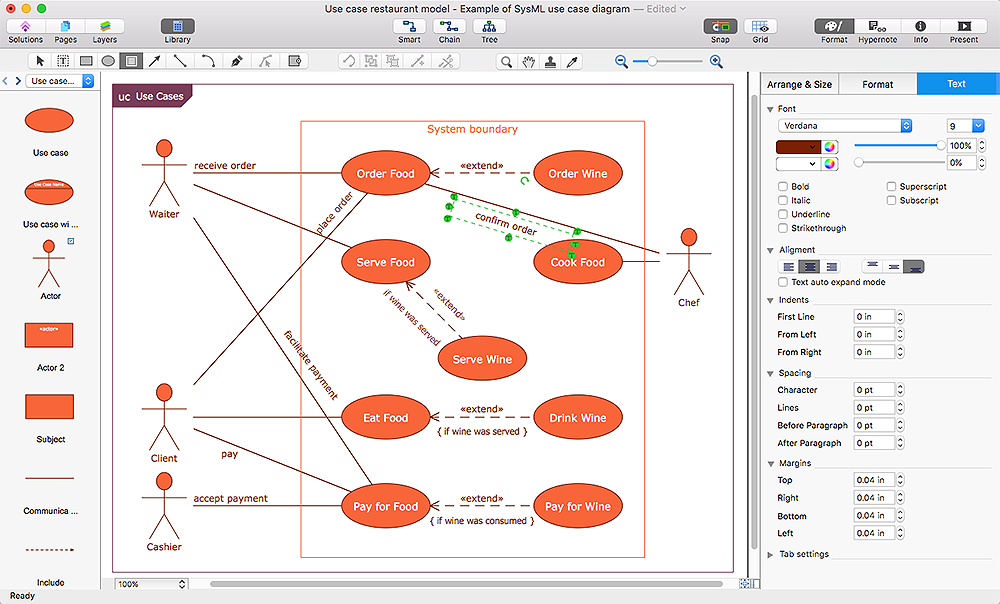
How to Add and Edit Text on Connectors
The new ConceptDraw Arrows10 Technology is a powerful diagramming technique that powered the way business drawing created. ConceptDraw PRO gives you some tools for connecting shapes: Direct Connectors, Smart, Arc, Bezier, Curve and Round Connectors.Direct Connectors are direct lines from the point to the point. Smart , Arc, Bezier, Curve and Round Connectors are almost the same as Direct Connectors. However, they automatically move around other objects. You can use Chain, or Tree connection mode for connection of multiple objects with any type of connectors. ConceptDraw PRO allows you to add and move text on a connector the same way that you add and move text on other any object.Local area network (LAN). Computer and Network Examples
Local Area Network (LAN) is a network which consists of computers and peripheral devices connected each other and to the local domain server, and covers a little territory or small number of buildings, such as home, school, laboratory, office, etc. LAN serves for few hundreds of users. It includes many cables and wires, and demands to design previously a Network diagram. All local area network devices can use the shared printers and disk storage. ConceptDraw PRO is a perfect network diagramming software with examples of LAN Diagrams, templates and predesigned vector objects. ConceptDraw PRO is the ideal choice for network engineers and network designers who need to draw fast and easy Local Area Network Diagrams, for IT specialists, developers and other IT professionals which need to visualize the communication schemes of LAN and visually document the LAN's physical structure and arrangement in houses, offices and other buildings. Ready-to-use vector objects from Computer Network Diagrams solution will help you design LAN diagrams in minutes.
Pyramid Diagram
Pyramid diagrams help you visualize information as a triangle divided into horizontal slices. Labelled slices represent a hierarchy. Pyramids are used in marketing presentations to show and analyze hierarchy levels. 3D triangular diagram of DIKW pyramid has 6 levels: measurement, facts, data, information, knowledge, wisdom. The data component include different scattered signs or symbols which are merely useless until these random objective facts are somehow processed. Data is a resource which has to be manipulated or rearranged to get useful. Information can be extracted from a pile of data, it also can be mined from different data storages.Produce Professional Diagrams More Quickly, Easily and Cost Effectively
ConceptDraw Arrows10 Technology - This is more than enough versatility to produce professional diagrams more quickly. Professional diagramming software for mac helps you create variety diagrams, graphics, charts, live dashboards and plenty of graphics and pictures for your business and study.Star Network Topology
Star is a basic computer network topology in which all nodes (computers and peripheral devices) of the network are connected to the central hub or switch with a point-to-point connection, forming a physical network segment. Such network segment can function separately or as a part of complex network topology. The switch is a server, the peripherals are the clients. The large workload and functions of network management are entrusted on the central computer, all information exchange goes through it, so it must to be obligatory the most powerful. The star network topology is a simple topology for design and implementation. Its advantages are high performance, flexible administration capabilities, simplicity of adding additional nodes and search of faults, the fact that a failure of one workstation doesn't affect the work of entire network. But the failure of central hub will result the failure of whole network or network segment - it's the main disadvantage. Use the ConceptDraw PRO with Computer and Networks solution to designing Star Network Topology Diagrams fast and easy.
HelpDesk
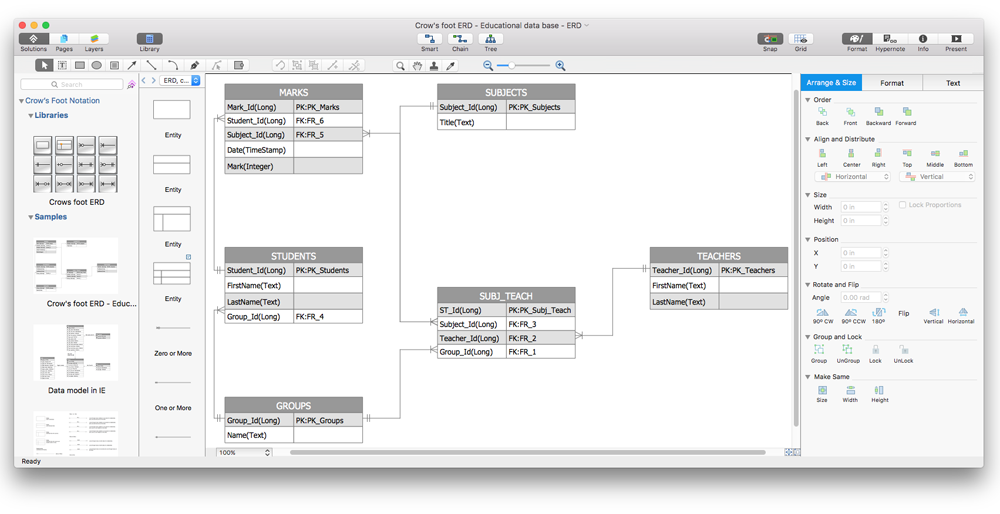
How To Make a Crow's Foot ER Diagram
The Crow's Foot ERD notation is often used in software engineering and database design. The originator of Crow’s Foot notation was Gordon Everest, who offered the idea of how to visually represent the different types of relationships that can exist between objects in an entity relationship diagram (ERD). The Crow’s Foot notation is often used in ER models to how a particular table data can reference data in other tables within a database. The free Crow's Foot Notation solution for ConceptDraw PRO offers a complete vector stencil library containing full standardized symbols of Crow's Foot notation.Metropolitan area networks (MAN). Computer and Network Examples
A Metropolitan Area Network (MAN) is a great computer network located on the large geographical area or region. It is a network bigger than Local Area Network (LAN), but territorially smaller than Wide Area Network (WAN), its diameter usually ranges from 5 to 50 kilometers. MAN usually includes several buildings or even the whole city (metropolis). It is based on high data rate compounds using the fiber channels and other digital data transmission channels. MAN includes a lot of communicating devices, for its construction are used multiple routers, switches and hubs. MAN can combine together several Local Area Networks or Campus Area Networks located in different buildings within a city and provides the Internet connectivity for them. Solutions included to Computer and Networks Area for ConceptDraw Solution Park are the real godsend for those who want design Computer Network Diagrams, and among others the Metropolitan Area Network Diagrams. They offer the libraries with ready-to-use vector design elements, professional-looking examples, samples and templates.
Pyramid Diagram
Triangle diagram example of DIKW pyramid has 4 levels: data, information, knowledge and wisdom.Energy Pyramid Diagram
Energy Pyramid Diagram is a visual graphical representation of the biomass productivity on the each trophic level in a given ecosystem. Its designing in ConceptDraw PRO will not take much time thanks to the unique Pyramid Diagrams solution from the Marketing area of ConceptDraw Solution Park. Energy Pyramid Diagram begins from the producers (plants) and proceeds through a few trophic levels of consumers (herbivores which eat these plants, the carnivores which eat these herbivores, then carnivores which eat those carnivores, and so on) to the top of the food chain.Pyramid Diagram
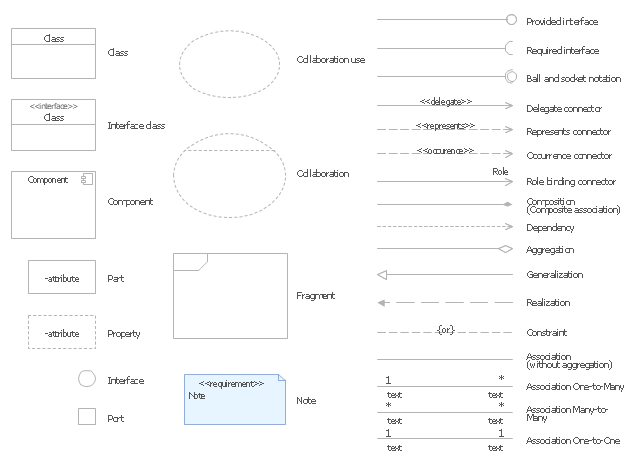
A five level pyramid model of different types of Information Systems based on the information processing requirement of different levels in the organization. five level pyramid example is included in the Pyramid Diagrams solution from Marketing area of ConceptDraw Solution Park.The vector stencils library "UML composite structure diagrams" contains 36 symbols for the ConceptDraw PRO diagramming and vector drawing software.
"The key composite structure entities identified in the UML 2.0 specification are structured classifiers, parts, ports, connectors, and collaborations.
(1) Part : A part represents a role played at runtime by one instance of a classifier or by a collection of instances. The part may only name the role, it may name an abstract superclass, or it may name a specific concrete class. The part can include a multiplicity factor, such as the [0..*] shown for Viewer in the diagram.
(2) Port : A port is an interaction point that can be used to connect structured classifiers with their parts and with the environment. Ports can optionally specify the services they provide and the services they require from other parts of the system. In the diagram, each of the small squares is a port. Each port has a type and is labelled with a name, such as "var", "indVar1", or "view" in the diagram. Ports may contain a multiplicity factor, for example.
Ports can either delegate received requests to internal parts, or they can deliver these directly to the behavior of the structured classifier that the port is contained within. Public ports that are visible in the environment are shown straddling the boundary, while protected ports that are not visible in the environment are shown inside the boundary. All the ports in the diagram are public, except for the view port along the right boundary of FibonacciSystem.
(3) Connector : A connector binds two or more entities together, allowing them to interact at runtime. The connector is shown as a line between some combination of parts, ports and structured classifiers. The diagram shows three connectors between ports, and one connector between a structured classifier and a part.
(4) Collaboration : A collaboration is generally more abstract than a structured classifier. It is shown as a dotted oval containing roles that instances can play in the collaboration.
(5) Structured classifier : A StructuredClassifier represents a class, often an abstract class, whose behavior can be completely or partially described through interactions between parts." [Composite structure diagram. Wikipedia]
The example "Design elements - UML composite structure diagrams" is included in the Rapid UML solution from the Software Development area of ConceptDraw Solution Park.
- A Well Labelled Diagrams Of A Tractors
- Diagram Of Hockey Court And Labelled
- Well Labelled Diagrams Of Verticle And Horizontal Autoclaves
- Well Labelled Diagram Of A Tractors
- A Well Labelled Diagram Explain The Different Stages Of Plc
- With The Aid Of Well Labelled Diagram Discuss
- A Well Labelled Diagram Of The Periodic Table And Its Full Labelling
- 4 Level pyramid model diagram - Information systems types ...
- Full Labelled Diagram Of A Satellite
- Labelled Diagram Of Biology Lab Equipment
- Draw A Well Labelled Diagram Of Product Life Cycle
- Bus Network Diagram
- Chemical and Process Engineering | Draw A Labelled Diagram Of ...
- Labeled Diagram Of A Bulldozer
- Pyramid Diagram | Pyramid Chart Examples | Pyramid Diagram ...
- Labelled Diagram Of Webcam
- Pyramid Chart Examples | Pyramid Diagram | Pyramid Diagram ...
- Diagram Of A Labeled Tractor
- Filtration Labelled Diagram
- Website Wireframe | Draw A Large Labeled Diagram Of A Periodic ...


