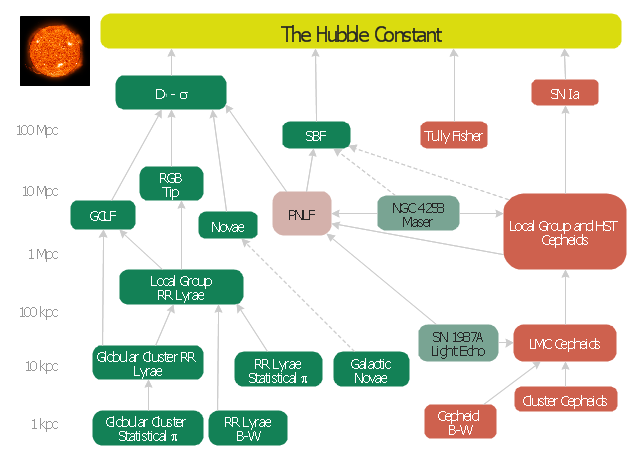
This astronomic diagram example was redesigned from the Wikimedia Commons file: Extragalactic distance ladder.JPG.
[commons.wikimedia.org/ wiki/ File:Extragalactic_ distance_ ladder.JPG]
Red boxes: Technique applicable to star-forming galaxies.
Green boxes: Technique applicable to Population II galaxies.
Cyan boxes: Geometric distance technique.
Pink box: The planetary nebula luminosity function technique is applicable to all populations of the Virgo Supercluster.
Solid lines: Well calibrated ladder step.
Dashed lines: Uncertain calibration ladder step.
"The cosmic distance ladder (also known as the extragalactic distance scale) is the succession of methods by which astronomers determine the distances to celestial objects. A real direct distance measurement of an astronomical object is possible only for those objects that are "close enough" (within about a thousand parsecs) to Earth. The techniques for determining distances to more distant objects are all based on various measured correlations between methods that work at close distances with methods that work at larger distances. Several methods rely on a standard candle, which is an astronomical object that has a known luminosity.
The ladder analogy arises because no one technique can measure distances at all ranges encountered in astronomy. Instead, one method can be used to measure nearby distances, a second can be used to measure nearby to intermediate distances, and so on. Each rung of the ladder provides information that can be used to determine the distances at the next higher rung." [Cosmic distance ladder. Wikipedia]
The astronomy diagram sample "Extragalactic distance ladder" was created using the ConceptDraw PRO diagramming and vector drawing software extended with the Astronomy solution from the Science and Education area of ConceptDraw Solution Park.
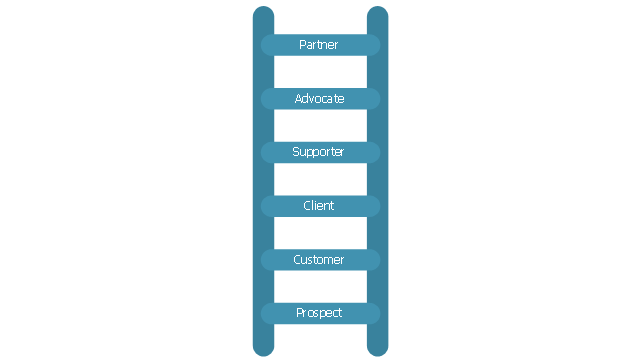
Relationship marketers group customer types by level of loyalty: prospects (people that have not purchased yet but are likely to in the future), customer, client, supporter, advocate, partner.
"Relationship marketing was first defined as a form of marketing developed from direct response marketing campaigns which emphasizes customer retention and satisfaction, rather than a dominant focus on sales transactions.
As a practice, relationship marketing differs from other forms of marketing in that it recognizes the long term value of customer relationships and extends communication beyond intrusive advertising and sales promotional messages.
With the growth of the internet and mobile platforms, relationship marketing has continued to evolve and move forward as technology opens more collaborative and social communication channels. This includes tools for managing relationships with customers that goes beyond simple demographic and customer service data. Relationship marketing extends to include inbound marketing efforts, (a combination of search optimization and strategic content), PR, social media and application development." [Relationship marketing. Wikipedia]
This relationship ladder of customer loyalty diagram example was created using ConceptDraw PRO diagramming and vector drawing software extended with Marketing Diagrams solution from Marketing area of ConceptDraw Solution Park.
This astronomic diagram example was redesigned from the Wikimedia Commons file: Extragalactic distance ladder.JPG.
[commons.wikimedia.org/ wiki/ File:Extragalactic_ distance_ ladder.JPG]
Red boxes: Technique applicable to star-forming galaxies.
Green boxes: Technique applicable to Population II galaxies.
Cyan boxes: Geometric distance technique.
Pink box: The planetary nebula luminosity function technique is applicable to all populations of the Virgo Supercluster.
Solid lines: Well calibrated ladder step.
Dashed lines: Uncertain calibration ladder step.
"The cosmic distance ladder (also known as the extragalactic distance scale) is the succession of methods by which astronomers determine the distances to celestial objects. A real direct distance measurement of an astronomical object is possible only for those objects that are "close enough" (within about a thousand parsecs) to Earth. The techniques for determining distances to more distant objects are all based on various measured correlations between methods that work at close distances with methods that work at larger distances. Several methods rely on a standard candle, which is an astronomical object that has a known luminosity.
The ladder analogy arises because no one technique can measure distances at all ranges encountered in astronomy. Instead, one method can be used to measure nearby distances, a second can be used to measure nearby to intermediate distances, and so on. Each rung of the ladder provides information that can be used to determine the distances at the next higher rung." [Cosmic distance ladder. Wikipedia]
The astronomy diagram sample "Extragalactic distance ladder" was created using the ConceptDraw PRO diagramming and vector drawing software extended with the Astronomy solution from the Science and Education area of ConceptDraw Solution Park.
[commons.wikimedia.org/ wiki/ File:Extragalactic_ distance_ ladder.JPG]
Red boxes: Technique applicable to star-forming galaxies.
Green boxes: Technique applicable to Population II galaxies.
Cyan boxes: Geometric distance technique.
Pink box: The planetary nebula luminosity function technique is applicable to all populations of the Virgo Supercluster.
Solid lines: Well calibrated ladder step.
Dashed lines: Uncertain calibration ladder step.
"The cosmic distance ladder (also known as the extragalactic distance scale) is the succession of methods by which astronomers determine the distances to celestial objects. A real direct distance measurement of an astronomical object is possible only for those objects that are "close enough" (within about a thousand parsecs) to Earth. The techniques for determining distances to more distant objects are all based on various measured correlations between methods that work at close distances with methods that work at larger distances. Several methods rely on a standard candle, which is an astronomical object that has a known luminosity.
The ladder analogy arises because no one technique can measure distances at all ranges encountered in astronomy. Instead, one method can be used to measure nearby distances, a second can be used to measure nearby to intermediate distances, and so on. Each rung of the ladder provides information that can be used to determine the distances at the next higher rung." [Cosmic distance ladder. Wikipedia]
The astronomy diagram sample "Extragalactic distance ladder" was created using the ConceptDraw PRO diagramming and vector drawing software extended with the Astronomy solution from the Science and Education area of ConceptDraw Solution Park.
The vector stencils library "HR symbols" contains 45 HR pictograms.
Use this icon set with HR symbols to draw your HR flowcharts, workflow diagrams, process charts and infographics with the ConceptDraw PRO diagramming and vector drawing software.
The HR pictograms library "HR symbols" is included in the HR Flowcharts solution from the Management area of ConceptDraw Solution Park.
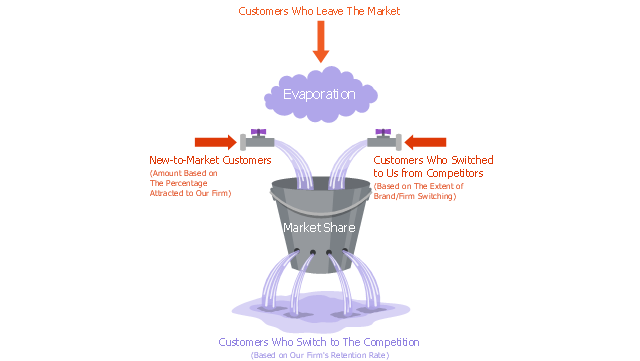
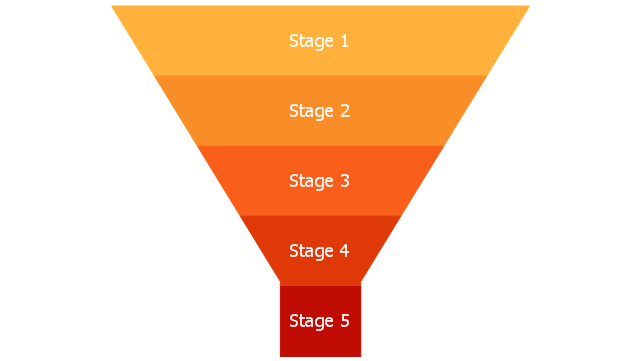
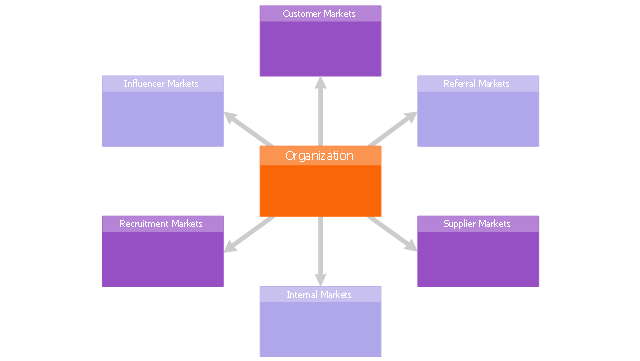
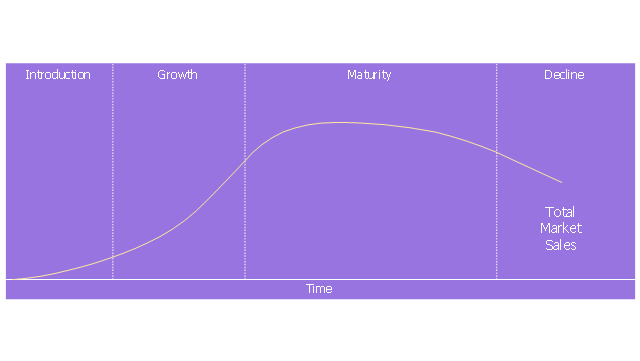
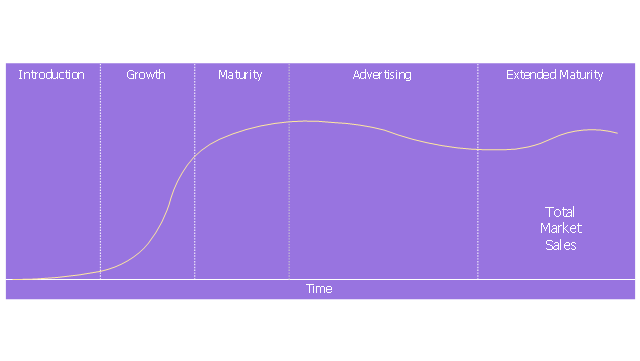
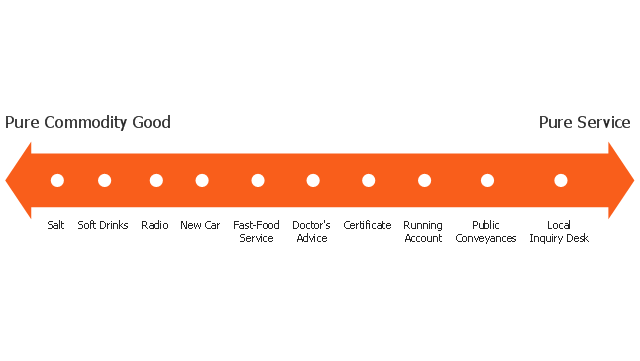
The vector stencils library "Marketing diagrams" contains 9 templates of marketing and sales diagrams and charts.
Use these shapes to illustrate your marketing and sales documents, presentations, infographics and webpages in the ConceptDraw PRO diagramming and vector drawing software extended with the Marketing Diagrams solution from the Marketing area of ConceptDraw Solution Park.
www.conceptdraw.com/ solution-park/ marketing-diagrams
The vector stencils library "HR symbols" contains 45 HR process pictograms.
Use it to design your HR flowcharts, workflow diagrams and process charts by the ConceptDraw PRO diagramming and vector drawing software.
The icons example "Design elements - HR symbols" is included in the HR Flowcharts solution from the Management area of ConceptDraw Solution Park.
Use it to design your HR flowcharts, workflow diagrams and process charts by the ConceptDraw PRO diagramming and vector drawing software.
The icons example "Design elements - HR symbols" is included in the HR Flowcharts solution from the Management area of ConceptDraw Solution Park.
 Astronomy
Astronomy solution extends ConceptDraw PRO software with illustration and sketching software with templates, samples and libraries of a variety of astronomy symbols, including constellations, galaxies, stars, and planet vector shapes; a whole host of cele
This circle-spoke diagram sample shows the social determinants of health. It was created on the base of the hub-and-spoke diagram from the Health Canada website. [hc-sc.gc.ca/ sr-sr/ pubs/ hpr-rpms/ bull/ 2005-climat/ 2005-climat-6-eng.php]
"Social determinants of health are the economic and social conditions – and their distribution among the population – that influence individual and group differences in health status. They are risk factors found in one's living and working conditions (such as the distribution of income, wealth, influence, and power), rather than individual factors (such as behavioural risk factors or genetics) that influence the risk for a disease, or vulnerability to disease or injury. According to some viewpoints, these distributions of social determinants are shaped by public policies that reflect the influence of prevailing political ideologies of those governing a jurisdiction. ...
In 2003, the World Health Organization (WHO) Europe suggested that the social determinants of health included:
(1) Social gradients (life expectancy is shorter and disease is more common further down the social ladder).
(2) Stress (including stress in the workplace).
(3) Early childhood development.
(4) Social exclusion.
(5) Unemployment.
(6) Social support networks.
(7) Addiction.
(8) Availability of healthy food.
(9) Availability of healthy transportation." [Social determinants of health. Wikipedia]
The hub-and-spoke diagram example "Social determinants of health" was created using the ConceptDraw PRO diagramming and vector drawing software extended with the Circle-Spoke Diagrams solution from the area "What is a Diagram" of ConceptDraw Solution Park.
HelpDesk
How to Draw a Process Flow Diagram in ConceptDraw PRO
Process Flow diagrams are used in chemical and process engineering to show the flow of chemicals and the equipment involved in the process. When it comes to creating a process flow diagram, it's important to use software that is capable of describing a wide range of processes, using techniques and graphical notation that are easily recognized by engineering workers. An ideal drawing platform will utilize functions that can cope with the output of a high volume of engineering processes, that may change rapidly from development to implementation stages. ConceptDraw PRO, with the extended functionality of the Chemical and Process Engineering Diagrams solution, is the ideal medium for creating designs of this type. The Chemical and Process Engineering Diagrams solution complements this feature with a library of selected icons to represent various steps — all instantly recognizable and applicable to a wide user base. ConceptDraw PRO allows you to draw the Process Flow diagram easily using the set of special libraries.
 Marketing Diagrams
This solution extends ConceptDraw PRO with samples, templates and library of design elements for drawing the marketing diagrams.
Illustration Software
No science can't exist without illustrations, and especially astronomy! Illustrations help to visualize knowledge, natural phenomenons which are studied by astronomy, they equally effective help in work, during the learning process and on the conferences. Now we have professional astronomy illustration software - ConceptDraw PRO illustration and sketching software with templates, samples and libraries of a variety of astronomy symbols, including constellations, galaxies, stars, and planet vector shapes; a whole host of celestial bodies. When drawing scientific and educational astronomy illustrations, astronomy pictures and diagrams, can help you reach for the stars!
 Marketing Area
The solutions from Marketing area of ConceptDraw Solution Park collect templates, samples and libraries of vector stencils for drawing the marketing diagrams and mind maps.
The vector stencils library "Marketing diagrams" contains 9 templates of marketing and sales diagrams and charts.
Use these shapes to illustrate your marketing and sales documents, presentations, infographics and webpages in the ConceptDraw PRO diagramming and vector drawing software extended with the Marketing Diagrams solution from the Marketing area of ConceptDraw Solution Park.
www.conceptdraw.com/ solution-park/ marketing-diagrams
Use these shapes to illustrate your marketing and sales documents, presentations, infographics and webpages in the ConceptDraw PRO diagramming and vector drawing software extended with the Marketing Diagrams solution from the Marketing area of ConceptDraw Solution Park.
www.conceptdraw.com/ solution-park/ marketing-diagrams
The vector stencils library "HR symbols" contains 45 HR pictograms.
Use this icon set with HR symbols to draw your HR flowcharts, workflow diagrams, process charts and infographics with the ConceptDraw PRO diagramming and vector drawing software.
The HR pictograms library "HR symbols" is included in the HR Flowcharts solution from the Management area of ConceptDraw Solution Park.
Use this icon set with HR symbols to draw your HR flowcharts, workflow diagrams, process charts and infographics with the ConceptDraw PRO diagramming and vector drawing software.
The HR pictograms library "HR symbols" is included in the HR Flowcharts solution from the Management area of ConceptDraw Solution Park.
- Ladder of customer loyalty diagram | Marketing diagrams - Vector ...
- Ladder Of Loyalty
- Ladder of customer loyalty diagram
- Ladder of customer loyalty diagram | Loyalty - Arrow circle diagram ...
- Extragalactic distance ladder
- | | Cosmic Distance Ladder
- Marketing Sales Ladder
- Marketing Diagrams | Design elements - Marketing diagrams ...
- Pyramid Diagram | Leaky bucket diagram | Six Markets Model Chart ...
- Elements Of Customer Relationship Building Ladder
- Mention The Ladder Of Loyalty
- Electrical Ladder Diagram Symbols
- Career ladder
- Circular Diagram | Target and Circular Diagrams | Innovation life ...
- Career Ladder Icon
- Design elements - Marketing diagrams | Marketing Diagrams | What ...
- Six Markets Model Chart
- Leaky bucket diagram | Marketing Diagrams | Marketing Area ...
- Marketing Diagrams | Marketing diagrams - Vector stencils library ...
