Lean Manufacturing Diagrams
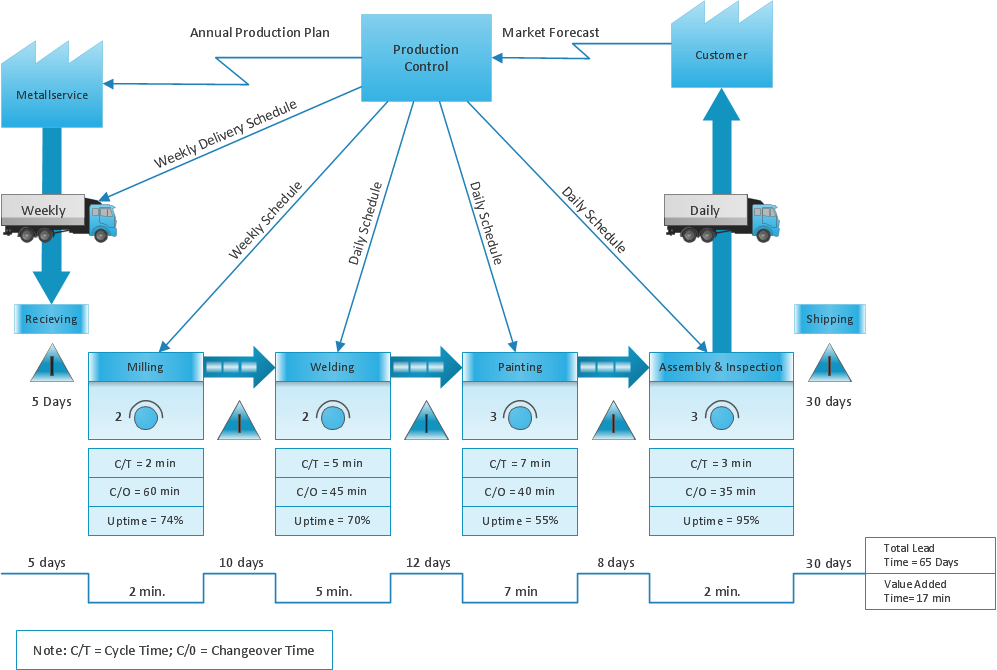
The Value Stream Mapping solution continues to extend the range of ConceptDraw PRO into a business graphics tool that can be used to document processes of Lean Manufacturing.Lean Value Stream
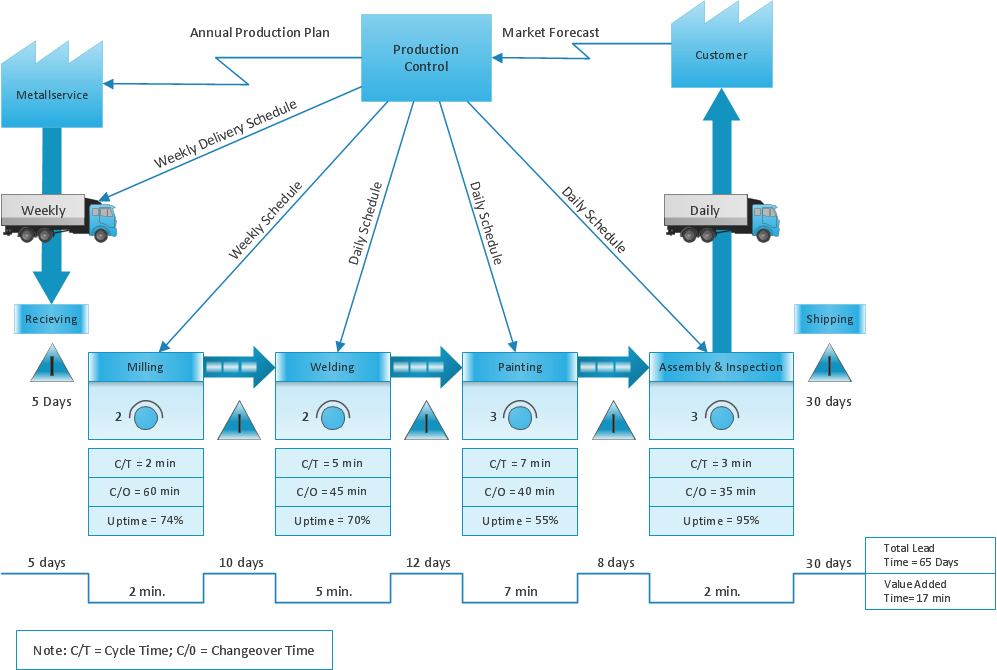
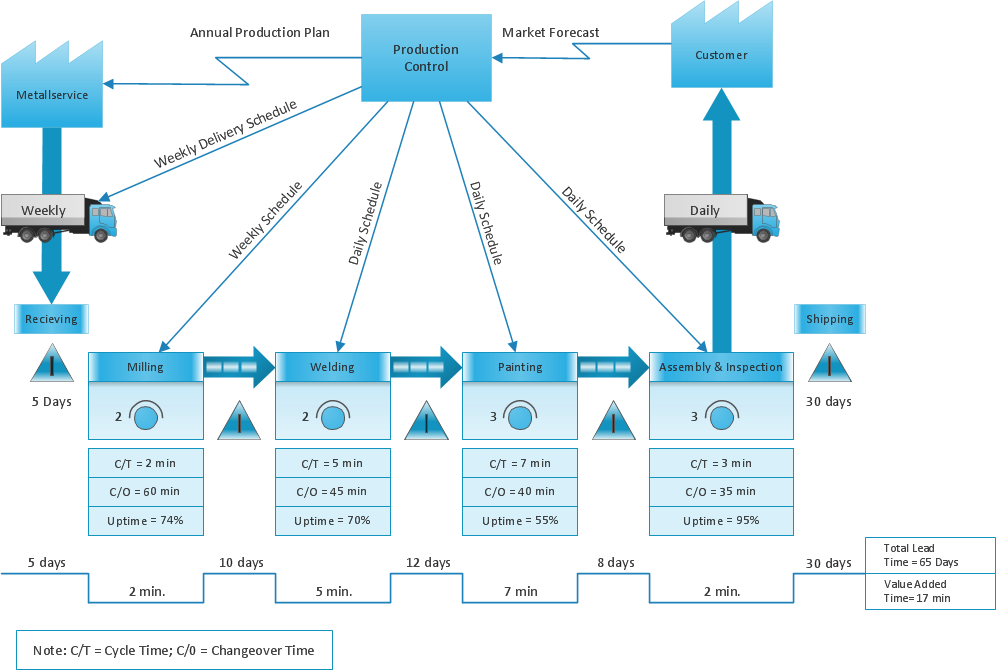
ConceptDraw Value Stream Mapping is a Lean Manufacturing tool that uses a flow diagram to document in great detail every step of a manufacturing process.Lean Six Sigma Diagram Software
Lean Six Sigma (LSS) is a well-known in all over the world methodology of quality improvement and business perfection. ConceptDraw PRO diagramming and vector drawing software is a powerful Lean Six Sigma Diagram Software thanks to the included Value Stream Mapping solution from the Quality Area of ConceptDraw Solution Park.Lean Value Stream Map
Lean Manufacturing tool is a new Value Stream Mapping solution found in the ConceptDraw Solution Park.Value-Stream Mapping for Manufacturing
Create value stream maps - for value stream analysis and value stream management, material and information flow mapping, using our quick start templates included with ConceptDraw.Value Stream Diagram
The new Value Stream Mapping solution found in the ConceptDraw Solution Park continues to extend the range of ConceptDraw PRO into a business graphics tool.Quality Engineering Diagrams
Create Quality Engineering Diagrams (value stream maps) - for value stream analysis and value stream management, material and information flow mapping, using our quick start templates included with ConceptDraw.Learn how to create a current state value stream map
Value Stream Mapping solution extends ConceptDraw PRO software with templates, samples and vector shapes for drawing the current state value stream maps.What is Value Stream Mapping?
Value stream maps (VSM) are an essential tool for organizations applying Lean methods.Value Stream Mapping for the Lean Office
Value Stream Mapping for the lean office is a tool that uses a flow diagram to document in great detail every step of a manufacturing process.Create a Value Stream Map
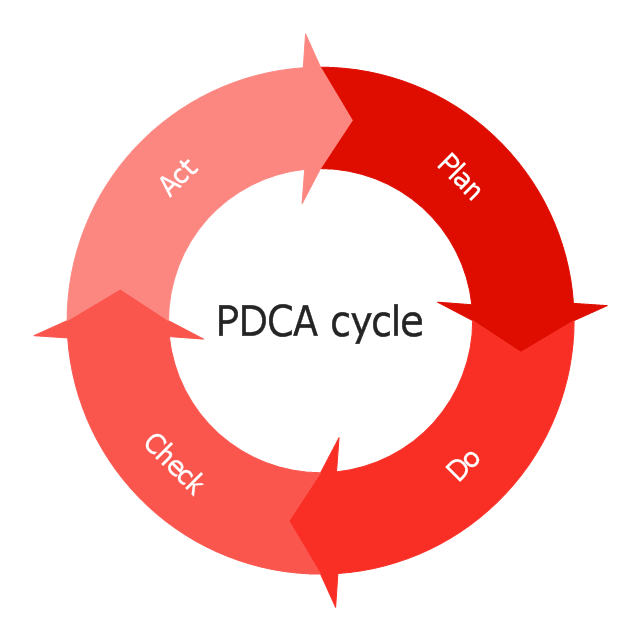
Use ConceptDraw PRO software extended with Value Stream Mapping solution to create your own VSM diagrams."PDCA (plan–do–check–act or plan–do–check–adjust) is an iterative four-step management method used in business for the control and continuous improvement of processes and products. It is also known as the Deming circle/ cycle/ wheel, Shewhart cycle, control circle/ cycle, or plan–do–study–act (PDSA). Another version of this PDCA cycle is OPDCA. The added "O" stands for observation or as some versions say "Grasp the current condition." This emphasis on observation and current condition has currency with Lean manufacturing/ Toyota Production System literature." [PDCA. Wikipedia]
The circular arrows diagram example "PDCA cycle" was created using the ConceptDraw PRO diagramming and vector drawing software extended with the Circular Arrows Diagrams solution from the area "What is a Diagram" of ConceptDraw Solution Park.
The circular arrows diagram example "PDCA cycle" was created using the ConceptDraw PRO diagramming and vector drawing software extended with the Circular Arrows Diagrams solution from the area "What is a Diagram" of ConceptDraw Solution Park.
Value Stream Mapping Symbols
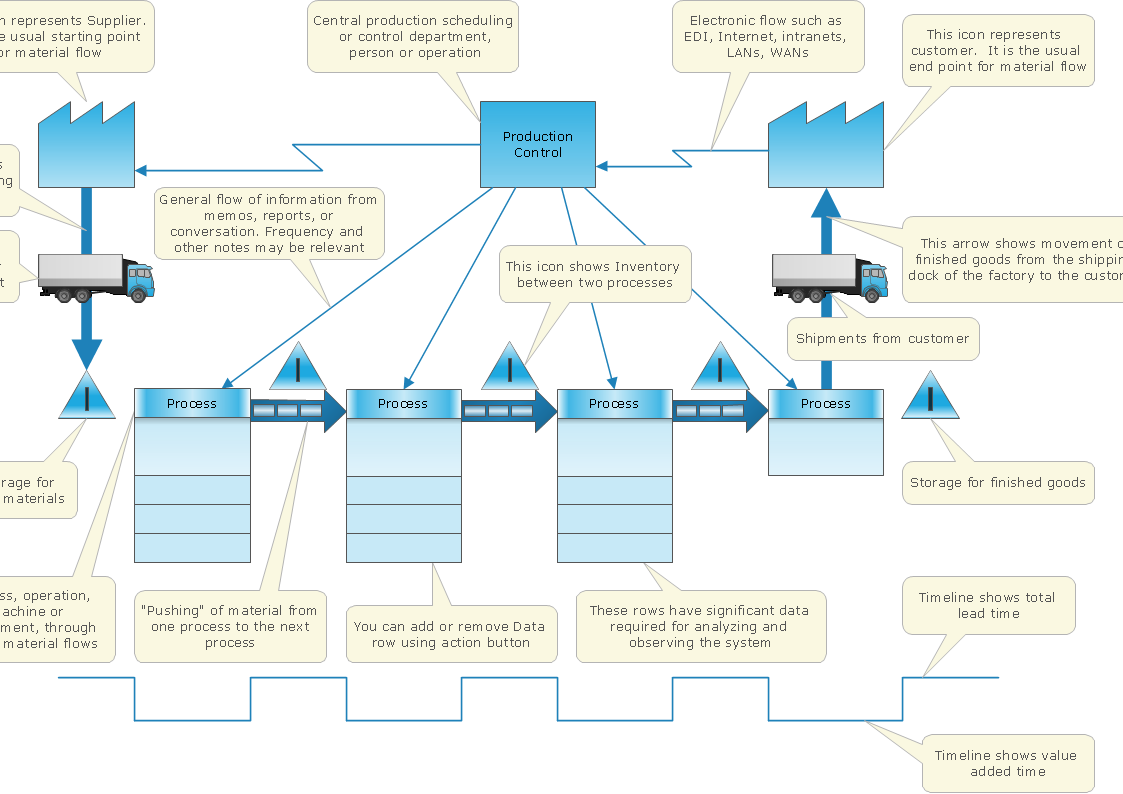
VSM symbols are the best for a production process designing. The entire Value Stream Mapping method uses a graphical representation of the manufacturing process, factors' pros and cons, that all stakeholders can easily understand. Value Stream Mapping is a graphical technique that provides possibilities to improve analysis of a manufacturing process, at the stage of the transferring information or materials that required to deliver a product or service to the customer.Value Stream Mapping Template, Process Flowchart, Basic Flowchart Symbols and Meaning, Entity Relationship Diagram Symbols, Lean Manufacturing Diagrams, Value Stream Mapping for the Lean Office, Value Stream Mapping Software, Value-Stream Mapping for Manufacturing, Learn how to create a current state value stream map, Workflow Diagram Symbols
The Lean Enterprise Value Stream Mapping
Create value stream maps - for value stream analysis and value stream management, material and information flow mapping, using our quick start templates included with ConceptDraw.
 Value Stream Mapping
Value stream mapping solution extends ConceptDraw PRO software with templates, samples and vector stencils for drawing the Value Stream Maps (VSM) in lean manufacturing practice.
- Manufacturing Pictures Diagram
- Manufacturing 8 Ms fishbone diagram - Template | Business ...
- Lean Manufacturing Diagrams | Value Stream Mapping | Value ...
- Quality Area | Lean Manufacturing Diagrams
- Lean Manufacturing Diagrams | Value Stream Mapping for the Lean ...
- Total Quality Management TQM Diagrams | Fishbone Diagram ...
- Lean Manufacturing Diagrams | TQM Diagram Example | Types of ...
- Lean Manufacturing Diagrams | Value-Stream Mapping for ...
- Lean Manufacturing Diagrams | Value Stream Mapping | Types of ...
- Process Flowchart | Lean Manufacturing Diagrams | Total Quality ...
- Lean Manufacturing Diagrams | Manufacturing 8 Ms fishbone ...
- Fishbone Diagram | Lean Manufacturing Diagrams | Bar Diagrams ...
- Manufacturing Process Diagram
- Lean Manufacturing Diagrams | Value Stream Mapping for the Lean ...
- Value-Stream Mapping for Manufacturing | Lean Manufacturing ...
- Value Stream Mapping Symbols | Lean Manufacturing Diagrams ...
- Lean Mapping
- Value-Stream Mapping for Manufacturing | Process Flowchart | Lean ...
- Manufacturing and Maintenance | Picture Graphs | Types of ...
- Process Flowchart | Graphical Symbols to use in EPC diagrams ...

