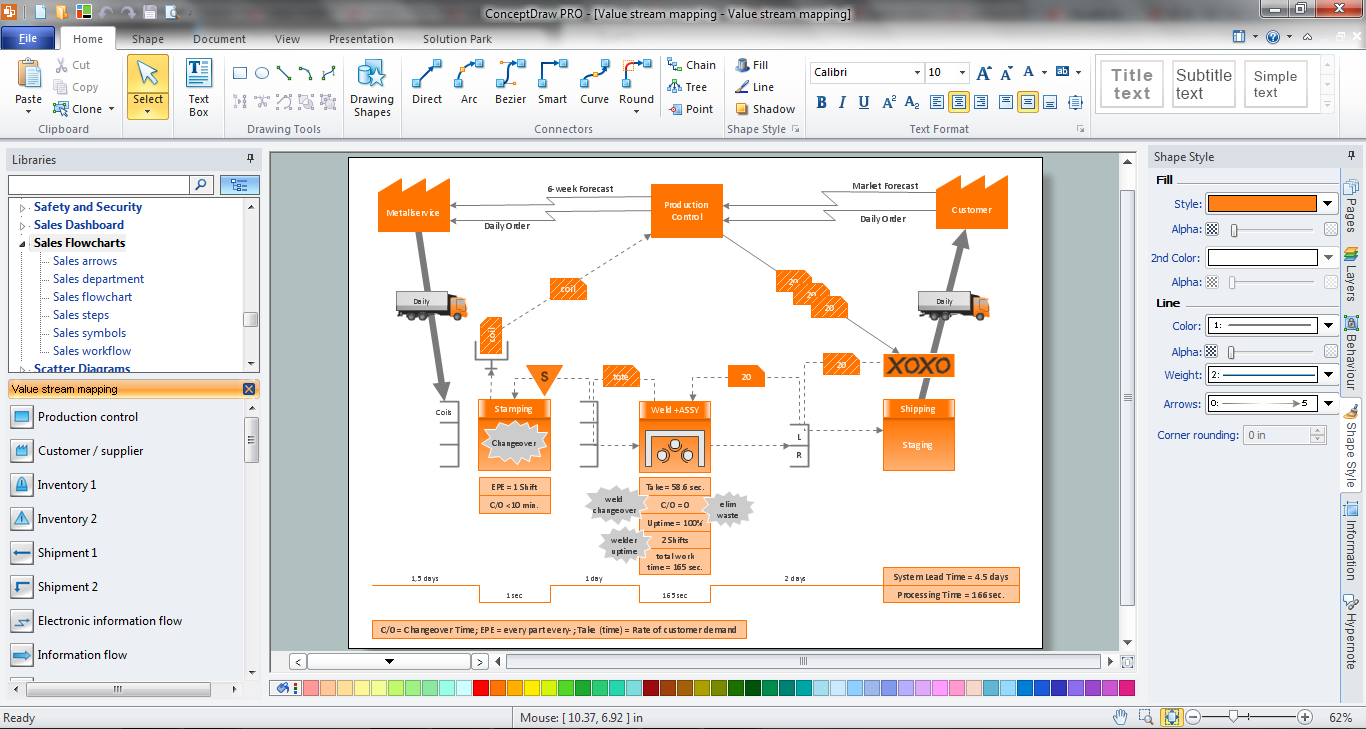
Lean Manufacturing Diagrams
The Value Stream Mapping solution continues to extend the range of ConceptDraw PRO into a business graphics tool that can be used to document processes of Lean Manufacturing.Value Stream Mapping
Use ConceptDraw Value Stream Maps (VSM) visualization for a manufacturing plant the material and information flow required to deliver a product/service to customers. The new Value Stream Mapping solution found in the ConceptDraw Solution Park continues to extend the range of ConceptDraw PRO into a business graphics tool that can be used to document processes in any organization.What is Value Stream Mapping?
Value stream maps (VSM) are an essential tool for organizations applying Lean methods.SIPOC Diagram
SIPOC is a tool that summarizes the inputs and outputs of one or more processes in table form. You need to draw professional looking SIPOC Diagram quick and easy? Pay please your attention on ConceptDraw PRO diagramming and vector drawing software. Extended with Business Process Mapping Solution from the Business Processes Area of ConceptDraw Solution Park, it suits ideal for this.
 Value Stream Mapping
Value stream mapping solution extends ConceptDraw PRO software with templates, samples and vector stencils for drawing the Value Stream Maps (VSM) in lean manufacturing practice.
Value Stream & Process Flow Diagramming Software
Value Stream & Process Flow Diagramming Software is a very popular Lean Manufacturing tool that allows to see and visualize in details the company's processes and current state, the flow of material and information, and thus gives the possibility to analyze the efficiency of company's processes and then develop improved processes. Value stream maps are also a good way to define the steps that do not add value to the end product, in other words waste in a company's processes.Types of Flowcharts
A Flowchart is a graphical representation of process, algorithm, workflow or step-by-step solution of the problem. It shows the steps as boxes of various kinds and connects them by arrows in a defined order depicting a flow. There are twelve main Flowchart types: Basic Flowchart, Business Process Modeling Diagram (BPMN), Cross Functional Flowchart, Data Flow Diagram (DFD), IDEF (Integrated DEFinition) Flowchart, Event-driven Process Chain (EPC) Diagram, Influence Diagram (ID), Swimlane Flowchart, Process Flow Diagram (PFD), Specification and Description Language (SDL) Diagram, Value Stream Mapping, Workflow Diagram. Using the Flowcharts solution from the Diagrams area of ConceptDraw Solution Park you can easy and quickly design a Flowchart of any of these types. This solution offers a lot of special predesigned vector symbols for each of these widely used notations. They will make the drawing process of Flowcharts much easier than ever. Pay also attention for the included collection of ready Flowchart examples, samples and quick-start templates. This is business process improvement tools. If you are looking for MS Visio for your Mac, then you are out of luck, because it hasn't been released yet. However, you can use Visio alternatives that can successfully replace its functions. ConceptDraw PRO is an alternative to MS Visio for Mac that provides powerful features and intuitive user interface for the same.
Basic Flowchart Symbols and Meaning
Flowcharts are the best for visually representation the business processes and the flow of a custom-order process through various departments within an organization. ConceptDraw PRO diagramming and vector drawing software extended with Flowcharts solution offers the full set of predesigned basic flowchart symbols which are gathered at two libraries: Flowchart and Flowcharts Rapid Draw. Among them are: process, terminator, decision, data, document, display, manual loop, and many other specific symbols. The meaning for each symbol offered by ConceptDraw gives the presentation about their proposed use in professional Flowcharts for business and technical processes, software algorithms, well-developed structures of web sites, Workflow diagrams, Process flow diagram and correlation in developing on-line instructional projects or business process system. Use of ready flow chart symbols in diagrams is incredibly useful - you need simply drag desired from the libraries to your document and arrange them in required order. There are a few serious alternatives to Visio for Mac, one of them is ConceptDraw PRO. It is one of the main contender with the most similar features and capabilities.
- Value Stream Mapping Symbols | Lean Manufacturing Diagrams ...
- Value Stream Mapping Symbols Powerpoint
- Fishbone Diagram | Value Stream Mapping | Cross-Functional ...
- Free Value Stream Mapping For Mac
- Fishbone Diagram | Presentation Exchange | Entity-Relationship ...
- Value Stream Mapping
- SWOT Analysis | Winter Sports | Presentation Exchange | Swot ...
- Sales Dashboard | Presentation Exchange | Accounting Flowcharts ...
- Sales Dashboard | Entity-Relationship Diagram (ERD) | Cross ...
- How To Do A Mind Map In PowerPoint | Concept Maps | Positioning ...
- Aerospace and Transport | Aerospace - Design Elements | Fishbone ...
- SWOT Analysis Tool for Small Business | SWOT Analysis | How to ...
- Value Stream Diagram | Value Stream Mapping | Lean ...
- How to Create a PowerPoint Presentation from a SWOT Analysis ...
- Concept Maps | How to Add a Concept Map to a PowerPoint ...
- SWOT Analysis Tool for Small Business | SWOT Analysis | How to ...
- Best Mind Mapping Program for Making Presentations | Best ...
- Fishbone Diagram | Entity-Relationship Diagram (ERD) | Cross ...
- Sales Dashboard | Event-driven Process Chain Diagrams EPC ...
- Fishbone Diagram Powerpoint Template


