Value stream with ConceptDraw PRO

This circular arrows diagram sample depicts the Plan–Do–Check–Act cycle.
"PDCA (plan–do–check–act or plan–do–check–adjust) is an iterative four-step management method used in business for the control and continuous improvement of processes and products. It is also known as the Deming circle/ cycle/ wheel, Shewhart cycle, control circle/ cycle, or plan–do–study–act (PDSA). Another version of this PDCA cycle is OPDCA. The added "O" stands for observation or as some versions say "Grasp the current condition." This emphasis on observation and current condition has currency with Lean manufacturing/ Toyota Production System literature." [PDCA. Wikipedia]
The diagram example "PDCA cycle" was created using the ConceptDraw PRO diagramming and vector drawing software extended with the Circular Arrows Diagrams solution from the area "What is a Diagram" of ConceptDraw Solution Park.
Circular arrows diagram

Data Flow Diagram Model

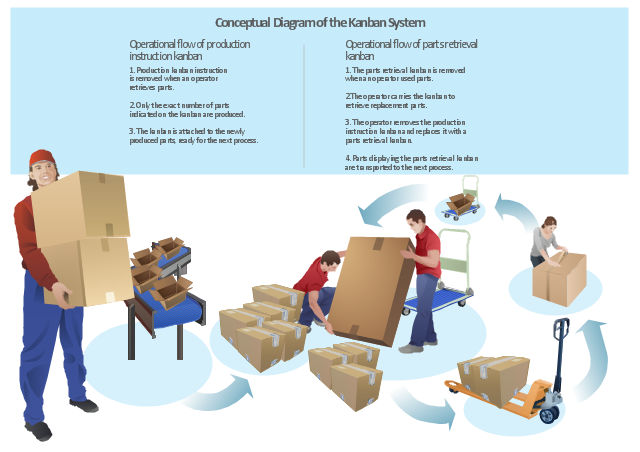
"Kanban ... (literally signboard or billboard) is a scheduling system for lean and just-in-time (JIT) production. Kanban is a system to control the logistical chain from a production point of view, and is not an inventory control system. Kanban was developed by Taiichi Ohno, at Toyota, to find a system to improve and maintain a high level of production. Kanban is one method through which JIT is achieved.
Kanban became an effective tool in support of running a production system as a whole, and it proved to be an excellent way for promoting improvement. Problem areas were highlighted by reducing the number of kanban in circulation." [Kanban. Wikipedia]
The example "Conceptual diagram of the Kanban System" was created in the ConceptDraw PRO diagramming and vector drawing software using the vector stencils library Packaging, loading, customs.
The example "Conceptual diagram of the Kanban System" is included in the Manufacturing and Maintenance solution from the Illustration area of ConceptDraw Solution Park.
Infographics
Lean Value Stream Map

Value-Stream Mapping for Manufacturing
")
Business Processes

The Lean Enterprise Value Stream Mapping

Lean Six Sigma Diagram Software

Lean Manufacturing Diagrams
 design elements")
Types of Flowcharts


 Workflow Diagrams
Workflow Diagrams solution extends ConceptDraw PRO software with samples, templates and vector stencils library for drawing the work process flowcharts.
Value Stream & Process Flow Diagramming Software

Value Stream Mapping for the Lean Office
")
Quality Engineering Diagrams
 sample")
- Lean Manufacturing Diagrams | Value-Stream Mapping for ...
- Lean Manufacturing Diagrams
- Lean Production
- Production System Diagram
- Diagram Of Production
- Process Flowchart | Basic Flowchart Symbols and Meaning | Lean ...
- Value-Stream Mapping for Manufacturing | Picture Graphs | Lean ...
- Conceptual diagram of the Kanban System | Kanban Board ...
- Conceptual diagram of the Kanban System | Manufacturing and ...
- Diagram Of Production System
- Conceptual diagram of the Kanban System | Value stream mapping ...
- Production System Example With Diagram
- Conceptual diagram of the Kanban System | IDEF1 standard ...
- Just In Time Manufacturing System
- Manufacturing Block Diagrams
- Quality Management System | Water cycle diagram | Organizational ...
- Conceptual diagram of the Kanban System
- Manufacturing 8 Ms fishbone diagram - Template | How Do ...
- Manufacturing and Maintenance | How Do Fishbone Diagrams ...