HelpDesk
How to Create Education Infographics
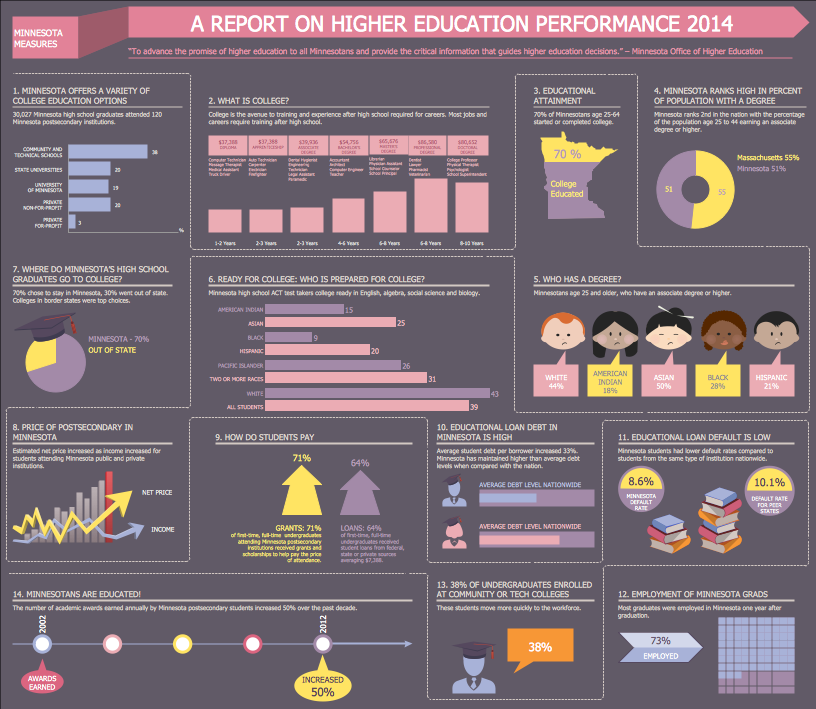
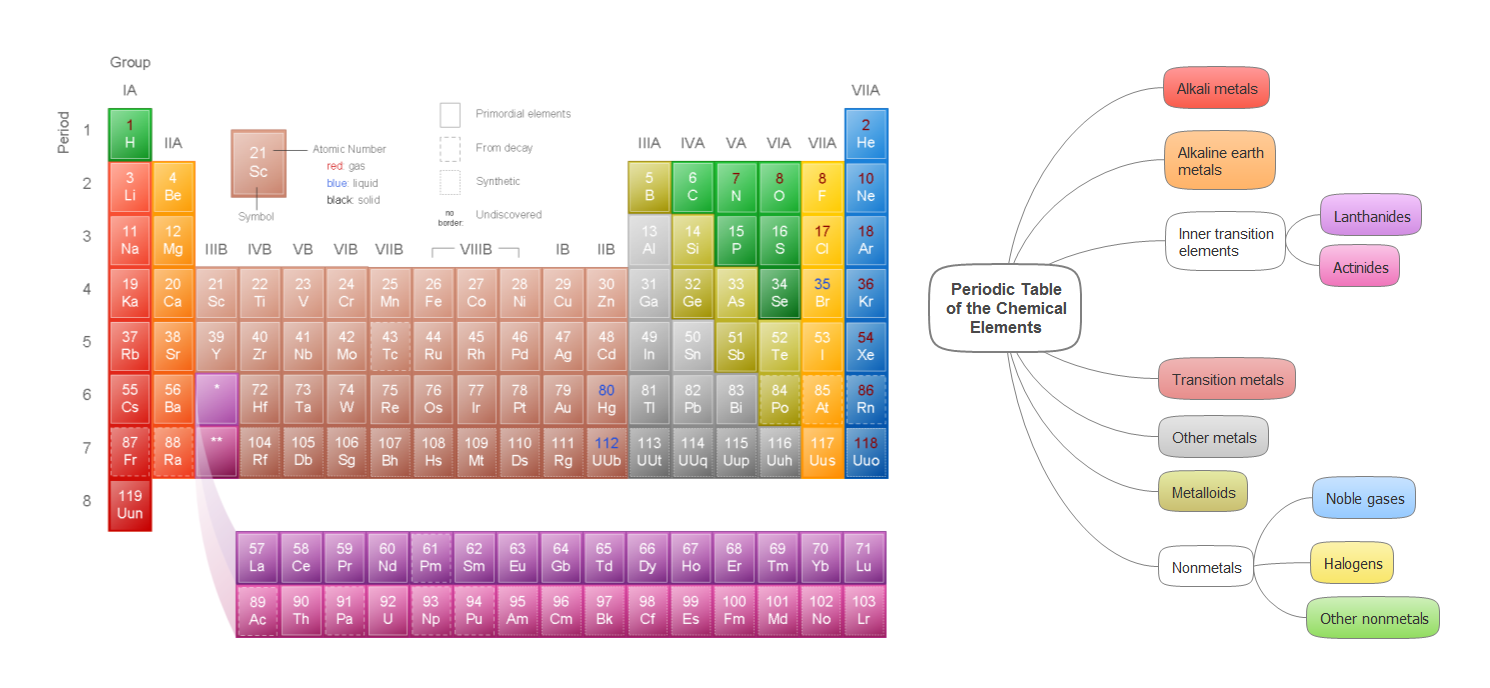
Education Infographics is used to display a lot of education-related information in a single, visually-appealing graphic. Infographics, created for education purposes can contain different illustrations, detailed charts, and data. ConceptDraw PRO can be used as a tool for creating education infographics. It allows you to draw infographics quickly and easily using the special templates and vector stencils libraries. Infographics can be used to quickly communicate a message, to simplify the presentation of large amounts of data, to see data patterns and relationships, and to monitor changes in variables over time. It can contain bar graphs, pie charts, histograms, line charts, e.t.c.Information Graphic
Information graphic or infographic is a visual representation of various information, data or knowledge. ConceptDraw PRO extended with unique Education Infographics Solution from the Business Infographics Area will help you design any education information graphic without efforts.
 ConceptDraw Solution Park
ConceptDraw Solution Park collects graphic extensions, examples and learning materials
How To Create Presentation for Trainings and Learning process
Learning via presentations is used widely in education. This is a frequently used tool on trainings, especially for remote training via Skype.
 Language Learning
Language Learning solution extends ConceptDraw PRO software with templates, samples and library of vector stencils for drawing the sentence diagrams.
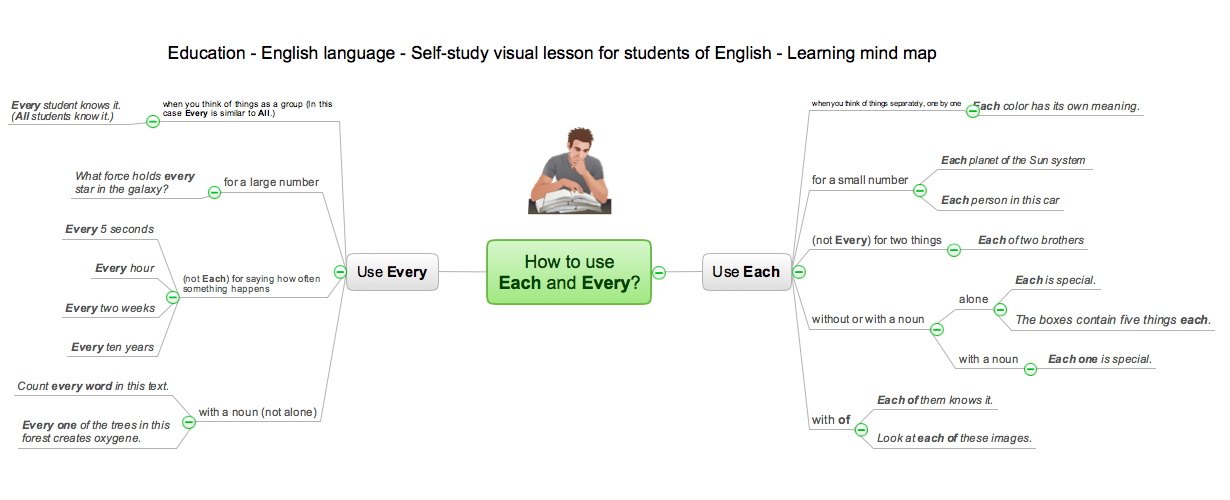
Learning with MindMap
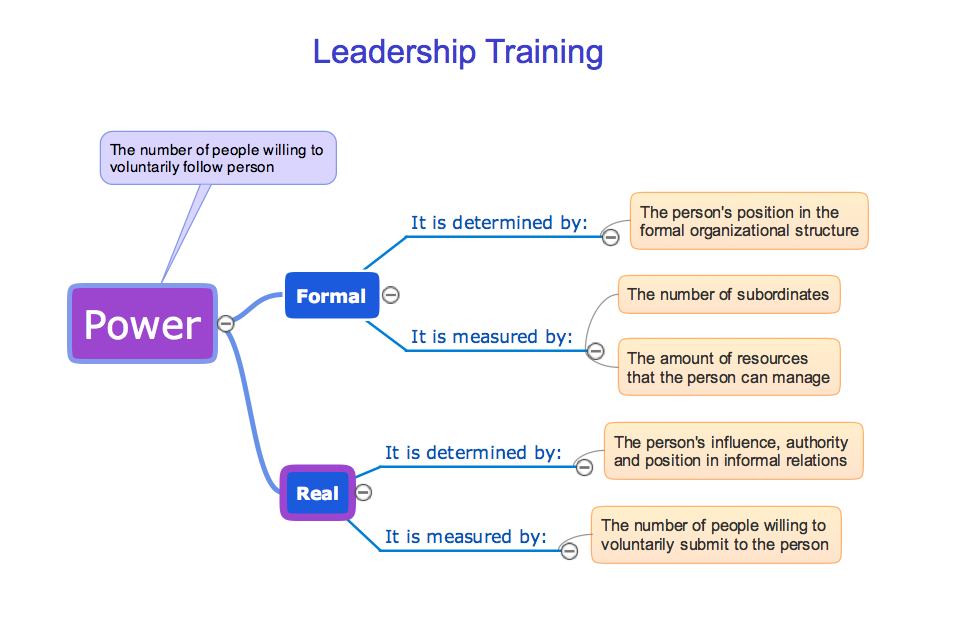
Learning with MindMap - Mind Maps are the easiest way to organize your ideas and information. They are very popular in almost all areas of life and activity, and particularly in education area.ConceptDraw MINDMAP 7 is an ideal software tool for learning process. It combines great tools for all activities from organizing to accomplishing learning process - prepare lectures and learning materials, provide trainings and test knowledge with students, make presentations, problem solve, brainstorming, and much more.
How tо Represent Information Graphically
ConceptDraw Infographics is a great visual tool for communicating the large amounts of data and graphic visualization and representations of data and information.Content Marketing Infographics
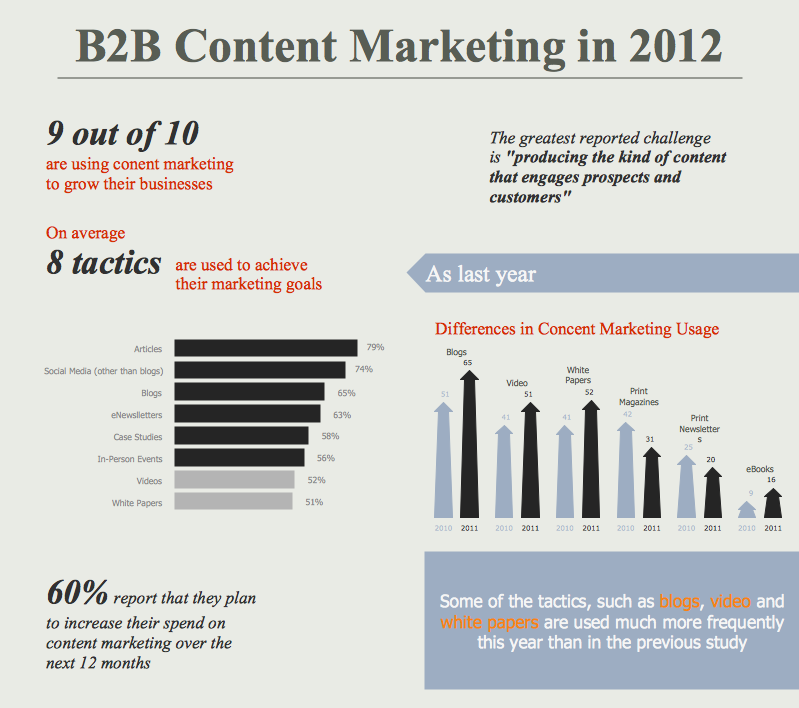
The popularity of visual content marketing grows day by day. So now simple and convenient designing of professional looking Content Marketing Infographics becomes increasingly actual. For achievement this goal ConceptDraw PRO software offers the Marketing Infographics Solution from the Business Infographics Area.HelpDesk
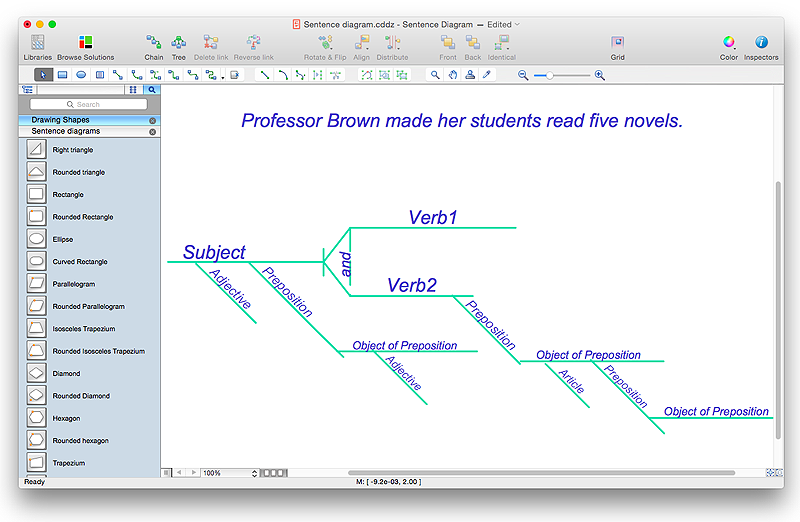
How to Diagram Sentences in ConceptDraw PRO
Diagramming sentences is a playful, fun way to learning English Grammer. Sentences can be very complex, and can contain many different parts of speech which implicate many different grammatical rules. Diagramming sentences will help you to make sure every parts of your sentence are grammatically correct, and provides you with more comprehensive understanding of the English Language. A Sentence Diagram displays the parts of a sentence as a diagram in order to show the relationship of words and groups of words within the sentence. Sentence Diagram shows the relationship between the proposal of its parts. This is a good way to teach grammar! Sentence Diagram helps to make the writing more coherent as well as more interesting to read. ConceptDraw PRO allows you to create clear sentence diagrams using the special templates and vector stencils library.Educational Technology Tools
What are the favorite educational technology tools and techniques for teachers? Of course these are pictures, images and education infographics! ConceptDraw PRO software supplied with Education Infographics Solution from the Business Infographics Area provides powerful drawing tools to help design the education infographics of any complexity.Make an Infographic
You want to make an infographic and need the useful and convenient drawing tools for this? In this case the ConceptDraw PRO software extended with Education Infographics Solution is a real godsend for you.HelpDesk
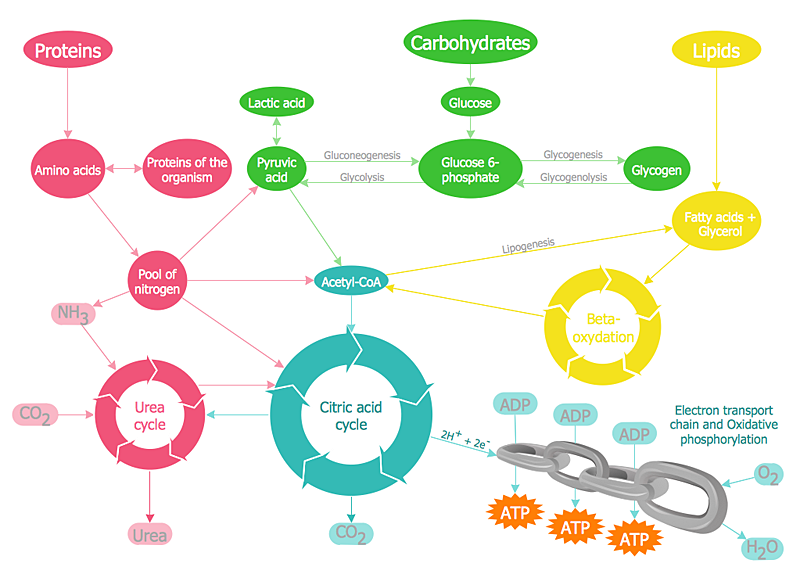
How to Draw Biology Diagram in ConceptDraw PRO
Biology is the science studying the living forms of life. A good starting point when studying biology is to use drawings. Drawings help students to comprehend and remember knowledge that is difficult to explain and understand. Students are used to draw various specific diagrams such as the human circulatory systems or schemes of various biochemical processes. Researchers also need to complete their work with a variety of related diagrams and illustrations. ConceptDraw Biology solution allows you to draw various biological diagrams and schemes easily.
 What are Infographic Area
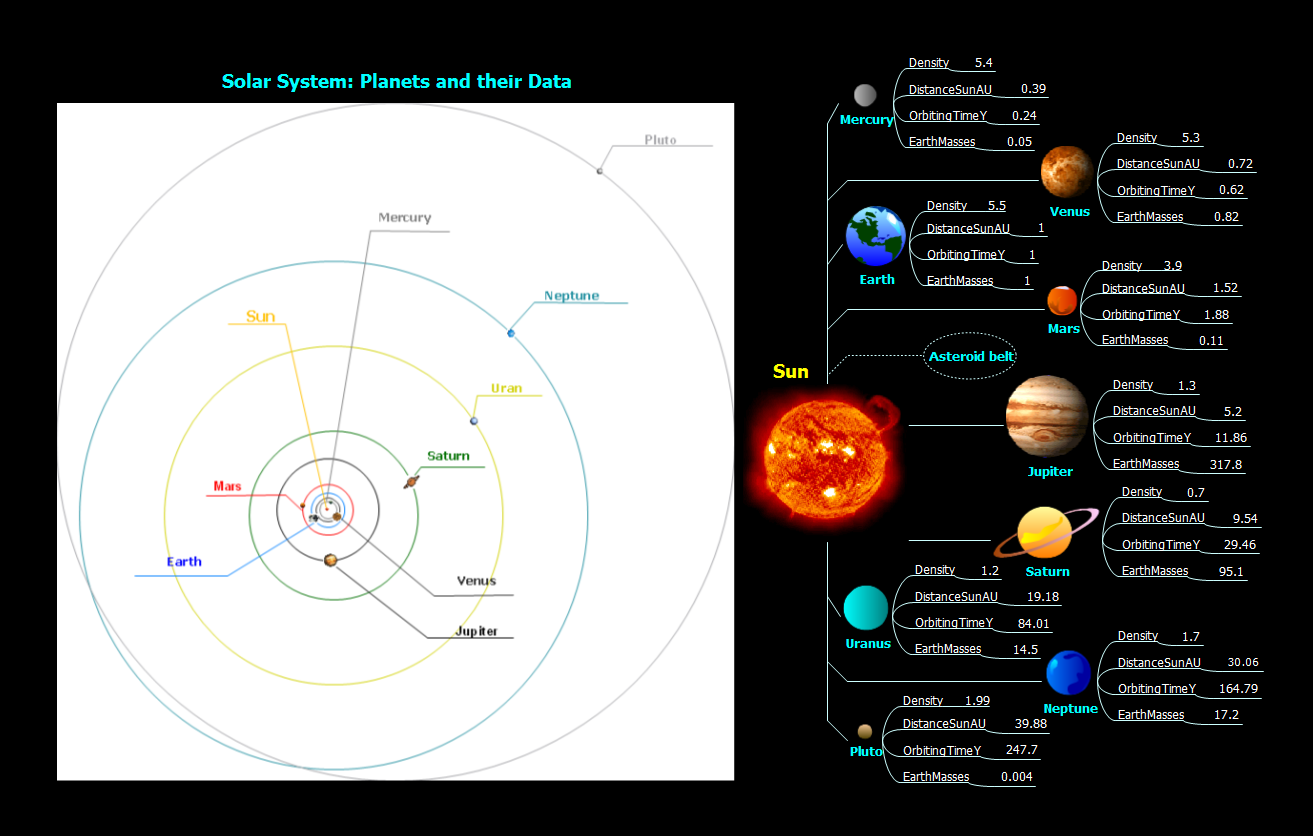
Solutions of the area What is Infographics from ConceptDraw Solution Park collect templates, samples and vector stencils libraries with design elements for the drawing information graphics.
How Teachers Use Skype for eLearning
Teachers use Skype in the classroom to enrich experiences for students. Using mind mapping software in virtual classrooms for brainstorming and presentation make an effective way to gather information and track results.
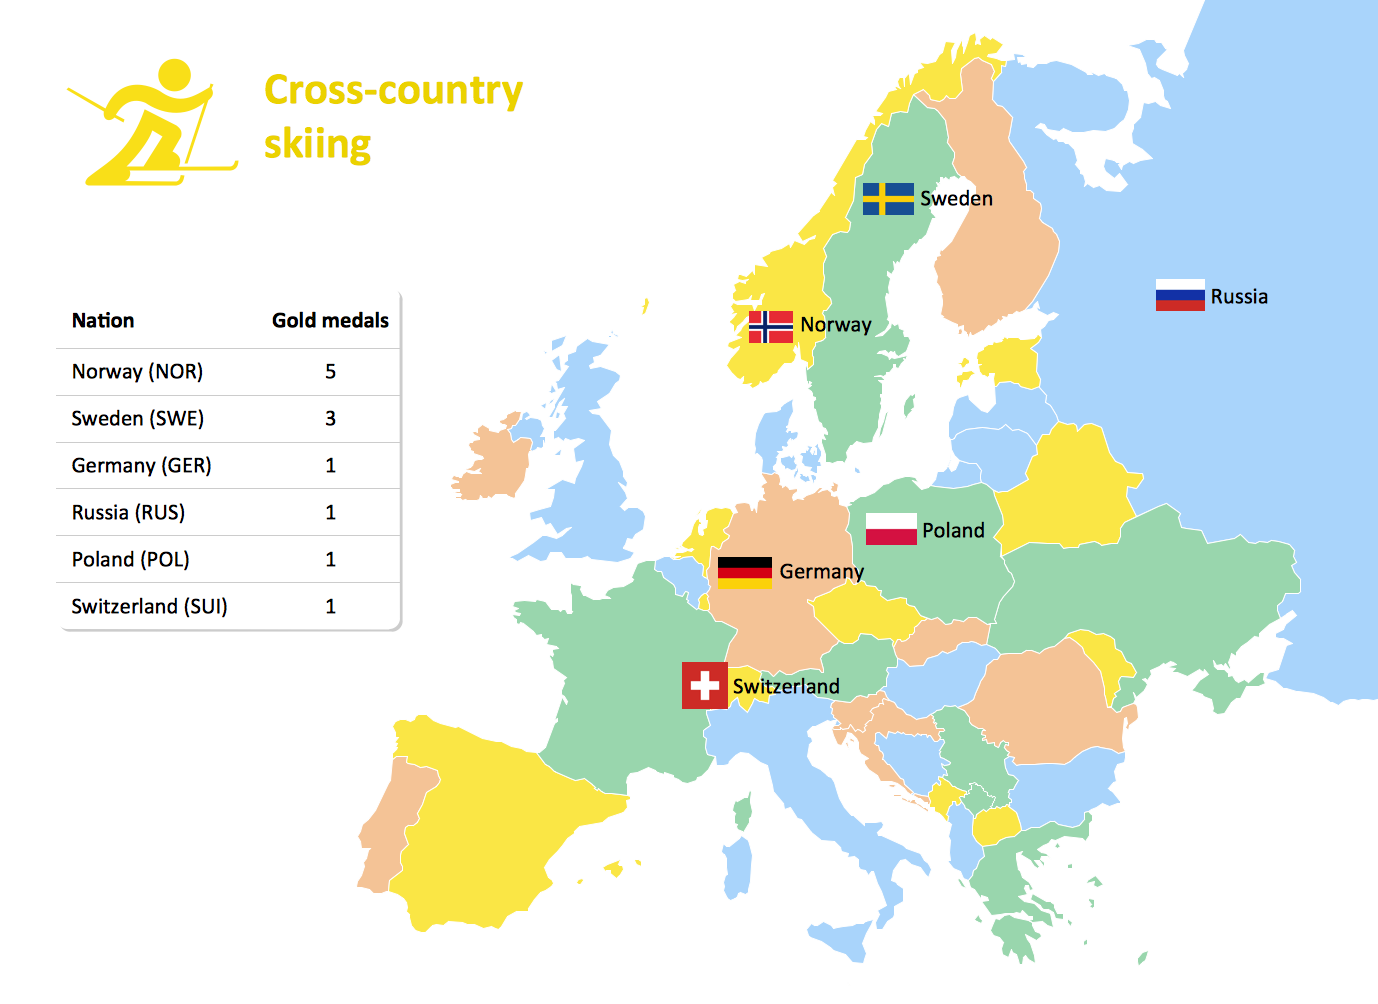
Winter Sports. Olympic Games Infographics. Medal Table
Visualizing data in infographics format is a modern way to represent any statistics related to global sporting events, such as Winter Olympic Games. ConceptDraw PRO software extended with the Winter Sports solution delivers a rich set of samples and templates helps you produce all kind of sporting information, such as tournament schedule or medal table.
 eLearning for Skype
This solution extends ConceptDraw MINDMAP software with the ability to prepare and run remote learning sessions by using Skype
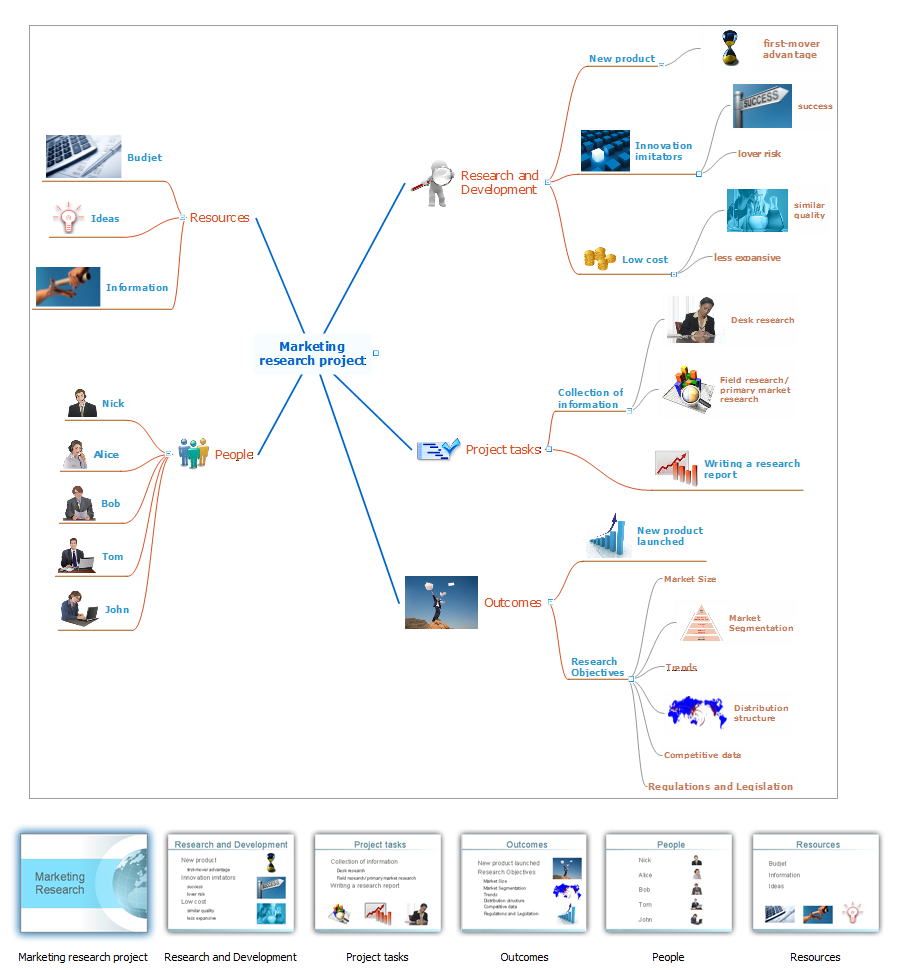
Creating a default presentation in ConceptDraw MINDMAP
ConceptDraw MINDMAP a versatile, yet easy-to-use tool for organizing ideas and data. Creates mind maps that intuitively illustrate your thought process. Outputs a wide variety of document styles and formats. Delivers presentations from mind maps with built-in modes and MS PowerPoint export. Perfect for brainstorming, project planning, meeting management, note taking, and more.Spatial infographics Design Elements: Transport Map
Do you like infographics and data visualization? Creating infographics is super-easy with ConceptDraw.- How To Create Presentation for Trainings and Learning process ...
- Decision Making Software For Small Business | Why Flowchart ...
- Remote Learning Sessions - Webinars | Business Process Elements ...
- Education | Entity-Relationship Diagram (ERD) | Development of ...
- Horizontal bar chart - The most spoken languages of the world ...
- Language Learning | Language School E- Learning | Unified ...
- How to Create Flowcharts for an Accounting Information System ...
- Provide Team Training | Create Learning Presentation using ...
- Value Stream Mapping | Spatial Infographics | ConceptDraw ...
- Types of Flowchart - Overview | Process Flowchart | Value stream ...
- eLearning for Skype | eLearning - Easy English on Skype | How ...
- Quality Mind Map | Mind Map Exchange | Accounting Flowcharts ...
- Decision Making Software For Small Business | Why Flowchart ...
- Skype - eLearning Learning | Design elements - Stars and planets ...
- Skype - eLearning Learning | eLearning for Skype | Best Mind ...
- Map Infographic Creator | Best Tool for Infographic Construction ...
- Control and Information Architecture Diagrams (CIAD) with ...
- Language Learning | Language School E- Learning | Sentence ...
- Skype - eLearning Learning | How To Create Presentation for ...
- Skype - eLearning Learning | One formula of professional mind ...

