Physics Diagrams
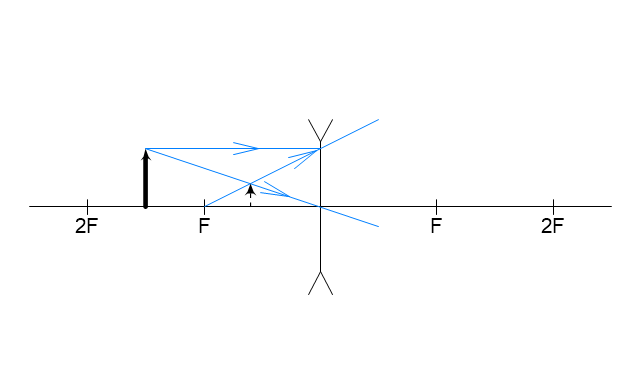
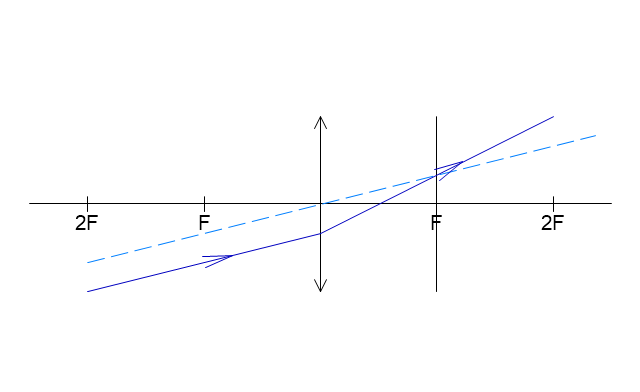
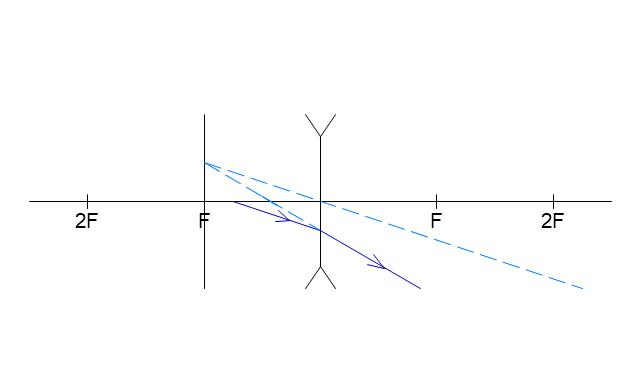
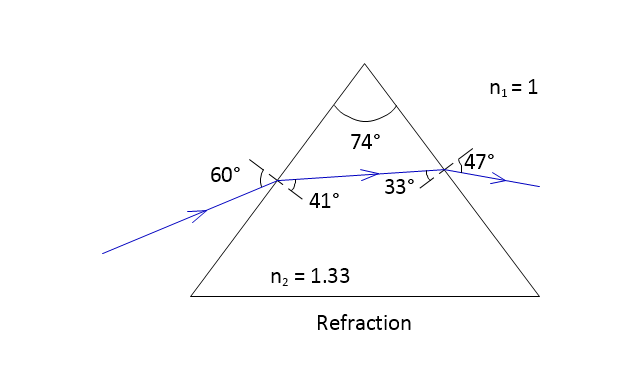
ConceptDraw DIAGRAM diagramming and vector drawing software extended with Physics solution from the Science and Education area is the best for creating: physics diagrams, pictures which describe various physical facts and experiments, illustrations of various electrical, mechanical and optic processes, of any complexity quick and easy.
 Physics
Physics solution extends ConceptDraw DIAGRAM software with templates, samples and libraries of vector stencils for drawing the physical illustrations, diagrams and charts.
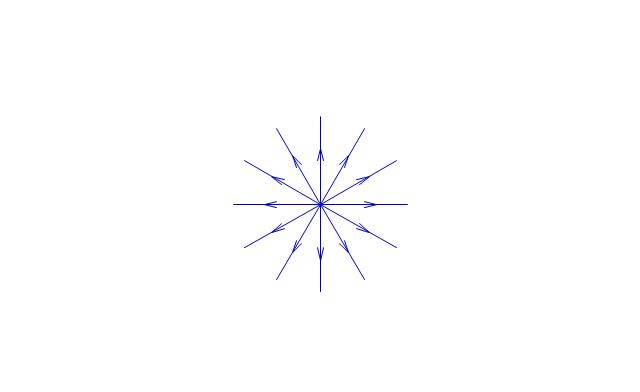
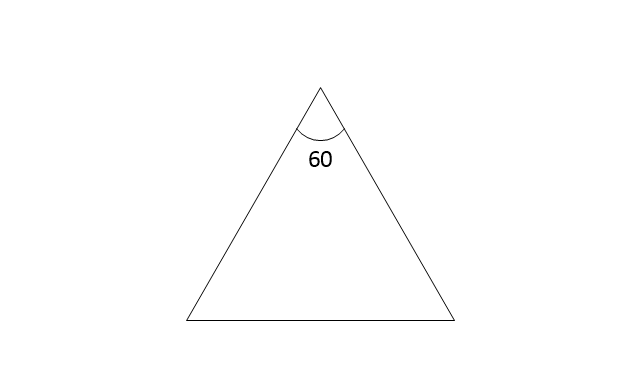
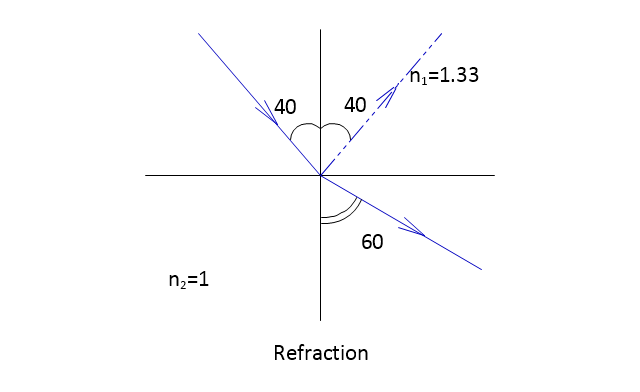
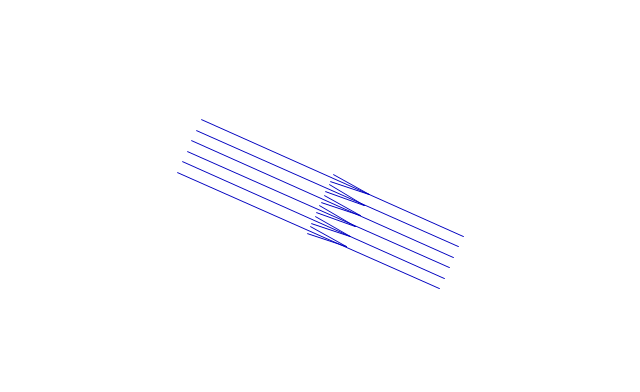
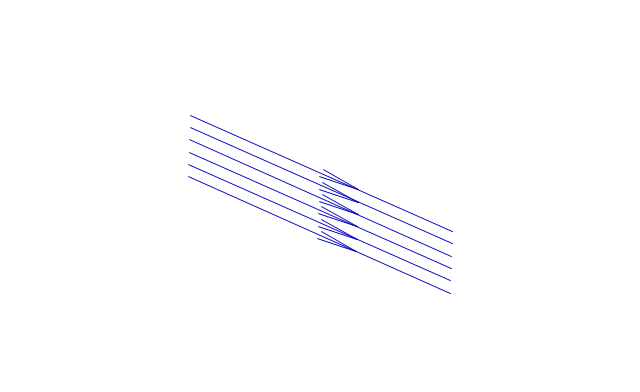
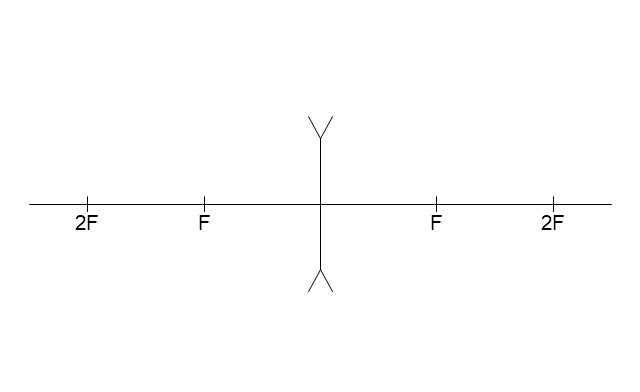
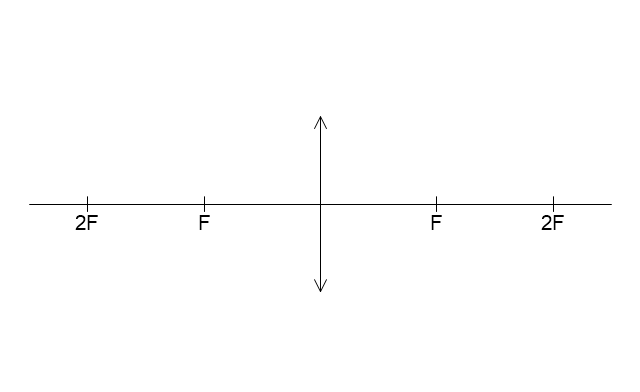
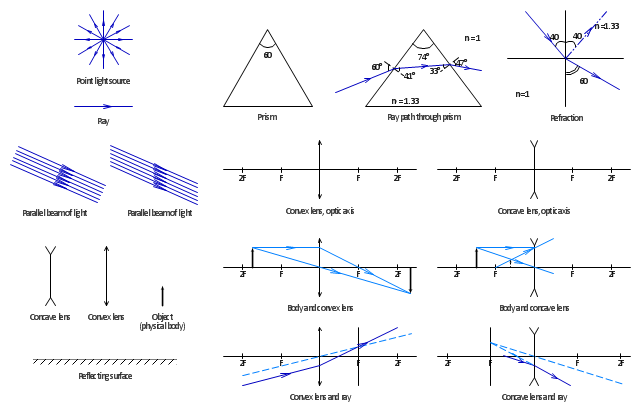
The vector stencils library "Optics" contains 17 symbol icons: reflecting surface; convex and concave lens with and without optic axis, body or ray; ray; parallel beam of light; point light source; prism with and without ray path; refraction.
Use these shapes for drawing physical schemes of geometrical optics experiments and ray tracing diagrams in the ConceptDraw PRO diagramming and vector drawing software extended with the Physics solution from the Science and Education area of ConceptDraw Solution Park.
www.conceptdraw.com/ solution-park/ science-education-physics
Process Flow Chart Symbols
Process Flow Chart is a visual diagram which shows the processes and relationships between the major components in a system, and uses for this the special process flow chart symbols: special shapes to represent different types of actions and process steps, lines and arrows to represent relationships and sequence of steps. It often named process flow diagram, it use colored flowchart symbols. It is incredibly convenient to use the ConceptDraw DIAGRAM software extended with Flowcharts Solution from the "Diagrams" Area of ConceptDraw Solution Park for designing professional looking Process Flow Charts.Workflow Diagram Symbols
Workflow Diagram is an acknowledged method of drawing the processes and business processes, which uses the concerted set of symbols for depicting different kinds of steps or relations. Often it is named the Process Flow Diagram, but the real Process Flow Diagram uses different visual notations and different flowchart symbols. The professionally designed Workflow diagram also may be used for the same purpose as a Critical process flow diagram. Nevertheless, there are many cases when you may need to make your Workflow Diagram more bright and graphic. ConceptDraw DIAGRAM diagramming software extended with Workflow Diagrams solution from Business Processes area of ConceptDraw Solution Park possesses the powerful properties of software for Workflow diagram design. It delivers rich set of business process workflow diagram symbols, which help users to accurately diagram the workflow scenarios and to design great-looking and attractive Workflow Diagrams and Process Flow Diagrams better-suited for presentations, websites, reports, and other documents.Physics Symbols
ConceptDraw DIAGRAM diagramming and vector drawing software extended with Physics solution from the Science and Education area is a powerful software for creating various physics diagrams. Physics solution provides all tools that you can need for physics diagrams designing. It includes 3 libraries with predesigned vector physics symbols: Optics Library, Mechanics Library and Nuclear Physics Library.Seating Chart Template
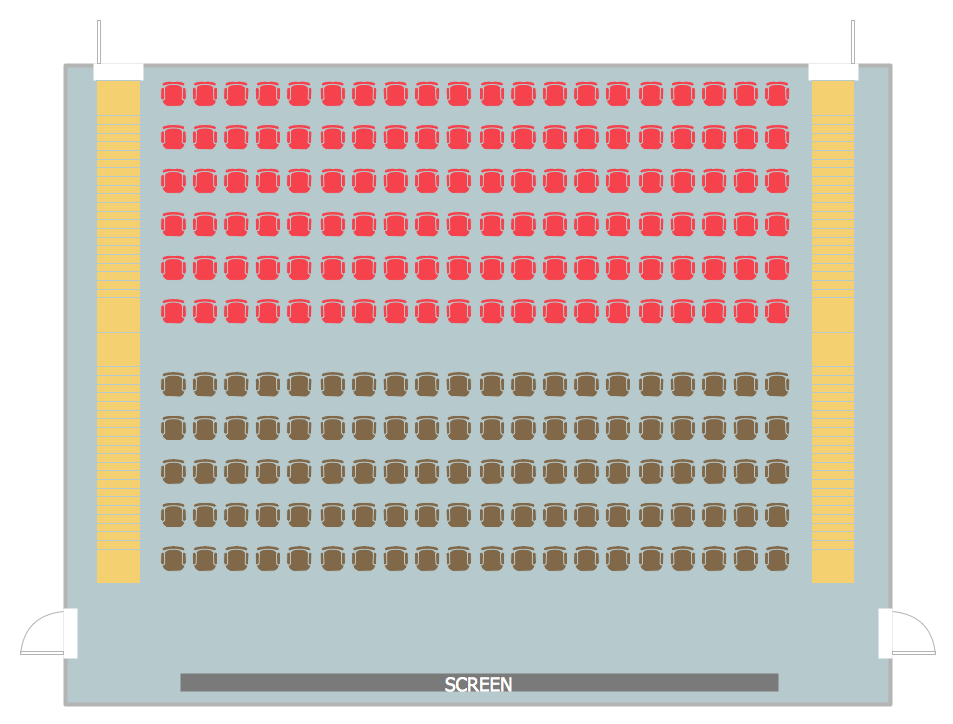
Seating chart developing is necessity for constructing and building the cinemas, theaters, banquet halls, auditoriums, and other premises for accommodation a large number of people. Seating chart template can help you design professional looking seating plan. ConceptDraw DIAGRAM diagramming and vector drawing software recommends you to use the Seating Plans solution from the Building Plans area for designing the seating charts.Software development with ConceptDraw DIAGRAM
Modern software development requires creation of large amount of graphic documentation, these are the diagrams describing the work of applications in various notations and cuts, also GUI design and documentation on project management. ConceptDraw DIAGRAM technical and business graphics application possesses powerful tools for software development and designing technical documentation for object-oriented projects. Solutions included to the Software Development area of ConceptDraw Solution Park provide the specialists with possibility easily and quickly create graphic documentation. They deliver effective help in drawing thanks to the included package of templates, samples, examples, and libraries with numerous ready-to-use vector objects that allow easily design class hierarchies, object hierarchies, visual object-oriented designs, flowcharts, GUI designs, database designs, visualize the data with use of the most popular notations, including the UML and Booch notations, easy manage the development projects, automate projection and development.Is ConceptDraw DIAGRAM an Alternative to Microsoft Visio?
Visio for Mac and Windows - ConceptDraw as an alternative to MS Visio. ConceptDraw DIAGRAM delivers full-functioned alternative to MS Visio. ConceptDraw DIAGRAM supports import of Visio files. ConceptDraw DIAGRAM supports flowcharting, swimlane, orgchart, project chart, mind map, decision tree, cause and effect, charts and graphs, and many other diagram types.The vector stencils library "Optics" contains 17 symbol icons: reflecting surface; convex and concave lens with and without optic axis, body or ray; ray; parallel beam of light; point light source; prism with and without ray path; refraction.
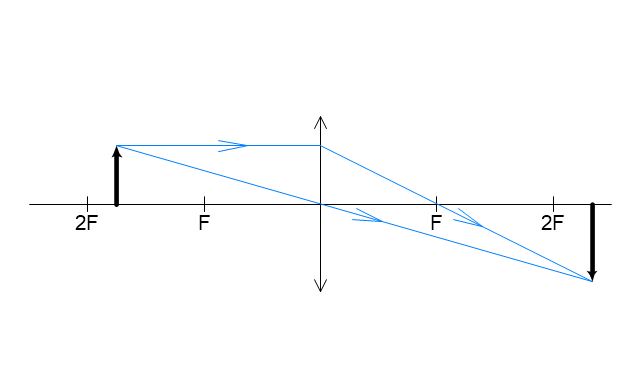
Use these shapes for drawing schemes of physical experiments in geometrical optics and ray tracing diagrams.
"Geometrical optics, or ray optics, describes light propagation in terms of "rays". The "ray" in geometric optics is an abstraction, or "instrument", which can be used to approximately model how light will propagate. Light rays are defined to propagate in a rectilinear path as they travel in a homogeneous medium. Rays bend (and may split in two) at the interface between two dissimilar media, may curve in a medium where the refractive index changes, and may be absorbed and reflected. Geometrical optics provides rules, which may depend on the color (wavelength) of the ray, for propagating these rays through an optical system. This is a significant simplification of optics that fails to account for optical effects such as diffraction and interference. It is an excellent approximation, however, when the wavelength is very small compared with the size of structures with which the light interacts. Geometric optics can be used to describe the geometrical aspects of imaging, including optical aberrations." [Geometrical optics. Wikipedia]
The example "Design elements - Optics" was created using the ConceptDraw PRO diagramming and vector drawing software extended with the Physics solution from the Science and Education area of ConceptDraw Solution Park.
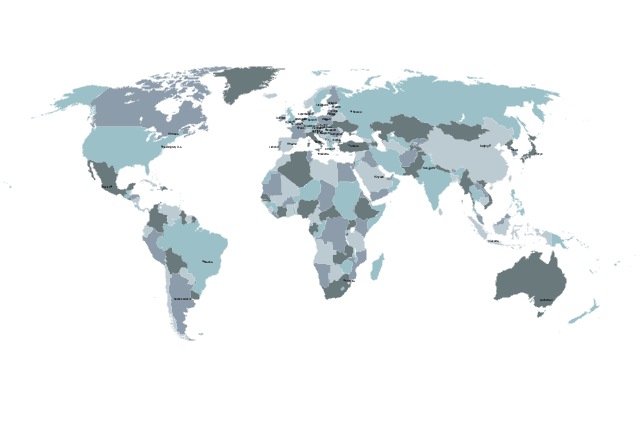
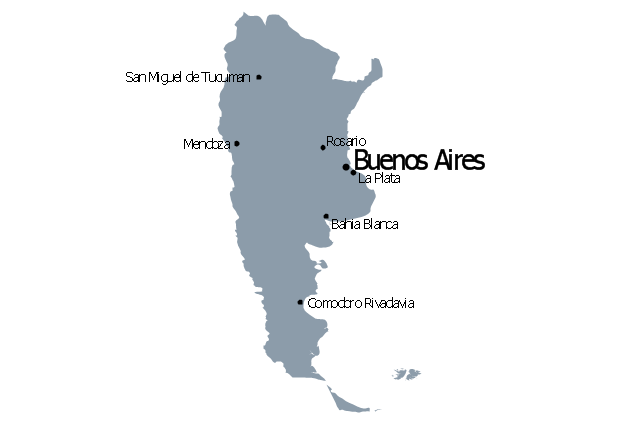
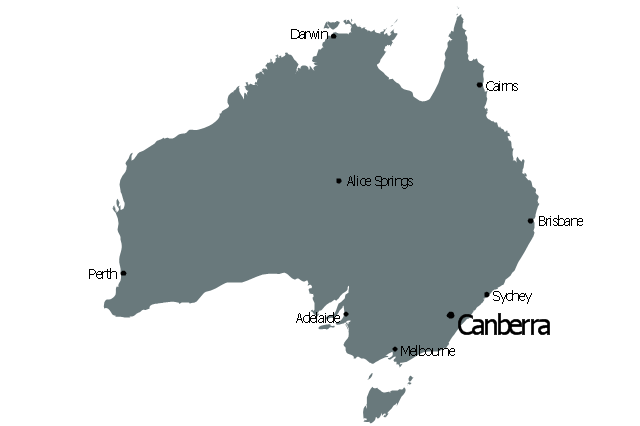
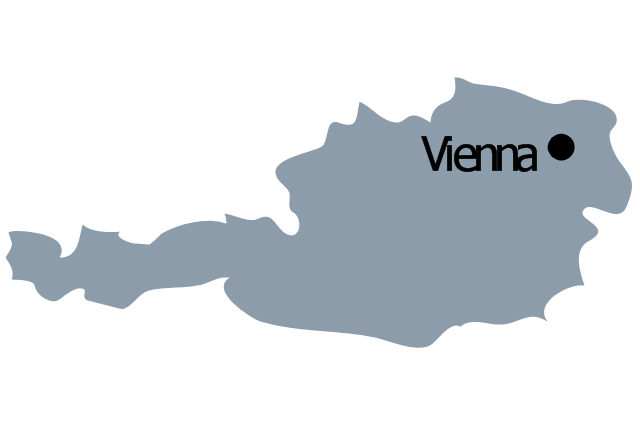
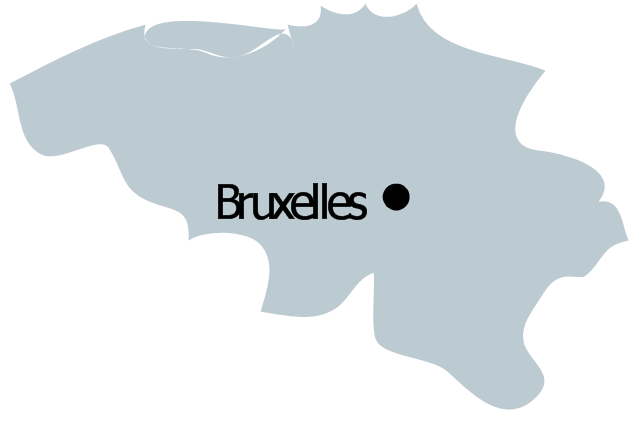
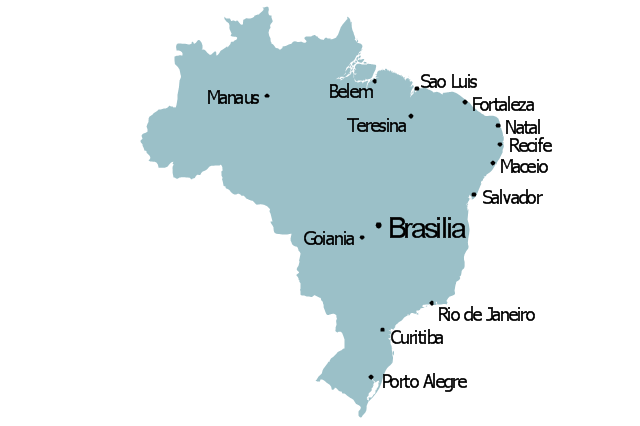
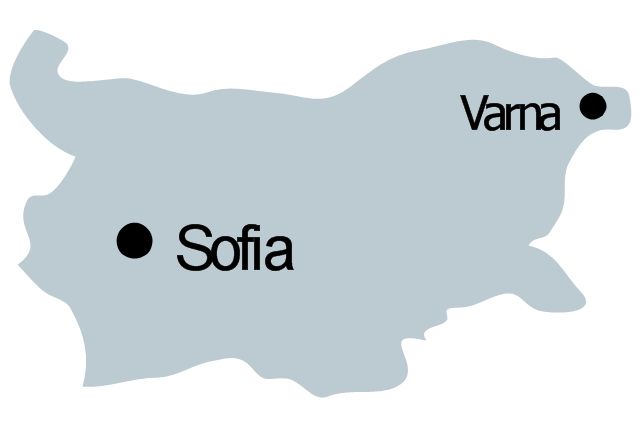
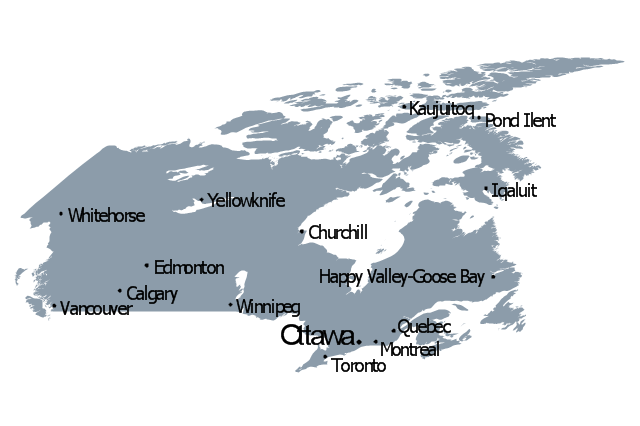
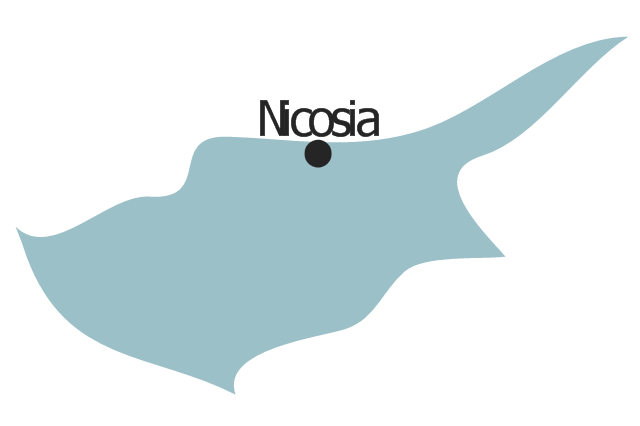
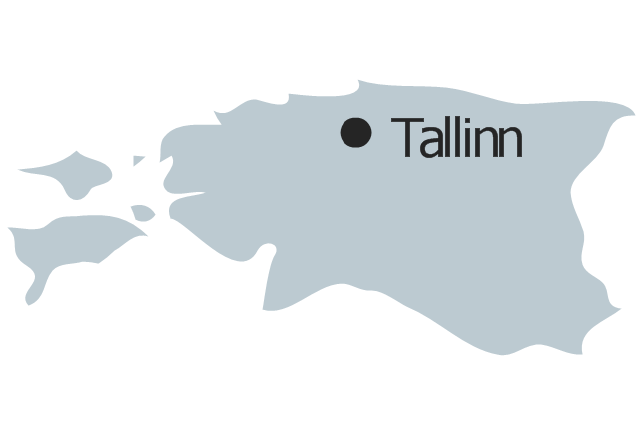
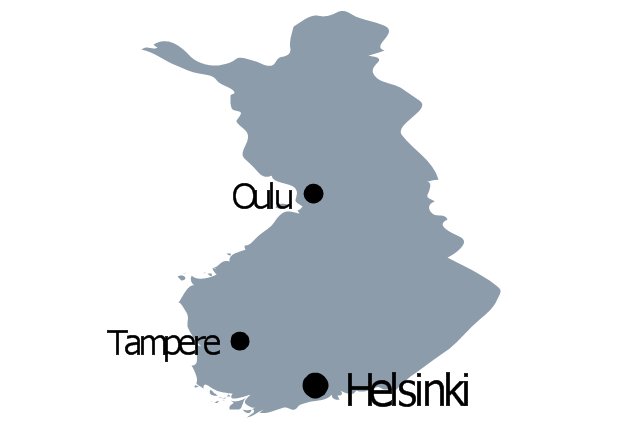
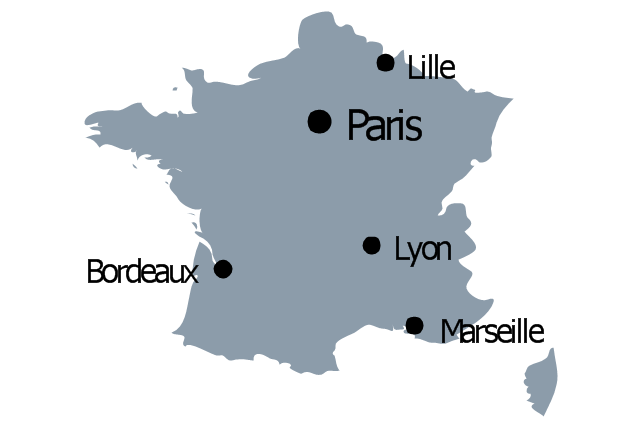
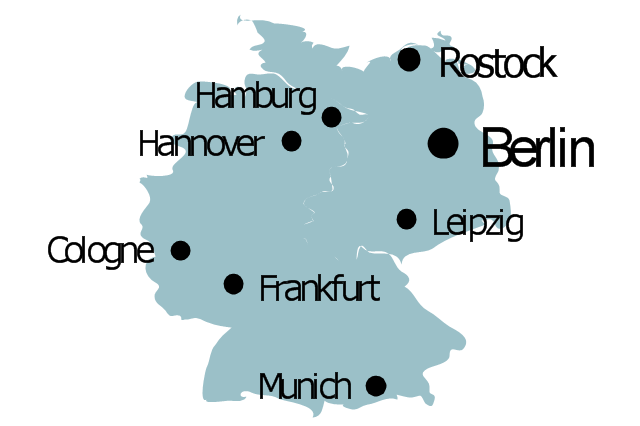
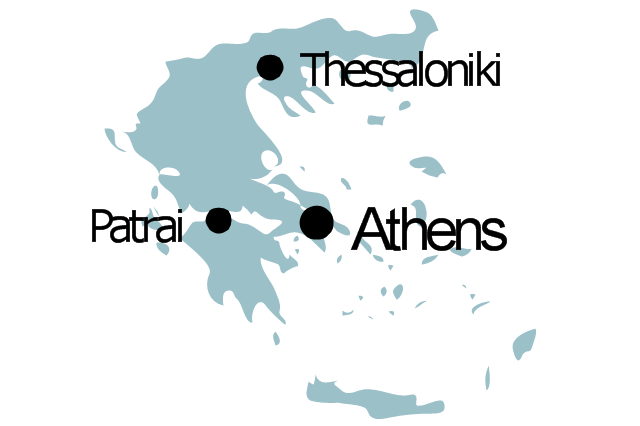
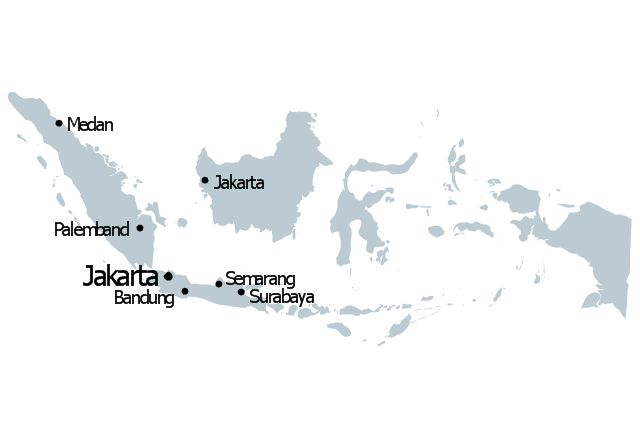
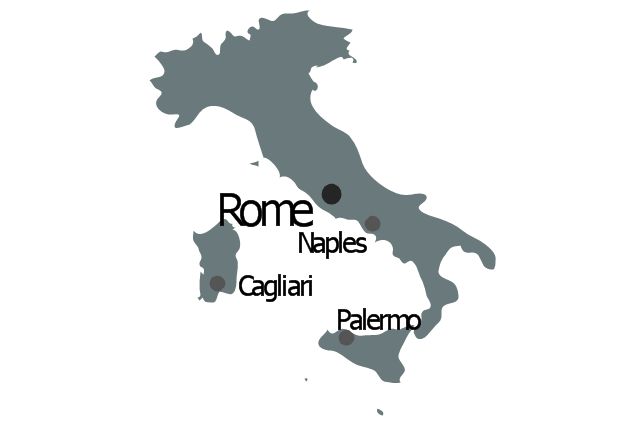
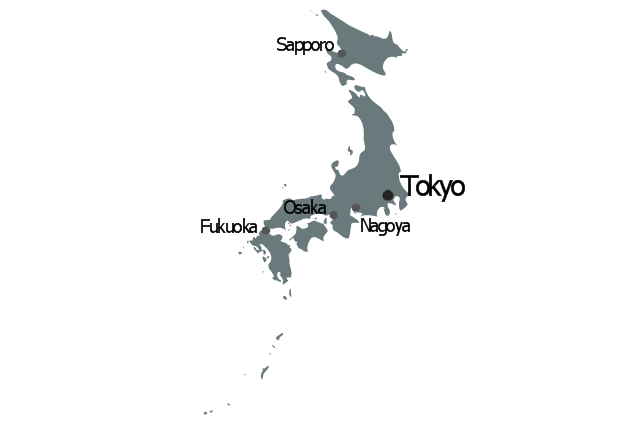
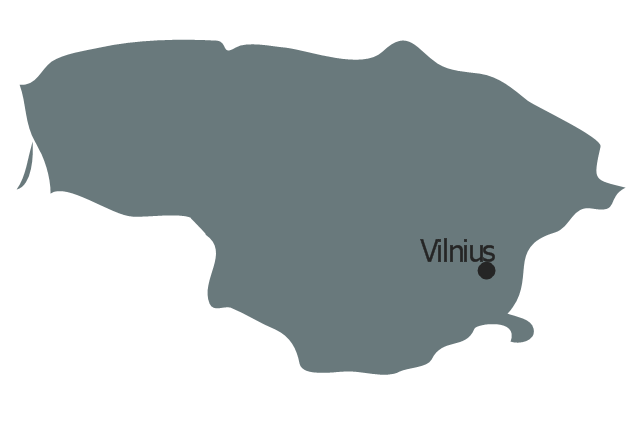
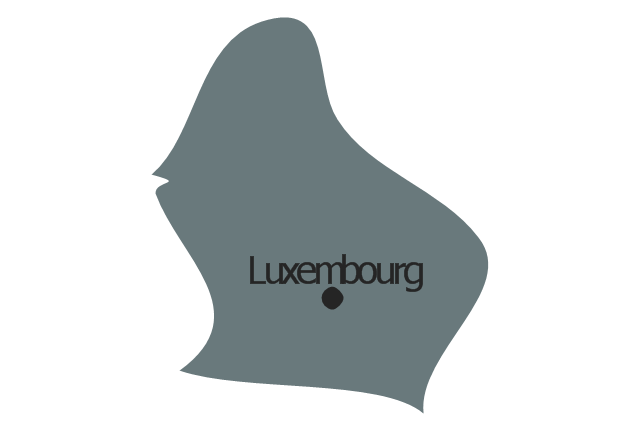
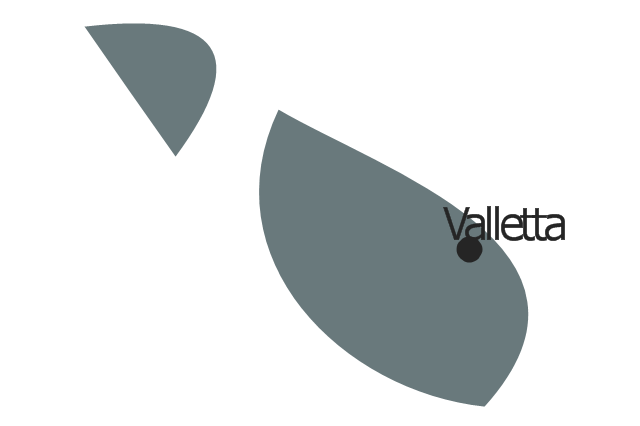
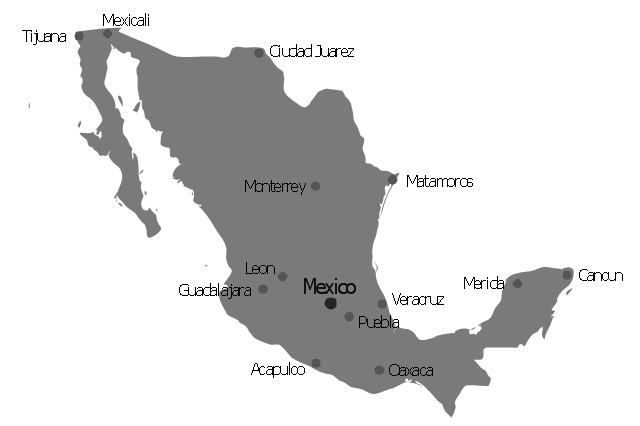
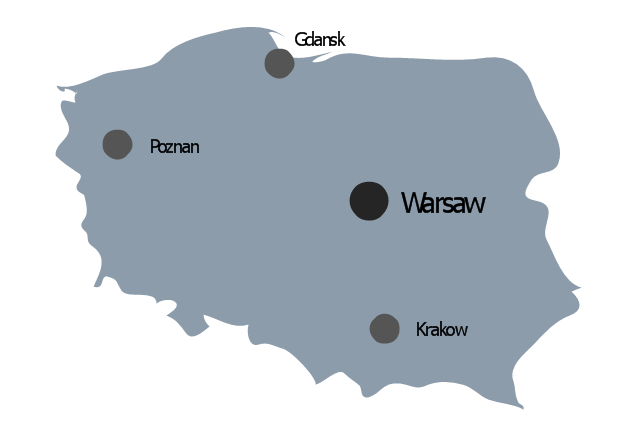
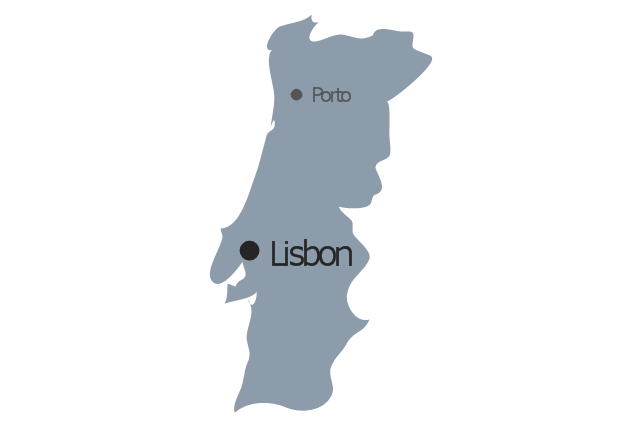
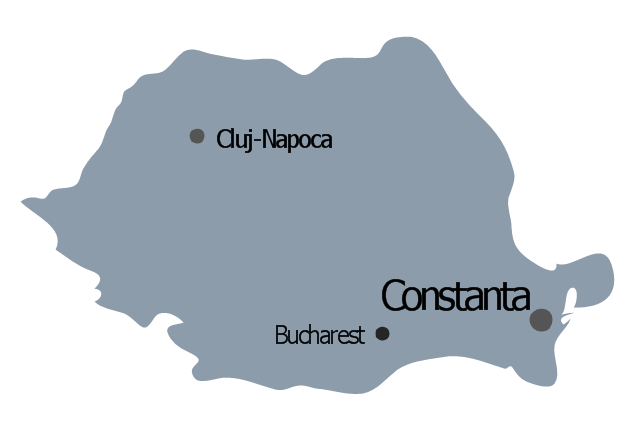
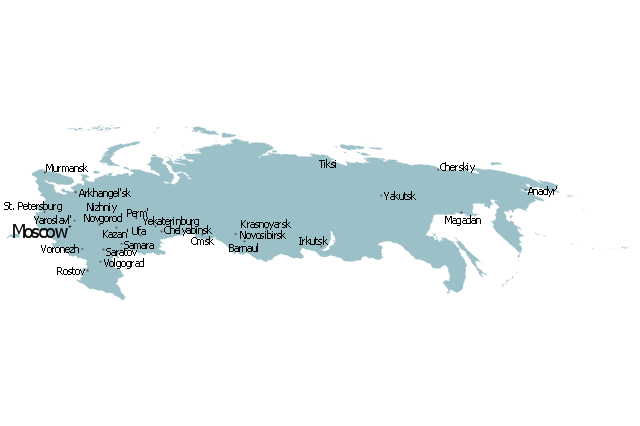
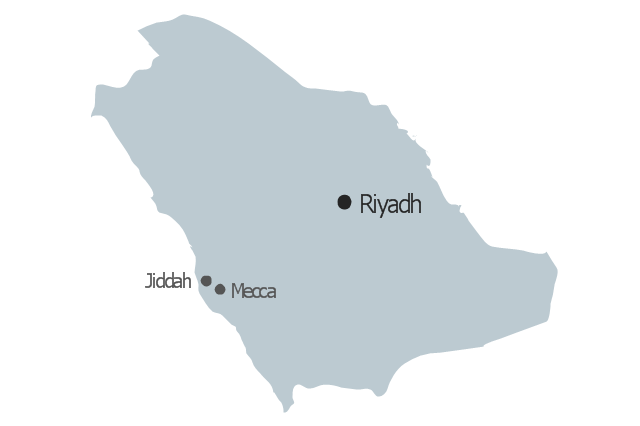
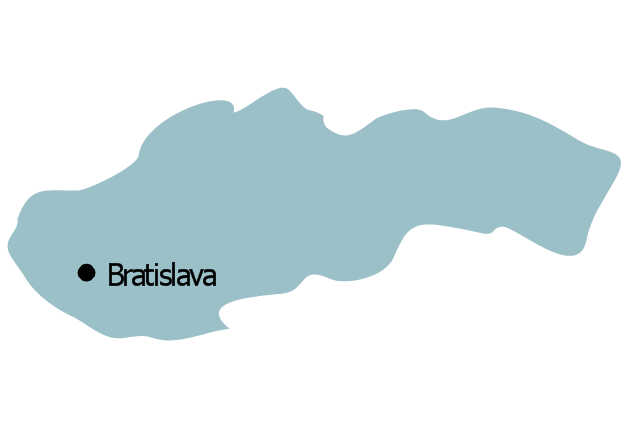
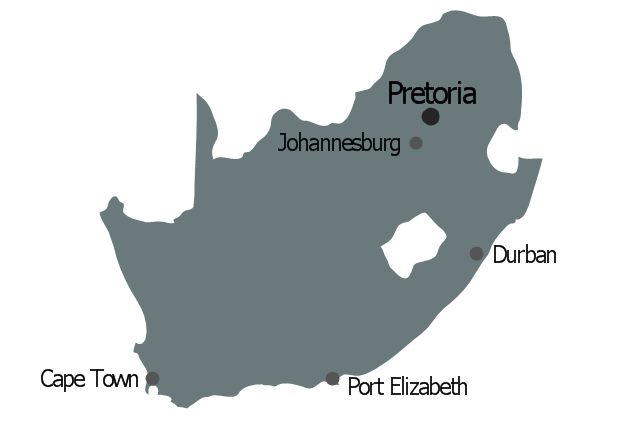
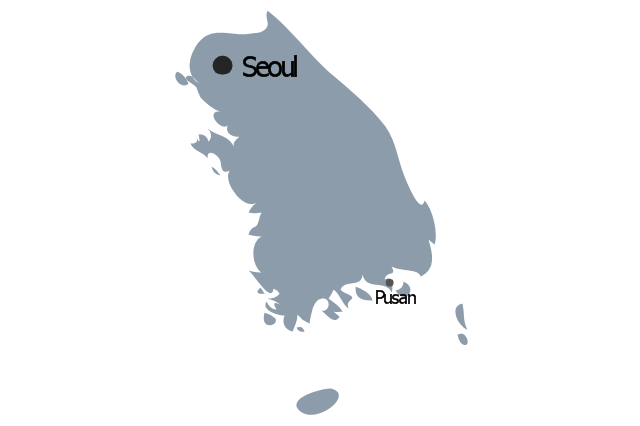
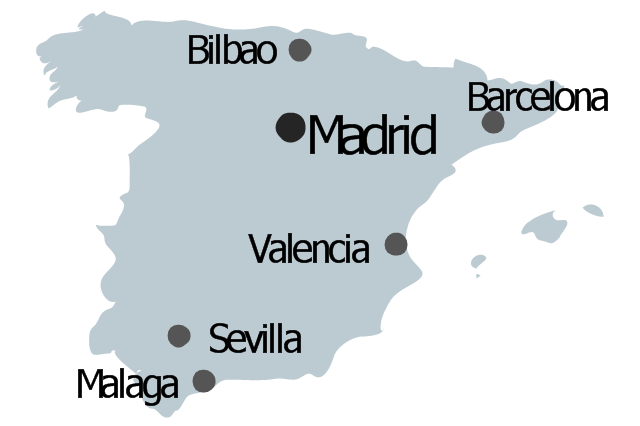
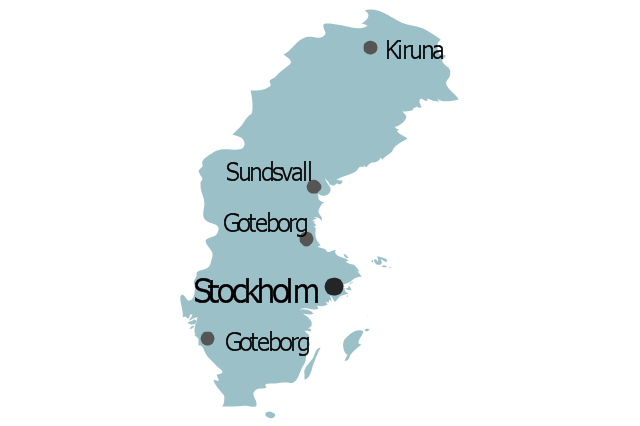
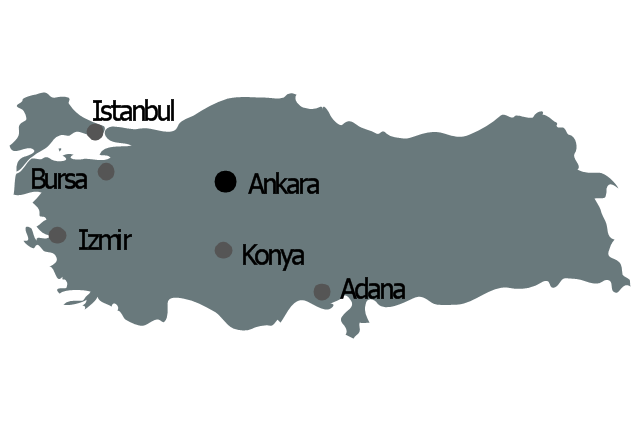
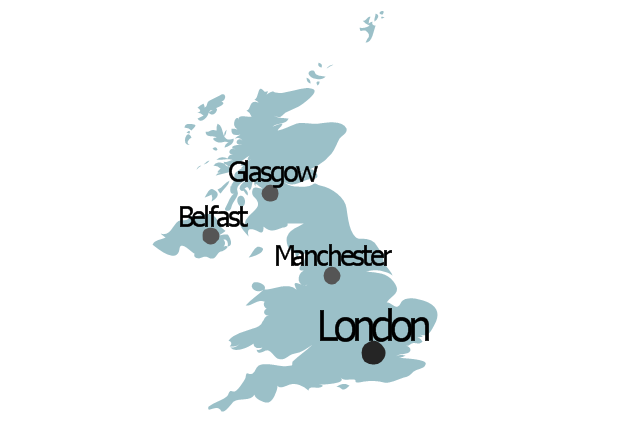
The vector stencils library "Management maps" contains 44 map contours: G-20 state maps, EU state maps and world map.
Use it to create your management infogram in the ConceptDraw PRO diagramming and vector drawing software.
The state map contours example "Management maps - Vector stencils library" is included in the solution "Marketing infographics" from the "Business infographics" area of ConceptDraw Solution Park.
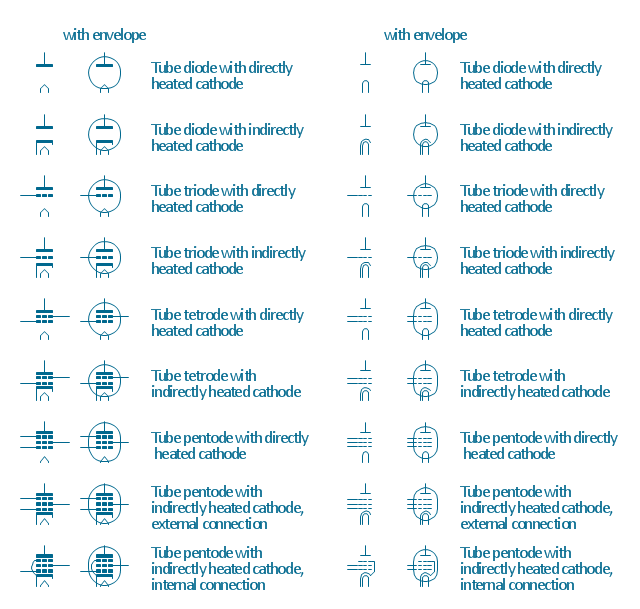
The vector stencils library "Design elements - Electron tubes" contains 36 element symbols of electron tubes.
Use it for drawing electrical schematics and electronic circuit diagrams.
"One classification of vacuum tubes is by the number of active electrodes, (neglecting the filament or heater). A device with two active elements is a diode, usually used for rectification. Devices with three elements are triodes used for amplification and switching. Additional electrodes create tetrodes, pentodes, and so forth, which have multiple additional functions made possible by the additional controllable electrodes.
Other classifications are:
(1) by frequency range (audio, radio, VHF, UHF, microwave),
(2) by power rating (small-signal, audio power, high-power radio transmitting),
(3) by design (e.g., sharp- versus remote-cutoff in some pentodes),
(4) by application (receiving tubes, transmitting tubes, amplifying or switching, rectification, mixing),
(5) special qualities (long life, very low microphonic and low noise audio amplification, and so on).
Multiple classifications may apply to a device; for example similar dual triodes can be used for audio preamplification and as flip-flops in computers, although linearity is important in the former case and long life in the latter.
Tubes have different functions, such as cathode ray tubes which create a beam of electrons for display purposes (such as the television picture tube) in addition to more specialized functions such as electron microscopy and electron beam lithography. X-ray tubes are also vacuum tubes. Phototubes and photomultipliers rely on electron flow through a vacuum, though in those cases electron emission from the cathode depends on energy from photons rather than thermionic emission." [Vacuum tube. Wikipedia]
The symbols example "Design elements - Electron tubes" was drawn using the ConceptDraw PRO diagramming and vector drawing software extended with the Electrical Engineering solution from the Engineering area of ConceptDraw Solution Park.
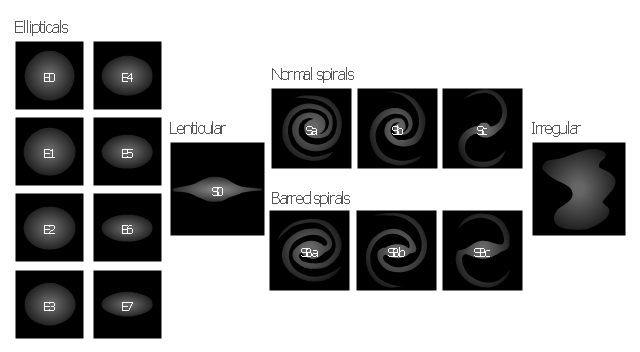
The vector stencils library "Galaxies" contains 15 galaxy symbols for drawing astronomical diagrams.
"A galaxy is a massive, gravitationally bound system consisting of stars, stellar remnants, an interstellar medium of gas and dust, and dark matter, an important but poorly understood component. The word galaxy is derived from the Greek galaxias ..., literally "milky", a reference to the Milky Way. Examples of galaxies range from dwarfs with as few as ten million (10^7) stars to giants with one hundred trillion (10^14) stars, each orbiting their galaxy's own center of mass.
Galaxies contain varying numbers of planets, star systems, star clusters and types of interstellar clouds. In between these objects is a sparse interstellar medium of gas, dust, and cosmic rays. Supermassive black holes reside at the center of most galaxies. They are thought to be the primary driver of active galactic nuclei found at the core of some galaxies. The Milky Way galaxy is known to harbor at least one such object.
Galaxies have been historically categorized according to their apparent shape, usually referred to as their visual morphology. A common form is the elliptical galaxy, which has an ellipse-shaped light profile. Spiral galaxies are disk-shaped with dusty, curving arms. Those with irregular or unusual shapes are known as irregular galaxies and typically originate from disruption by the gravitational pull of neighboring galaxies. Such interactions between nearby galaxies, which may ultimately result in a merger, sometimes induce significantly increased incidents of star formation leading to starburst galaxies. Smaller galaxies lacking a coherent structure are referred to as irregular galaxies."
[Galaxy. Wikipedia]
The example "Design elements - Galaxies" was created using the ConceptDraw PRO diagramming and vector drawing software extended with the Astronomy solution from the Science and Education area of ConceptDraw Solution Park.
The vector stencils library "Periodic table of chemical elements" contains 119 icon symbols of chemical elements for drawing Mendeleev's periodic table, chemical diagrams, infographics and illustrations.
"A chemical element is a pure chemical substance consisting of a single type of atom distinguished by its atomic number, which is the number of protons in its atomic nucleus. Elements are divided into metals, metalloids, and non-metals. Familiar examples of elements are carbon, nitrogen, oxygen (non-metals), silicon, arsenic (metalloids), aluminium, iron, copper, gold, mercury, and lead (metals).
The lightest chemical elements, including hydrogen, helium and smaller amounts of lithium, beryllium and boron, are thought to have been produced by various cosmic processes during the Big Bang and cosmic-ray spallation. Production of heavier elements, from carbon to the very heaviest elements, proceeded by stellar nucleosynthesis, and these were made available for later solar system and planetary formation by planetary nebulae and supernovae, which blast these elements into space. The high abundance of oxygen, silicon, and iron on Earth reflects their common production in such stars. While most elements are generally stable, a small amount of natural transformation of one element to another also occurs in the decay of radioactive elements as well as other natural nuclear processes." [Chemical element. Wikipedia]
The chemical symbols example "Design elements - Periodic table of chemical elements" was created using the ConceptDraw PRO software extended with the Chemistry solution from the Science and Education area of ConceptDraw Solution Park.
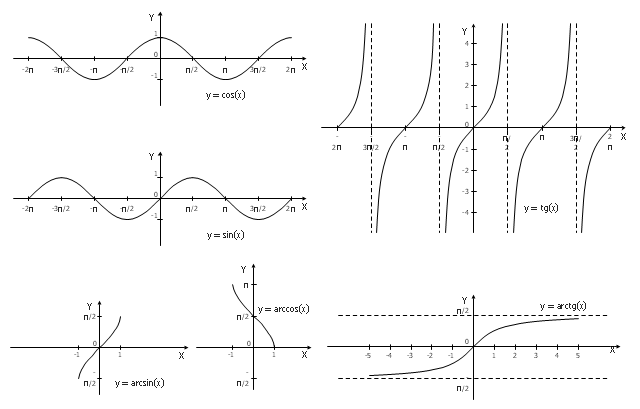
The vector stencils library "Trigonometric functions" contains 8 shapes of trigonometrical and inverse trigonometrical functions graphs.
"In mathematics, the trigonometric functions (also called the circular functions) are functions of an angle. They relate the angles of a triangle to the lengths of its sides. Trigonometric functions are important in the study of triangles and modeling periodic phenomena, among many other applications.
The most familiar trigonometric functions are the sine, cosine, and tangent. In the context of the standard unit circle with radius 1 unit, where a triangle is formed by a ray originating at the origin and making some angle with the x-axis, the sine of the angle gives the length of the y-component (the opposite to the angle or the rise) of the triangle, the cosine gives the length of the x-component (the adjacent of the angle or the run), and the tangent function gives the slope (y-component divided by the x-component). More precise definitions are detailed below. Trigonometric functions are commonly defined as ratios of two sides of a right triangle containing the angle, and can equivalently be defined as the lengths of various line segments from a unit circle. More modern definitions express them as infinite series or as solutions of certain differential equations, allowing their extension to arbitrary positive and negative values and even to complex numbers." [Trigonometric functions. Wikipedia]
The shapes example "Design elements - Trigonometric functions" was created using the ConceptDraw PRO diagramming and vector drawing software extended with the Mathematics solution from the Science and Education area of ConceptDraw Solution Park.
- Optics - Vector stencils library | Physics | Physics Diagrams ...
- Physics Diagrams | Physics | Optics - Vector stencils library | Physics ...
- Physics Diagrams | Optics - Vector stencils library | Physics | Ray ...
- Physics Diagrams | Physics | Ray Diagrams For Lens Clipart
- Physics Diagrams | Physics | Concave Lens Ray Diagram Real Image
- Ray tracing diagram for concave lens | Physics Diagrams | Physics ...
- Physics Diagrams | Physics Symbols | Cisco Optical. Cisco icons ...
- Mathematical pendulum diagram | Physics | Mechanics - Vector ...
- Ray tracing diagram for concave lens
- Physics Diagrams | Physics | ConceptDraw Arrows10 Technology ...
- Physics Symbols | Physics Diagrams | Cisco Optical. Cisco icons ...
- Physics Diagrams
- Geometrical Designs Diagrams
- Physics Symbols | Physics Diagrams | Physics | Physics Science
- Geometrical Diagram
- Mathematical pendulum diagram | Physics | Mechanics - Vector ...
- Design elements - Nuclear physics | Nuclear physics - Vector ...
- Cisco Optical. Cisco icons, shapes, stencils and symbols | Cisco ...
- Design elements - Solid geometry | Design elements - Optics | Solid ...
- Free-body diagram | Physics Diagrams | How to Draw Physics ...


