HelpDesk
How to Draw a Chemical Process Flow Diagram
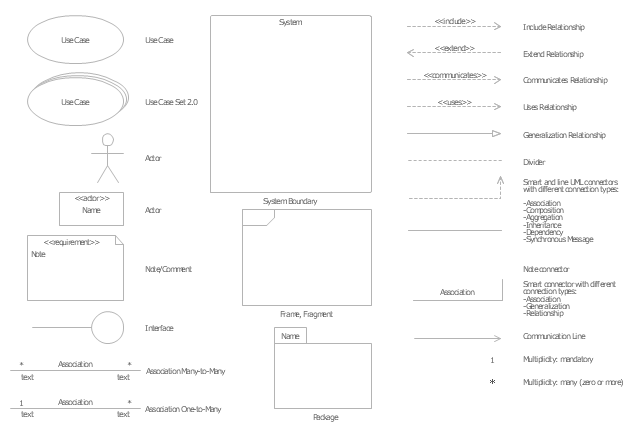
Process Flow Diagram widely used in modeling of processes in the chemical industry. A Chemical Process Flow diagram (PFD) is a specialized type of flowchart. With the help of Chemical Process Flow Diagram engineers can easily specify the general scheme of the processes and chemical plant equipment. Chemical Process Flow Diagram displays the real scheme of the chemical process, the relationship between the equipment and the technical characteristics of the process. Chemical Process Flow Diagram illustrates the connections between the basic equipment as well as the overall structure of pipelines and other supporting equipment. The purpose of the PFD is to build the image of the basic idea of the chemical process. ConceptDraw PRO together with its Chemical and Process Engineering solution delivers the possibility to design Chemical Process Flow diagrams. It is designed for chemical industry engineers and designers.The vector stencils library "UML use case diagrams" contains 25 symbols for the ConceptDraw PRO diagramming and vector drawing software.
"Use case diagrams are usually referred to as behavior diagrams used to describe a set of actions (use cases) that some system or systems (subject) should or can perform in collaboration with one or more external users of the system (actors). Each use case should provide some observable and valuable result to the actors or other stakeholders of the system. ...
Use case diagrams are in fact twofold - they are both behavior diagrams, because they describe behavior of the system, and they are also structure diagrams - as a special case of class diagrams where classifiers are restricted to be either actors or use cases related to each other with associations. ...
Use case is usually shown as an ellipse containing the name of the use case. ...
Name of the use case could also be placed below the ellipse. ...
If a subject (or system boundary) is displayed, the use case ellipse is visually located inside the system boundary rectangle. Note, that this does not necessarily mean that the subject classifier owns the contained use cases, but merely that the use case applies to that classifier. ...
A list of use case properties - operations and attributes - could be shown in a compartment within the use case oval below the use case name. ...
Use case with extension points may be listed in a compartment of the use case with the heading extension points. ...
A use case can also be shown using the standard rectangle notation for classifiers with an ellipse icon in the upper right-hand corner of the rectangle and with optional separate list compartments for its features. ...
Subject (sometimes called a system boundary) is presented by a rectangle with subject's name, associated keywords and stereotypes in the upper left corner. Use cases applicable to the subject are located inside the rectangle and actors - outside of the system boundary. ...
Standard UML notation for actor is "stick man" icon with the name of the actor above or below of the icon. Actor names should follow the capitalization and punctuation guidelines for classes. The names of abstract actors should be shown in italics. ...
Custom icons that convey the kind of actor may also be used to denote an actor, such as using a separate icon(s) for non-human actors. ...
An actor may also be shown as a class rectangle with the standard keyword «actor», having usual notation for class compartments ...
An actor can only have binary associations to use cases, components, and classes. ...
An association between an actor and a use case indicates that the actor and the use case somehow interact or communicate with each other.
Only binary associations are allowed between actors and use cases.
An actor could be associated to one or several use cases. ...
A use case may have one or several associated actors." [uml-diagrams.org/ use-case-diagrams.html]
The example "Design elements - UML use case diagrams" is included in the Rapid UML solution from the Software Development area of ConceptDraw Solution Park.
"Chen's notation for entity–relationship modeling uses rectangles to represent entity sets, and diamonds to represent relationships appropriate for first-class objects: they can have attributes and relationships of their own. If an entity set participates in a relationship set, they are connected with a line.
Attributes are drawn as ovals and are connected with a line to exactly one entity or relationship set.
Cardinality constraints are expressed as follows:
- a double line indicates a participation constraint, totality or surjectivity: all entities in the entity set must participate in at least one relationship in the relationship set;
- an arrow from entity set to relationship set indicates a key constraint, i.e. injectivity: each entity of the entity set can participate in at most one relationship in the relationship set;
- a thick line indicates both, i.e. bijectivity: each entity in the entity set is involved in exactly one relationship.
- an underlined name of an attribute indicates that it is a key: two different entities or relationships with this attribute always have different values for this attribute.
Attributes are often omitted as they can clutter up a diagram; other diagram techniques often list entity attributes within the rectangles drawn for entity sets." [Entity–relationship model. Wikipedia]
The vector stencils library ERD, Chen's notation contains 13 symbols for drawing entity-relatinship diagrams using the ConceptDraw PRO diagramming and vector drawing software.
The example "Design elements - ER diagram (Chen notation)" is included in the Entity-Relationship Diagram (ERD) solution from the Software Development area of ConceptDraw Solution Park.
HelpDesk
How to Create a BPMN Diagram Using ConceptDraw PRO
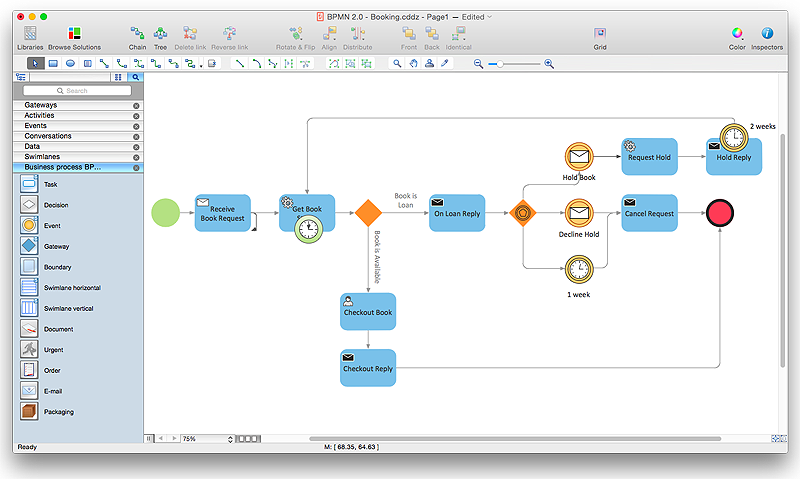
Business Process Modeling Notation (BPMN) is a method of illustrating business processes in the form of a diagram. The most effective method of creating or analyzing a business process is to visually interpret the steps using a business process diagram, flowchart or workflow. This is known as business process modeling, and will be performed within a company by a team who have detailed knowledge of company process, and analysts with expertise in the modeling discipline. The objective is often to increase production or lower costs — by modeling the process initially using a flowchart, inefficiencies and problems can be spotted before committing to a decision or strategy. You can create BPMN diagrams using the ConceptDraw PRO diagramming tools. ConceptDraw have designed a solution that combines BPMN v2.0 methodology and graphical notification into one powerful package. The Business Process Diagrams solution from ConceptDraw Solution Park provides a comprehensive collection of vectorHelpDesk
How to Create a New Library
Sometimes, when creating a diagram, you need to use a large set of elements from different libraries. If you are using ConceptDraw , in such case, we recommend you to create a new library, which consists of vector library objects from other ConceptDraw libraries. You also can add some custom unique objects into such library. Each object that contains in a new library can be provided with a unique description and keyword list. Thus, the new library and its objects will be indexed to be searched and used in the further diagrams.HelpDesk
How to Create a Rack Diagram in ConceptDraw PRO
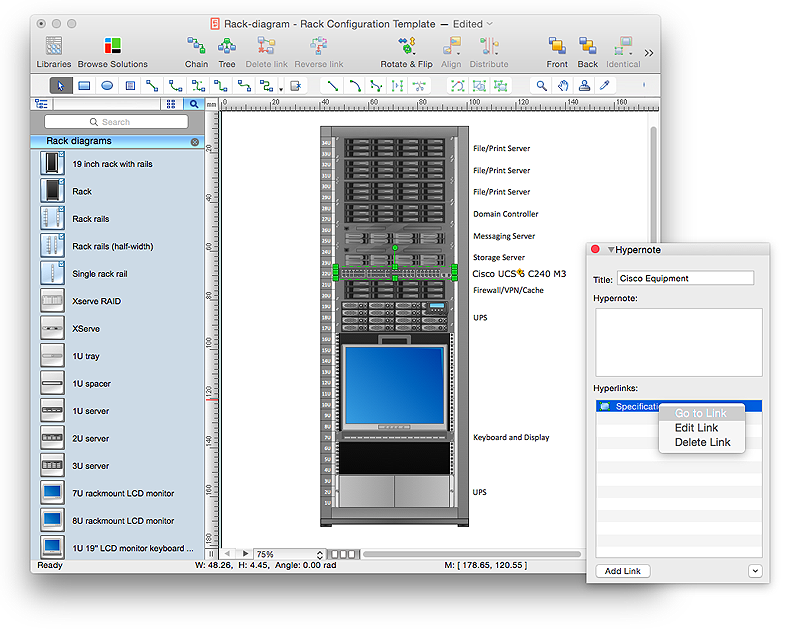
A Rack Diagram represents the rack mounting of network and computer equipment that is installed as a server. Rack diagrams are used by system administrators and network architectors when making a decision regarding the purchase of network equipment. It is used to show how a particular server configuration can be composed, without making its physical installation. ConceptDraw PRO enhanced with the Rack Diagrams Solution can be successfully used for making various rack diagrams. It's important that the solution used to create a rack diagram contains templates that stick to industry standards, and supplies a big selection of device icons to cover multiple types of equipment for a number of network configurations.HelpDesk
How to Create a Mechanical Diagram
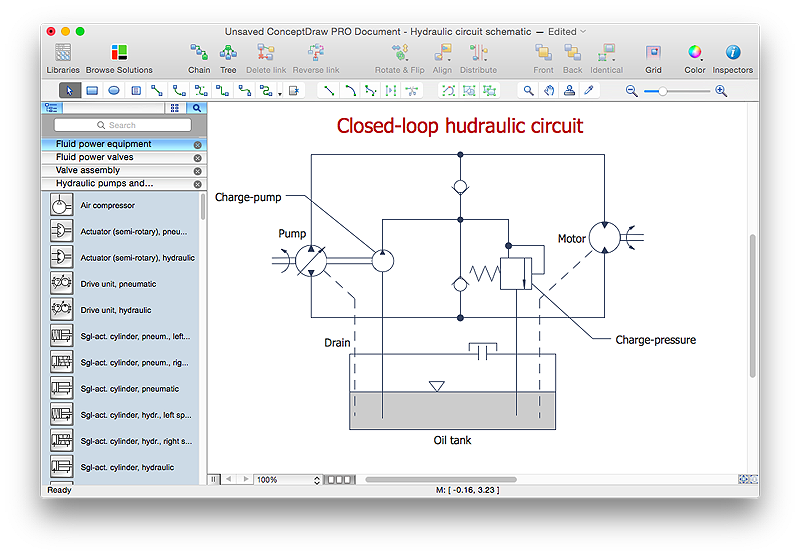
Mechanical Engineering drawing is a type of technical drawing that helps analyze complex engineering systems. Mechanical Engineering diagrams are often a set of detailed drawings used for engineering or construction projects. Making Mechanical Engineering diagram involves many different elements that can be managed using ConceptDraw PRO. You can design elements for drawing parts, assembly, pneumatic, and hydraulic systems for mechanical engineering. With ConceptDraw PRO you can easily create and communicate the Mechanical Engineering diagram of any complexity.- Design elements - ER diagram
- Erd Diagram Elements
- Design elements - UML use case diagrams | UML Diagram Types ...
- Design elements - UML use case diagrams | Interior Design Piping ...
- Computer Networking Tools List | How to Draw a Chemical Process ...
- List All Drawing Tools And Equipment For Design Their Uses And
- UML Diagram Types List | UML Deployment Diagram . Design ...
- List Of Tools And Equipment For Building Design And Their Uses
- Basic Flowchart Symbols and Meaning | Flowchart design ...
- List All The Networking Tools And Their Uses
- Design elements - ERD (crow's foot notation) | Entity Relationship ...
- 4 Level pyramid model diagram - Information systems types | 5 Level ...
- Design elements - ER diagram (Chen notation) | Design elements ...
- UML Deployment Diagram . Design Elements | UML Diagramming ...
- Sentence Diagram | How to Diagram Sentences in ConceptDraw ...
- UML Diagram Types List | UML Diagram Types | UML Diagram | Uml ...
- Entity Relationship Diagram Symbols | Data Flow Diagram Symbols ...
- Network Topologies | Fully Connected Network Topology Diagram ...
- Cross-Functional Flowchart (Swim Lanes) | Swim Lane Diagrams ...
- Draw An Element Of Computer System Showing Its Logical Structure


.png--diagram-flowchart-example.png)


