"Bars categorized by the kind of entertainment they offer include:
(1) Blues bars, specializing in the live blues style of music.
(2) Comedy Bar specializing in a stand-up comedy entertainment.
(3) Dance bars, which have a dance floor where patrons dance to recorded music.
(4) But if a dance bar has a large dance floor and hires well-known professional DJs, it is considered to be a nightclub or discothèque.
(5) Karaoke bars, with nightly karaoke as entertainment.
(6) Music bars, specializing in live music (i.e. concerts).
(7) Drag bars, which have live shows, where men dress as women and generally lip-sync to recordings of female vocal artists; often with hilarious results.
(8) Salsa bars, where patrons dance to Latin salsa music.
(9) Sports bars, where sports fans watch games on large-screen televisions.
(10) Topless bars, where topless female employees dance or serve drinks." [Bar (establishment). Wikipedia]
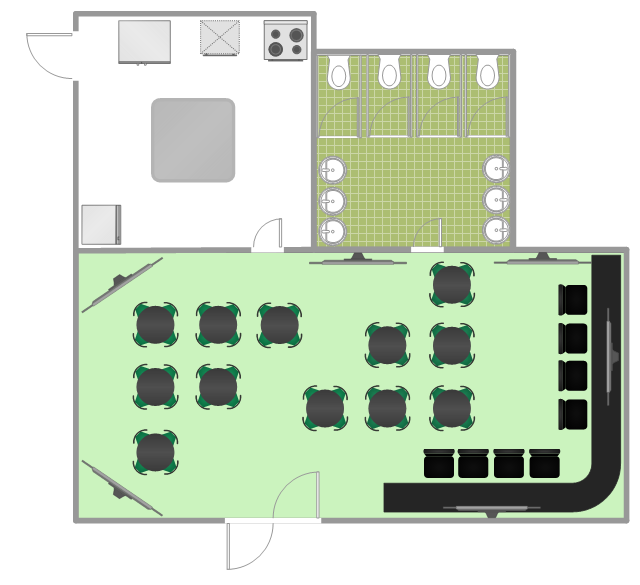
The floor plan example "Sports bar" was created using the ConceptDraw PRO diagramming and vector drawing software extended with the Cafe and Restaurant solution from the Building Plans area of ConceptDraw Solution Park.
(1) Blues bars, specializing in the live blues style of music.
(2) Comedy Bar specializing in a stand-up comedy entertainment.
(3) Dance bars, which have a dance floor where patrons dance to recorded music.
(4) But if a dance bar has a large dance floor and hires well-known professional DJs, it is considered to be a nightclub or discothèque.
(5) Karaoke bars, with nightly karaoke as entertainment.
(6) Music bars, specializing in live music (i.e. concerts).
(7) Drag bars, which have live shows, where men dress as women and generally lip-sync to recordings of female vocal artists; often with hilarious results.
(8) Salsa bars, where patrons dance to Latin salsa music.
(9) Sports bars, where sports fans watch games on large-screen televisions.
(10) Topless bars, where topless female employees dance or serve drinks." [Bar (establishment). Wikipedia]
The floor plan example "Sports bar" was created using the ConceptDraw PRO diagramming and vector drawing software extended with the Cafe and Restaurant solution from the Building Plans area of ConceptDraw Solution Park.
Floor plan
Hotel Plan. Hotel Plan Examples

Network Diagram Software. LAN Network Diagrams. Physical Office Network Diagrams


 PM Dashboards
The PM Dashboards solution extends the management boundaries of ConceptDraw DIAGRAM and ConceptDraw PROJECT products with an ability to demonstrate changes to the budget status, to show the project progress toward its objectives, to display clearly the identified key performance indicator (KPI) or the set of key performance indicators for any project. This solution provides you with examples and ability to generate three types of visual dashboards reports based on your project data Project Dashboard, Tactical Dashboard, and Radar Chart. By dynamically charting the project’s key performance indicators that are collected on one ConceptDraw DIAGRAM document page, all project participants, project managers, team members, team leaders, stakeholders, and the entire organizations, for which this solution is intended, have access to the daily status of projects they are involved in.
 Composition Dashboard
Composition dashboard solution extends ConceptDraw DIAGRAM software with templates, samples and vector stencils library with charts and indicators for drawing visual dashboards showing data composition.
 Correlation Dashboard
Correlation dashboard solution extends ConceptDraw DIAGRAM software with samples, templates and vector stencils library with Scatter Plot Charts for drawing the visual dashboard visualizing data correlation.
 Comparison Dashboard
Comparison dashboard solution extends ConceptDraw DIAGRAM software with samples, templates and vector stencils library with charts and indicators for drawing the visual dashboard comparing data.
 Time Series Dashboard
Time series dashboard solution extends ConceptDraw DIAGRAM software with templates, samples and vector stencils libraries with charts, graphs and plots for drawing the visual dashboards showing data time series.
 Floor Plans
Construction, repair and remodeling of the home, flat, office, or any other building or premise begins with the development of detailed building plan and floor plans. Correct and quick visualization of the building ideas is important for further construction of any building.
 Website Wireframe
The innovative Website Wireframe solution enhances the ConceptDraw DIAGRAM functionality with newest wireframe tools, libraries with variety of predesigned icons, symbols, buttons, graphics, forms, boxes, and many other vector elements, templates and professionally designed samples, which make it the best wireframing software. Website Wireframe solution gives you significant advantages when designing and maintaining websites, creating skeletal and content-free depictions of website structure, making website prototypes and planning the content arrangement before committing to design, also speeds up the processes of sketching, producing and sharing wireframe examples of website style and interface design.
 Frequency Distribution Dashboard
Frequency distribution dashboard solution extends ConceptDraw DIAGRAM software with samples, templates and vector stencils libraries with histograms and area charts for drawing the visual dashboards showing frequency distribution of data.
HelpDesk
How to Use ConceptDraw Sales Dashboard Solution

 Spatial Dashboard
Spatial dashboard solution extends ConceptDraw DIAGRAM software with templates, samples and vector stencils libraries with thematic maps for drawing visual dashboards showing spatial data.
 ConceptDraw Dashboard for Facebook
ConceptDraw Dashboard for Facebook solution extends ConceptDraw DIAGRAM software with a dynamically updated visual dashboard, which shows lifetime total likes, daily friends of fans, and daily page views, information you can receive from Facebook Insights.
 Education Package
Education Package is a comprehensive set of multifarious graphical solutions from ConceptDraw Solution Park, collected together in help to ConceptDraw DIAGRAM users working in a field of science, education and training, which is aimed at improving the quality of education and helping to design with ease variety of interesting and colorful educational materials, diagrams, charts and maps. Use it to present the information and knowledge in an interesting, clear, structured and simple form to achieve a success in education and pedagogy, to maintain the interest of students and pupils throughout the whole learning process, at the lectures, lessons and even during independent work with additional materials, to contribute to better perception of scientific information by listeners during the conferences and reports.
- Sports bar - Floor plan
- Sports bar - Floor plan | Cafe and Restaurant Floor Plans | Sports ...
- Interior Design Office Layout Plan Design Element | Sports bar ...
- Pub Bar Layout Design
- Sports bar - Floor plan | Piping and Instrumentation Diagram ...
- Cafe and Restaurant Floor Plans | Sports bar - Floor plan | How To ...
- Sports bar - Floor plan | Bar Diagrams for Problem Solving. Create ...
- Bar Layout Physical Layout Of Bar
- Sports bar - Floor plan | Cafe and Restaurant Floor Plans | Sports ...
- Bar Counter Layout Drawing
- Cafe And Bar Layout Plan
- Sports bar - Floor plan | How To Create Restaurant Floor Plan in ...
- Bar Plan Layout
- How To Create Restaurant Floor Plan in Minutes | Sports bar - Floor ...
- Sports bar - Floor plan | Cafe and Restaurant Floor Plans | How To ...
- Cafe and Restaurant Floor Plans | Sports bar - Floor plan | How To ...
- How To Create Restaurant Floor Plan in Minutes | Store Layout ...
- Gym and Spa Area Plans | Banquet Hall Plan Software | Sports bar ...
- Gym and Spa Area Plans | Sports bar - Floor plan | Gym Workout ...