The vector stencils library "Circular diagrams" contains 42 templates of circular diagrams: circular arrow diagram, circular motion diagram, arrow ring chart, doughnut chart (donut chart), circle pie chart, diamond pie chart, circle diagram, pie chart, ring chart, loop diagram, block loop diagram, arrow loop circle, crystal diagram, triangular diagram, diamond diagram, pentagon diagram, hexagon diagram, heptagon diagram, cycle diagram (cycle chart), stacked Venn diagram (onion diagram), arrow circle diagram.
Use these shapes to illustrate your marketing and sales documents, presentations, webpages and infographics in the ConceptDraw PRO diagramming and vector drawing software extended with the Target and Circular Diagrams solution from the Marketing area of ConceptDraw Solution Park.
www.conceptdraw.com/ solution-park/ marketing-target-and-circular-diagrams
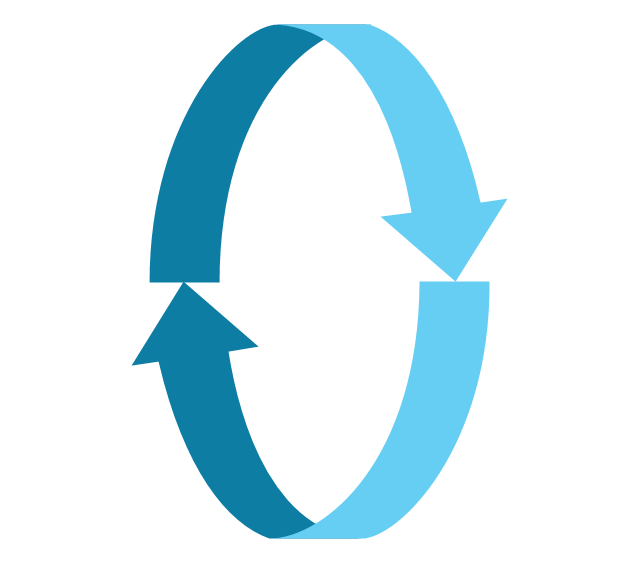
Circular arrow diagram 1
Circular arrow diagram 2
Arrow ring chart
Doughnut chart

Diamond pie chart

Pie chart

Circle diagram

Circle pie chart 2

Circle pie chart 1

Ring chart 1 - 3 elements

Ring chart 1 - 4 elements

Ring chart 1 - 5 elements

Ring chart 1 - 6 elements

Ring chart 1 - 7 elements

Ring chart 2 - 3 elements

Ring chart 2 - 4 elements

Ring chart 2 - 5 elements

Ring chart 2 - 6 elements

Ring chart 2 - 7 elements

Crystal diagram - 3 elements

Crystal diagram - 4 elements

Crystal diagram - 5 elements

Crystal diagram - 6 elements

Crystal diagram - 7 elements

Stacked Venn diagram - 4

Stacked Venn diagram - 5

Stacked Venn diagram - 6

Stacked Venn diagram - 7

Basic loop diagram

Block loop diagram

Arrow loop circle
Arrow loop - 3 circles
Arrow loop - 4 circles
Arrow loop - 5 circles
Arrow loop - 6 circles
Arrow loop - 7 circles
Arrow circle diagram - 3
Arrow circle diagram - 4
Stacked Venn diagram - 3

Arrow circle diagram - 5
Arrow circle diagram - 6
Arrow circle diagram - 7
Basic Flowchart Symbols and Meaning


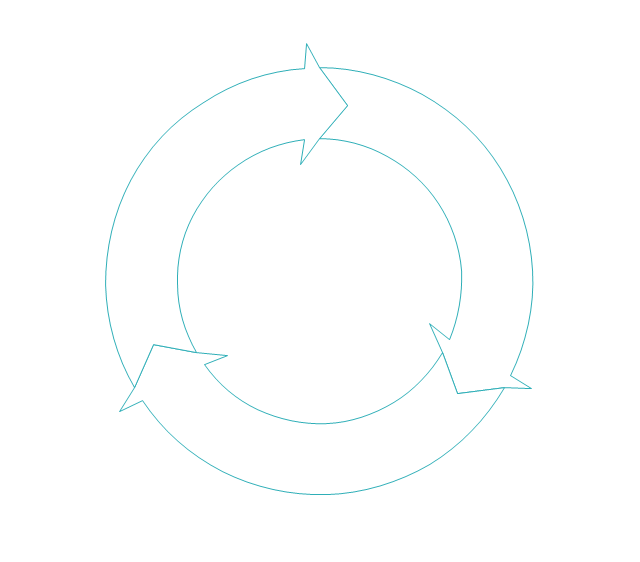
This ring chart sample was redesigned from the Wikipedia file: Virtuous circle in management.svg.
"An example of the use of a virtuous circle in management."
[en.wikipedia.org/ wiki/ File:Virtuous_ circle_ in_ management.svg]
"A virtuous circle and a vicious circle (also referred to as virtuous cycle and vicious cycle) are economic terms. They refer to a complex chain of events that reinforces itself through a feedback loop. A virtuous circle has favorable results, while a vicious circle has detrimental results.
Both circles are complexes of events with no tendency towards equilibrium (at least in the short run). Both systems of events have feedback loops in which each iteration of the cycle reinforces the previous one (positive feedback). These cycles will continue in the direction of their momentum until an external factor intervenes and breaks the cycle. The prefix "hyper-" is sometimes used to describe these cycles if they are extreme. The best-known example of a vicious circle is hyperinflation. ...
Example in management.
Virtuous circle.
An employer's investment in his employees’ ability to provide superior service to customers can be seen as a virtuous circle. Effort spent in selecting and training employees and creating a corporate culture in which they are empowered can lead to increased employee satisfaction and employee competence. This can result in superior service delivery and customer satisfaction. This in turn will create customer loyalty, improved sales levels, and higher profit margins. Some of these profits can be reinvested in employee development, thereby initiating another iteration of a virtuous cycle." [en.wikipedia.org/ wiki/ Virtuous_ circle_ and_ vicious_ circle]
The ring chart example "Virtuous circle (management)" was created using the ConceptDraw PRO diagramming and vector drawing software extended with the Target and Circular Diagrams solution from the Marketing area of ConceptDraw Solution Park.
www.conceptdraw.com/ solution-park/ marketing-target-and-circular-diagrams
Ring chart
---ring-chart.png--diagram-flowchart-example.png)
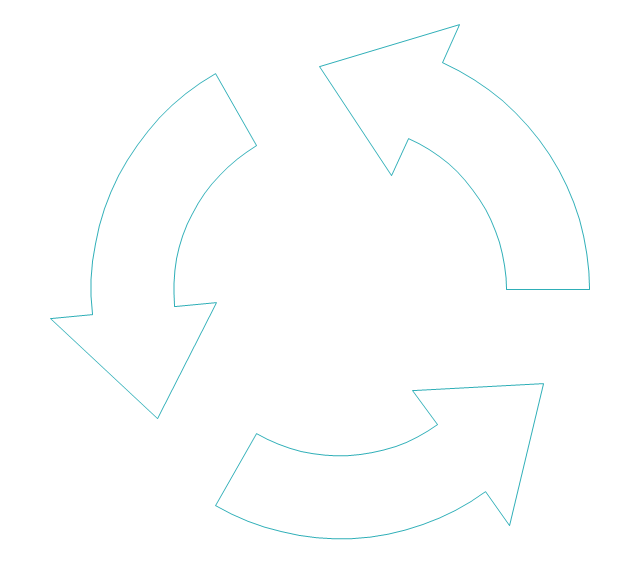
This arrow loop cycle diagram sample was created on the base of the figure illustrating the webpage "Exploratory Advanced Research Program Hand-Off Workshops" from the US Department of Transportation - Federal Highway Administration (FHWA) website. "The FHWA’s research and technology innovation life cycle illustrates that research and technology development are not insular activities, but integrated processes that together constitute a system.
Following general workshop discussion, a number of common issues emerged among the groups. These centered around the research life cycle, communicating the value of exploratory advanced research, and continued project funding. It was felt that there is a general need to better describe the research and deployment cycle specific to highway transportation and possibly to highway research fields, such as materials or system planning. Research life cycle diagrams show a very linear, chronological process but it is not necessarily that way in reality." [fhwa.dot.gov/ advancedresearch/ pubs/ 11034/ ]
The arrow loop diagram example "Innovation life cycle" was created using the ConceptDraw PRO diagramming and vector drawing software extended with the Target and Circular Diagrams solution from the Marketing area of ConceptDraw Solution Park.
www.conceptdraw.com/ solution-park/ marketing-target-and-circular-diagrams
Arrow loop cycle diagram
The vector stencils library "Cross-functional flowcharts" contains 31 flow chart symbols. Use it for drawing cross-functional and deployment flowcharts the ConceptDraw PRO diagramming and vector drawing software extended with the Cross-Functional Flowcharts solution from the Business Processes area of ConceptDraw Solution Park.
Swimlanes Vertical
Swimlanes Horizontal

Terminator

Process

Decision

Yes
No
YES/NO
Data

Manual Operation

Document

Predefined Process

Stored Data

Internal Storage

Sequential Data
Direct Data
Manual Input
Card

Paper Tape
Display
Preparation

Parallel Mode

Loop limit

On-page Reference

Off-Page Reference (Outgoing)
-cross-functional-flowcharts---vector-stencils-library.png--diagram-flowchart-example.png)
Off-Page Reference (Incoming)
-cross-functional-flowcharts---vector-stencils-library.png--diagram-flowchart-example.png)
Off-page Reference (Circle)
-cross-functional-flowcharts---vector-stencils-library.png--diagram-flowchart-example.png)
Off-Page Reference (Arrow)
-cross-functional-flowcharts---vector-stencils-library.png--diagram-flowchart-example.png)
Annotation
Control Transfer
Condition
The vector stencils library "Cross-functional flowcharts" contains 31 flow chart symbols. Use it for drawing cross-functional and deployment flowcharts the ConceptDraw PRO diagramming and vector drawing software extended with the Cross-Functional Flowcharts solution from the Business Processes area of ConceptDraw Solution Park.
Swimlanes Vertical
Swimlanes Horizontal
Terminator
Process
Decision
Yes
No
YES/NO
Data
Manual Operation
Document
Predefined Process
Stored Data
Internal Storage
Sequential Data
Direct Data
Manual Input
Card
Paper Tape
Display
Preparation
Parallel Mode
Loop limit
On-page Reference
Off-Page Reference (Outgoing)
Off-Page Reference (Incoming)
Off-page Reference (Circle)
Off-Page Reference (Arrow)
Annotation
Control Transfer
Condition
The vector stencils library "Flowchart" contains 26 symbols for drawing flowcharts.
Use these shapes to draw your flow charts in the ConceptDraw PRO diagramming and vector drawing software extended with the Flowcharts solution from the area "What is a Diagram" of ConceptDraw Solution Park.
www.conceptdraw.com/ solution-park/ diagram-flowcharts
Use these shapes to draw your flow charts in the ConceptDraw PRO diagramming and vector drawing software extended with the Flowcharts solution from the area "What is a Diagram" of ConceptDraw Solution Park.
www.conceptdraw.com/ solution-park/ diagram-flowcharts
Terminator

Process

Decision

Delay

Subroutine

Data

Document

Multiple documents

Preparation

Display

Manual input

Manual loop

Loop limit

Connector

Off-page connector

Off-page connector

Off-page connector

Off-page connector

Or

Summing junction

Collate

Sort

Merge

Stored data

Database

Internal storage

The vector stencils library "Sales flowchart" contains 62 sales process flow chart symbols.
Use these flow chart icon set to draw your sales flowcharts, workflow diagrams and process charts with the ConceptDraw PRO diagramming and vector drawing software.
The sales process flowchart symbols library "Sales flowchart" is included in the Sales Flowcharts solution from the Marketing area of ConceptDraw Solution Park.
Annotation

Card

Check / audit (diamond)
-sales-flowchart---vector-stencils-library.png--diagram-flowchart-example.png)
Check / audit (square)
-sales-flowchart---vector-stencils-library.png--diagram-flowchart-example.png)
Collate

Comment / note symbol (brace)
-sales-flowchart---vector-stencils-library.png--diagram-flowchart-example.png)
Communication link

Compare (diamond)
-sales-flowchart---vector-stencils-library.png--diagram-flowchart-example.png)
Compare (square)
-sales-flowchart---vector-stencils-library.png--diagram-flowchart-example.png)
Completed form

Concurrency symbol (fork / join)
-sales-flowchart---vector-stencils-library.png--diagram-flowchart-example.png)
Conditional selector

Control transfer

Database

Data input / output

Decision

Decision indicator - No

Decision indicator - Yes

Delay

Direct access storage

Disk storage

Display

Divided process (table view)
-sales-flowchart---vector-stencils-library.png--diagram-flowchart-example.png)
Document

Entity (rounded)
-sales-flowchart---vector-stencils-library.png--diagram-flowchart-example.png)
Event

Extract

Flow line

Internal storage

Junction symbol

Lined document

Lined / shaded process

Loop limit

Manual file

Manual input

Manual operation

Merge

Multi document

Multi process

Off-page reference - arrow
Off-page reference - incoming

Off-page reference - outgoing

On-page reference/ Inspection point

Or

Page

Paper tape

Predefined process

Prepare conditional

Process step

Reference point

Sequential access storage

Sort

Start (circle)
-sales-flowchart---vector-stencils-library.png--diagram-flowchart-example.png)
Start (ellipse)
-sales-flowchart---vector-stencils-library.png--diagram-flowchart-example.png)
Stickman pictogram

Stored data

Summary

Tagged document

Tagged process

Terminal point

Title block

Torso pictogram

The vector stencils library "HR flowchart" contains 62 flowchart symbols.
Use it to draw your HR flowcharts, workflow diagrams and process charts with the ConceptDraw PRO diagramming and vector drawing software.
The flow chart symbols library "HR flowchart" is included in the HR Flowcharts solution from the Management area of ConceptDraw Solution Park.
Use it to draw your HR flowcharts, workflow diagrams and process charts with the ConceptDraw PRO diagramming and vector drawing software.
The flow chart symbols library "HR flowchart" is included in the HR Flowcharts solution from the Management area of ConceptDraw Solution Park.
Annotation

Card

Check / audit (diamond)
-hr-flowchart---vector-stencils-library.png--diagram-flowchart-example.png)
Check / audit (square)
-hr-flowchart---vector-stencils-library.png--diagram-flowchart-example.png)
Collate

Comment / note symbol (brace)
-hr-flowchart---vector-stencils-library.png--diagram-flowchart-example.png)
Communication link

Compare (diamond)
-hr-flowchart---vector-stencils-library.png--diagram-flowchart-example.png)
Compare (square)
-hr-flowchart---vector-stencils-library.png--diagram-flowchart-example.png)
Completed form

Concurrency symbol (fork / join)
-hr-flowchart---vector-stencils-library.png--diagram-flowchart-example.png)
Conditional selector

Control transfer

Data input / output

Database

Decision

Decision indicator - No

Decision indicator - Yes

Delay

Direct access storage

Disk storage

Display

Divided process (table view)
-hr-flowchart---vector-stencils-library.png--diagram-flowchart-example.png)
Document

Entity (rounded)
-hr-flowchart---vector-stencils-library.png--diagram-flowchart-example.png)
Event

Extract

Flow line

Internal storage

Junction symbol

Lined document

Lined / shaded process

Loop limit

Manual file

Manual input

Manual operation

Merge

Multi document

Multi process

Off-page reference - arrow
Off-page reference - incoming

Off-page reference - outgoing

On-page reference/ Inspection point

Or

Page

Paper tape

Predefined process

Prepare conditional

Process step

Reference point

Sequential access storage

Sort

Start (circle)
-hr-flowchart---vector-stencils-library.png--diagram-flowchart-example.png)
Start (ellipse)
-hr-flowchart---vector-stencils-library.png--diagram-flowchart-example.png)
Stickman pictogram

Stored data

Summary

Tagged document

Tagged process

Terminal point

Title block

Torso pictogram

This hexagon diagram sample was redesigned from the Wikipedia file: Virtuous circle in macroeconomics.svg. "An example of the use of a virtuous circle in macroeconomics."
[en.wikipedia.org/ wiki/ File:Virtuous_ circle_ in_ macroeconomics.svg]
"A virtuous circle and a vicious circle (also referred to as virtuous cycle and vicious cycle) are economic terms. They refer to a complex chain of events that reinforces itself through a feedback loop. A virtuous circle has favorable results, while a vicious circle has detrimental results.
Both circles are complexes of events with no tendency towards equilibrium (at least in the short run). Both systems of events have feedback loops in which each iteration of the cycle reinforces the previous one (positive feedback). These cycles will continue in the direction of their momentum until an external factor intervenes and breaks the cycle. The prefix "hyper-" is sometimes used to describe these cycles if they are extreme. The best-known example of a vicious circle is hyperinflation. ...
Example in macroeconomics.
Virtuous circle.
Economic growth can be seen as a virtuous circle. It might start with an exogenous factor such as technological innovation. As people get familiar with the new technology, there could be learning curve effects and economies of scale. This could lead to reduced costs and improved production efficiencies. In a competitive market structure, this will probably result in lower average prices or a decrease in employment as it takes fewer workers to produce the same output. As prices decrease, consumption could increase and aggregate output also. Increased levels of output lead to more learning and scale effects and a new cycle starts."
[en.wikipedia.org/ wiki/ Virtuous_ circle_ and_ vicious_ circle]
The crystal diagram example "Virtuous circle (macroeconomics)" was created using the ConceptDraw PRO diagramming and vector drawing software extended with the Target and Circular Diagrams solution from the Marketing area of ConceptDraw Solution Park.
www.conceptdraw.com/ solution-park/ marketing-target-and-circular-diagrams
Hexagon diagram
---crystal-diagram.png--diagram-flowchart-example.png)
This arrow circle diagram sample was redesigned from the Wikimedia Commons file: Loyalitätskreislauf-klein.jpg. [commons.wikimedia.org/ wiki/ File:Loyalit%C3%A4tskreislauf-klein.jpg]
This file is licensed under the Creative Commons Attribution-Share Alike 3.0 Unported license. [creativecommons.org/ licenses/ by-sa/ 3.0/ deed.en]
"Loyalty marketing is an approach to marketing, based on strategic management, in which a company focuses on growing and retaining existing customers through incentives. Branding, product marketing and loyalty marketing all form part of the customer proposition - the subjective assessment by the customer of whether to purchase a brand or not based on the integrated combination of the value they receive from each of these marketing disciplines.
The discipline of customer loyalty marketing has been around for many years...
In recent years, a new marketing discipline called "customer advocacy marketing" has been combined with or replaced "customer loyalty marketing." " [Loyalty marketing. Wikipedia]
The arrow circle diagram example "Loyalty" was created using the ConceptDraw PRO diagramming and vector drawing software extended with the Target and Circular Diagrams solution from the Marketing area of ConceptDraw Solution Park.
www.conceptdraw.com/ solution-park/ marketing-target-and-circular-diagrams
Arrow circle diagram
This hexagon diagram sample was redesigned from the Wikipedia file: Vicious circle in macroeconomics.svg. "An example of the use of a vicious circle in macroeconomics." [en.wikipedia.org/ wiki/ File:Vicious_ circle_ in_ macroeconomics.svg]
"A virtuous circle and a vicious circle (also referred to as virtuous cycle and vicious cycle) are economic terms. They refer to a complex chain of events that reinforces itself through a feedback loop. A virtuous circle has favorable results, while a vicious circle has detrimental results.
Both circles are complexes of events with no tendency towards equilibrium (at least in the short run). Both systems of events have feedback loops in which each iteration of the cycle reinforces the previous one (positive feedback). These cycles will continue in the direction of their momentum until an external factor intervenes and breaks the cycle. The prefix "hyper-" is sometimes used to describe these cycles if they are extreme. The best-known example of a vicious circle is hyperinflation. ...
Example in macroeconomics.
Vicious circle.
Hyperinflation is a spiral of inflation which causes even higher inflation. The initial exogenous event might be a sudden large increase in international interest rates or a massive increase in government debt due to excessive spendings. Whatever the cause, the government could pay down some of its debt by printing more money (called monetizing the debt). This increase in the money supply could increase the level of inflation. In an inflationary environment, people tend to spend their money quickly because they expect its value to decrease further in the future. They convert their financial assets into physical assets while their money still has some purchasing power. Often they will purchase on credit. Eventually, the currency loses all of its value. Because of this, the level of savings in the country is very low and the government could have problems refinancing its debt. Its solution could be to print still more money starting another iteration of the vicious cycle." [Virtuous circle and vicious circle. Wikipedia]
The crystal diagram example "Vicious circle" was created using the ConceptDraw PRO diagramming and vector drawing software extended with the Target and Circular Diagrams solution from the Marketing area of ConceptDraw Solution Park.
www.conceptdraw.com/ solution-park/ marketing-target-and-circular-diagrams
Hexagon diagram

The vector stencils library "Sales arrows" contains 57 arrow symbols.
Use these arrow icon set to draw your sales flowcharts, workflow diagrams and process charts with the ConceptDraw PRO diagramming and vector drawing software.
The arrow pictograms library "Sales arrows" is included in the Sales Flowcharts solution from the Marketing area of ConceptDraw Solution Park.
Angle arrow
Arc arrow
Arki arrow
Arrow fork
Arrow loop
Bent arrow
Chevron arrow
Circular arrow
Circular motion arrows
Clockwise arrow
Corner arrow
Counterclockwise arrow
Crossed arrows
Curved left arrow
Curved right arrow
Curving directional arrow
Cycle arrow
Diagonal arrow
Double arc arrow
Double headed arrow
Double headed semicircle arrow
Down arrow
Dual short arc arrow
Elbow arrow
Fat arrow
Go back arrow
Interaction arrows

L-shaped arrow
Left arrow
Lightning arrow
Long arc arrow
Looping arrows
Merging arrows

Moving down arrow
Moving up arrow
Recycling arrows

Refresh arrows
Ribbon arrow
Right arrow
Rotating arrows
S-shaped arrow
Sector arrow
Semicircle arrow
Short arc arrow
Single headed arrow
Small arrow
Split arrow
Straight arrow
Triangle arrow
Turn left arrow
Turn right arrow
Turn round arrow
Turned arrow
Up arrow
U-shaped arrow
Vertical moving arrow
Wavy arrow
Flow Chart Symbols

Process Flow Chart

ConceptDraw PRO diagramming and vector drawing software extended with Flowcharts Solution from the "Diagrams" Area of ConceptDraw Solution Park is the best way to create Process Flow Chart and other types of flowcharts.
- Circular diagrams - Vector stencils library | Circular Arrows | Basic ...
- Circular diagrams - Vector stencils library | Business feedback loop ...
- Circular diagrams - Vector stencils library
- Circular diagrams - Vector stencils library | Circular arrows diagrams ...
- 3 Circle Venn Diagram. Venn Diagram Example | Venn Diagrams ...
- Circular diagrams - Vector stencils library | Circular diagrams ...
- 3 Circle Venn Diagram Vector
- Circle Spoke Diagram Template | Circular diagrams - Vector stencils ...
- Arrow circle chart - Template | DFD Library - Design elements ...
- Circular diagrams - Vector stencils library | Circle -spoke diagram ...
- Circle -spoke diagram - Target market | Target Diagram | Circular ...
- Circle Spoke Diagram Template | Pie Chart Examples and ...
- Innovation life cycle - Arrow loop diagram | Target and Circular ...
- 3 Circle Venn Diagram. Venn Diagram Example | Circular diagrams ...
- Circles Venn Diagram | Circle -Spoke Diagrams | Circular diagrams ...
- 3 Circle Venn. Venn Diagram Example | What Is a Circle Spoke ...
- Circle -spoke diagram - Vector stencils library | 2 Circle Venn ...
- Circular Flow Diagram Template | Circular diagrams - Vector stencils ...
- Circular diagrams - Vector stencils library | Export from ...
- Circular diagrams - Vector stencils library | Circles Venn Diagram ...
- ERD | Entity Relationship Diagrams, ERD Software for Mac and Win
- Flowchart | Basic Flowchart Symbols and Meaning
- Flowchart | Flowchart Design - Symbols, Shapes, Stencils and Icons
- Flowchart | Flow Chart Symbols
- Electrical | Electrical Drawing - Wiring and Circuits Schematics
- Flowchart | Common Flowchart Symbols
- Flowchart | Common Flowchart Symbols