Basic Flowchart Symbols and Meaning
Flowcharts are the best for visually representation the business processes and the flow of a custom-order process through various departments within an organization. ConceptDraw PRO diagramming and vector drawing software extended with Flowcharts solution offers the full set of predesigned basic flowchart symbols which are gathered at two libraries: Flowchart and Flowcharts Rapid Draw. Among them are: process, terminator, decision, data, document, display, manual loop, and many other specific symbols. The meaning for each symbol offered by ConceptDraw gives the presentation about their proposed use in professional Flowcharts for business and technical processes, software algorithms, well-developed structures of web sites, Workflow diagrams, Process flow diagram and correlation in developing on-line instructional projects or business process system. Use of ready flow chart symbols in diagrams is incredibly useful - you need simply drag desired from the libraries to your document and arrange them in required order. There are a few serious alternatives to Visio for Mac, one of them is ConceptDraw PRO. It is one of the main contender with the most similar features and capabilities.
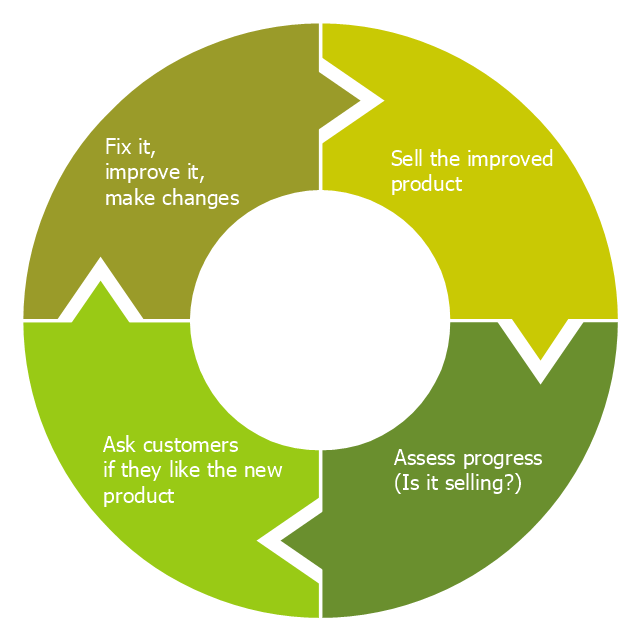
This cycle process chart was redesigned from the Wikimedia Commons file: Business Feedback Loop PNG version.png.
"A business ideally is continually seeking feedback from customers: are the products helpful? are their needs being met? Constructive criticism helps marketers adjust offerings to meet customer needs."
[commons.wikimedia.org/ wiki/ File:Business_ Feedback_ Loop_ PNG_ version.png]
The cycle process diagram example "Business feedback loop" was created using the ConceptDraw PRO diagramming and vector drawing software extended with the Sales Flowcharts solution from the Marketing area of ConceptDraw Solution Park.
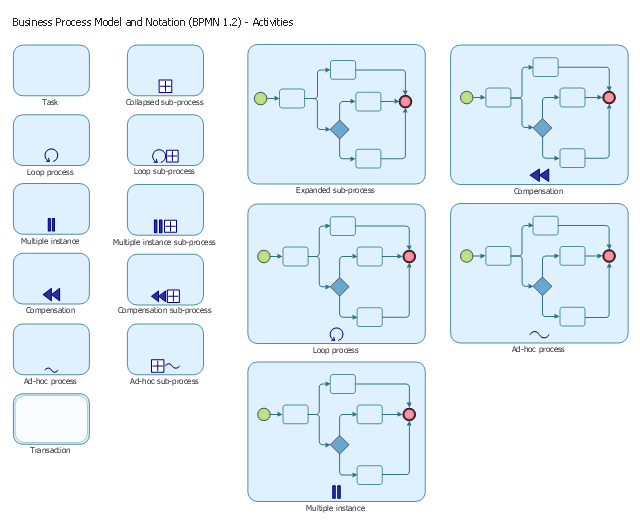
The vector stencils library "Activities BPMN 1.2" contains 16 activity shapes.
Use it for drawing business process diagram (BPMN 1.2) in the ConceptDraw PRO diagramming and vector drawing software extended with the Business Process Diagram solution from the Business Processes area of ConceptDraw Solution Park.
www.conceptdraw.com/ solution-park/ business-process-diagram
Use it for drawing business process diagram (BPMN 1.2) in the ConceptDraw PRO diagramming and vector drawing software extended with the Business Process Diagram solution from the Business Processes area of ConceptDraw Solution Park.
www.conceptdraw.com/ solution-park/ business-process-diagram
Process Flow Diagram
A Process Flow Diagram (PFD) is a diagram which shows the relationships between the main components in a system. Process Flow Diagrams are widely used by engineers in chemical and process engineering, they allows to indicate the general flow of plant process streams and equipment, helps to design the petroleum refineries, petrochemical and chemical plants, natural gas processing plants, and many other industrial facilities. ConceptDraw PRO diagramming and vector drawing software extended with powerful tools of Flowcharts Solution from the "Diagrams" Area of ConceptDraw Solution Park is effective for drawing: Process Flow Diagram, Flow Process Diagram, Business Process Flow Diagrams.Process Flow Chart
A Process Flow Chart is a type of flowchart which is mostly used in industrial, chemical and process engineering for illustrating high-level processes, major plant processes and not shows minor details. ConceptDraw PRO diagramming and vector drawing software extended with Flowcharts Solution from the "Diagrams" Area of ConceptDraw Solution Park is the best way to create Process Flow Chart and other types of flowcharts.The vector stencils library "Sales flowchart" contains 62 sales process flow chart symbols.
Use these flow chart icon set to draw your sales flowcharts, workflow diagrams and process charts with the ConceptDraw PRO diagramming and vector drawing software.
The sales process flowchart symbols library "Sales flowchart" is included in the Sales Flowcharts solution from the Marketing area of ConceptDraw Solution Park.
The vector stencils library "Activities BPMN 1.2" contains 16 activity symbols for drawing business process diagrams (Business Process Model and Notation) using the ConceptDraw PRO diagramming and vector drawing software.
"An activity is represented with a rounded-corner rectangle and describes the kind of work which must be done.
Task.
A task represents a single unit of work that is not or cannot be broken down to a further level of business process detail without diagramming the steps in a procedure (which is not the purpose of BPMN).
Sub-process.
Used to hide or reveal additional levels of business process detail. When collapsed, a sub-process is indicated by a plus sign against the bottom line of the rectangle; when expanded, the rounded rectangle expands to show all flow objects, connecting objects, and artifacts.
Has its own self-contained start and end events; sequence flows from the parent process must not cross the boundary.
Transaction.
A form of sub-process in which all contained activities must be treated as a whole; i.e., they must all be completed to meet an objective, and if any one of them fails, they must all be compensated (undone). Transactions are differentiated from expanded sub-processes by being surrounded by a double border.
Call Activity.
A point in the process where a global process or a global Task is reused. A call activity is differentiated from other activity types by a bolded border around the activity area." [Business Process Model and Notation. Wikipedia]
The shapes example "Design elements - Activities BPMN 1.2" is included in the Business Process Diagram solution from the Business Processes area of ConceptDraw Solution Park.
The vector stencils library "HR flowchart" contains 62 flowchart symbols.
Use it to draw your HR flowcharts, workflow diagrams and process charts with the ConceptDraw PRO diagramming and vector drawing software.
The flow chart symbols library "HR flowchart" is included in the HR Flowcharts solution from the Management area of ConceptDraw Solution Park.
Use it to draw your HR flowcharts, workflow diagrams and process charts with the ConceptDraw PRO diagramming and vector drawing software.
The flow chart symbols library "HR flowchart" is included in the HR Flowcharts solution from the Management area of ConceptDraw Solution Park.
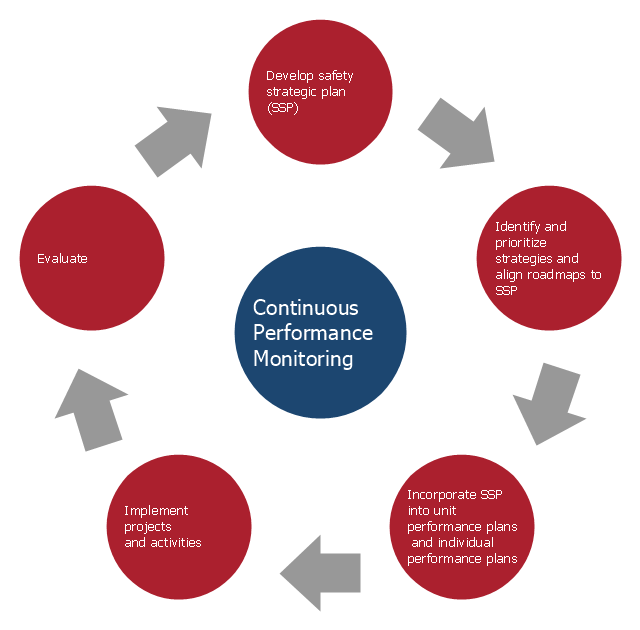
This arrow loop diagram sample was created on the base of the figure illustrating the webpage "Safe Roads for a Safer Future A Joint Safety Strategic Plan" from the website of US Department of Transportation - Federal Highway Administration (FHWA) Office of Safety.
"STRATEGIC PLANNING CYCLE.
After the safety units issue the SSP, they will identify and prioritize strategies to support the established goals. Many strategies will originate in existing roadmaps or in other program planning activities. The safety units will also use this information when developing their Unit Performance Plans and individual performance plans. Teams within each safety unit will carry out projects and activities to support identified strategies and achieve the SSP goals.
The SSP process also includes continuous performance monitoring and evaluation through which the safety units will review past accomplishments against the established goals, consider how well strategies are implemented, assess progress toward goals, identify risks, consider changes in the environment, and discuss future strategic direction. As a part of the evaluation process, the three safety units will recognize achievements and discuss the need for adjustments. Figure ... shows the strategic planning cycle.
The safety units will update the SSP every 3 to 5 years using input from a variety of sources, including evaluations, safety trends, and legislative changes." [safety.fhwa.dot.gov/ ssp/ ]
The arrow loop diagram example "Strategic planning cycle" was created using the ConceptDraw PRO diagramming and vector drawing software extended with the Target and Circular Diagrams solution from the Marketing area of ConceptDraw Solution Park.
www.conceptdraw.com/ solution-park/ marketing-target-and-circular-diagrams
Flowchart
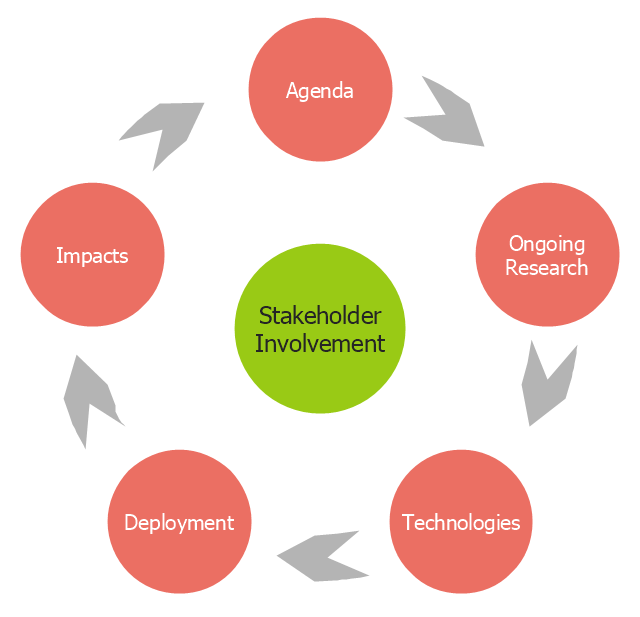
The Flowcharts are widespread in various fields and include the multitude of types. They are dedicated to representation the algorithms, processes, workflows of any complexity in a clear and intuitive format. The Flowcharts are commonly used in software development as a visual tool for illustration algorithms and logic of computer programs, in business for illustration business scenarios, in education, and so on. For drawing the Flowchart are used the special object blocks, among them rectangle or box used to represent an activity or step, rounded box or oval to depict Start / End, diamond to represent the decision point (involves the branching yes/no), circle used to represent the point of connection, parallelogram to represent the Input / Output, and some others. With ConceptDraw PRO including Flowcharts solution it is easy to create professional-looking Flowchart diagrams of any complexity and any degree of detailing. Succeed in drawing the Flowcharts using quick-start templates, predesigned samples and extensive libraries of ready-made flowchart symbols, blocks and icons.This arrow loop cycle diagram sample was created on the base of the figure illustrating the webpage "Exploratory Advanced Research Program Hand-Off Workshops" from the US Department of Transportation - Federal Highway Administration (FHWA) website. "The FHWA’s research and technology innovation life cycle illustrates that research and technology development are not insular activities, but integrated processes that together constitute a system.
Following general workshop discussion, a number of common issues emerged among the groups. These centered around the research life cycle, communicating the value of exploratory advanced research, and continued project funding. It was felt that there is a general need to better describe the research and deployment cycle specific to highway transportation and possibly to highway research fields, such as materials or system planning. Research life cycle diagrams show a very linear, chronological process but it is not necessarily that way in reality." [fhwa.dot.gov/ advancedresearch/ pubs/ 11034/ ]
The arrow loop diagram example "Innovation life cycle" was created using the ConceptDraw PRO diagramming and vector drawing software extended with the Target and Circular Diagrams solution from the Marketing area of ConceptDraw Solution Park.
www.conceptdraw.com/ solution-park/ marketing-target-and-circular-diagrams
Flow Chart Symbols
ConceptDraw PRO software extended with Flowcharts Solution from the "Diagrams" Area is a powerful software that will help you design the flowcharts for any business and technical processes, and software algorithms thanks to the predesigned flow chart symbols. Flowcharts solution offers 2 libraries with large collection of vector flow chart symbols: Flowchart Library, Flowcharts Rapid Draw Library that you can use to create your flowcharts quick and easy. Flowchart Solution is number of diagraming stencils including special set of flow chart symbols such as: terminator, process, decision which indicates a decision points between two or more paths in a flowchart, symbol of delay. Major symbols includes symbol of data, document or multiple documents, subroutine, preparation for processing of documents. Also includes symbols: display, manual input, manual loop, loop limit, stored data,connectors and suming junctions, sort and merge operations, symbols of database and internal storDesign Data Flow. DFD Library
Data flow diagram or DFD is a type of diagrams used for graphical representation the "flow" of data through an information system, for effective modeling its process aspects and for visualization the data processing. They are one of the best tools for clearly making an overview of the system that will be developed, for depiction in details what kinds of information will be inputted to the system and outputted from it, where they will be stored, and other details. ConceptDraw PRO software with Data Flow Diagrams solution from Software Development area of ConceptDraw Solution Park is powerful in a field of designing the DFDs. Three libraries containing 49 vector DFD shapes and symbols are offered by Data Flow Diagrams (DFD) solution. Use them to design data flow diagrams, information flow diagrams, data flowcharts, data process diagrams, structured analysis diagrams, to create the data-oriented models or process-oriented models, and so on. Pay also attention for the included collection of DFD samples, examples and built-in templates at ConceptDraw STORE."Feedback is a process in which information about the past or the present influences the same phenomenon in the present or future. As part of a chain of cause-and-effect that forms a circuit or loop, the event is said to "feed back" into itself. ...
Feedback loop - the complete causal path that leads from the initial detection of the gap to the subsequent modification of the gap. ...
Feedback is commonly divided into two types - usually termed positive and negative. The terms can be applied in two contexts:
(1) the altering of the gap between reference and actual values of a parameter, based on whether the gap is widening (positive) or narrowing (negative),
(2) the valence of the action or effect that alters the gap, based on whether it has a happy (positive) or unhappy (negative) emotional connotation to the recipient or observer." [Feedback. Wikipedia]
This cycle diagram example was redesigned from the Wikimedia Commons file: Business Feedback Loop.jpg. [commons.wikimedia.org/ wiki/ File:Business_ Feedback_ Loop.jpg]
This file is made available under the Creative Commons CC0 1.0 Universal Public Domain Dedication. [creativecommons.org/ publicdomain/ zero/ 1.0/ deed.en]
The ring chart example "Business feedback loop" was created using the ConceptDraw PRO diagramming and vector drawing software extended with the Target and Circular Diagrams solution from the Marketing area of ConceptDraw Solution Park.
www.conceptdraw.com/ solution-park/ marketing-target-and-circular-diagrams
Yourdon and Coad Diagram
The vector stencils library Yourdon and Coad Notation from the solution OOAD contains specific symbols of the Yourdon and Coad notation such as data store symbol, data process symbol, loop symbol for ConceptDraw PRO diagramming and vector drawing software. The OOAD solution is contained in the Software Development area of ConceptDraw Solution Park.- Basic Flowchart Symbols and Meaning | Process Flow Chart ...
- Basic Flowchart Symbols and Meaning | Process Flow Chart | In ...
- Loop Shape Flowchart
- Basic Flowchart Symbols and Meaning | Flowchart | Process Flow ...
- Innovation life cycle - Arrow loop diagram | Process Flowchart ...
- Business feedback loop | Process Flowchart | Flowchart design ...
- Process Flowchart | Innovation life cycle - Arrow loop diagram ...
- Basic Flowchart Symbols and Meaning | Process Flow Diagram ...
- Research cycle - Circle diagram | Innovation life cycle - Arrow loop ...
- Research cycle - Circle diagram | Innovation life cycle - Arrow loop ...
- Strategic planning cycle - Arrow loop diagram | Process Flow Maps ...
- Intelligence analyst cycle - Arrow loop diagram | Target and Circular ...
- Business feedback loop | Process Flowchart | Competitor Analysis ...
- BPR Diagram. Business Process Reengineering Example ...
- Loop Drawing Symbols
- Product life cycle process - Flowchart | Intelligence analyst cycle ...
- Business feedback loop | Basic Flowchart Symbols and Meaning ...
- Strategic planning cycle - Arrow loop diagram | Basic Flowchart ...
- Illustrate The Intelligence Process By Using A Diagram






-sales-flowchart---vector-stencils-library.png--diagram-flowchart-example.png)
-sales-flowchart---vector-stencils-library.png--diagram-flowchart-example.png)

-sales-flowchart---vector-stencils-library.png--diagram-flowchart-example.png)

-sales-flowchart---vector-stencils-library.png--diagram-flowchart-example.png)
-sales-flowchart---vector-stencils-library.png--diagram-flowchart-example.png)

-sales-flowchart---vector-stencils-library.png--diagram-flowchart-example.png)






-sales-flowchart---vector-stencils-library.png--diagram-flowchart-example.png)

-sales-flowchart---vector-stencils-library.png--diagram-flowchart-example.png)






















-sales-flowchart---vector-stencils-library.png--diagram-flowchart-example.png)
-sales-flowchart---vector-stencils-library.png--diagram-flowchart-example.png)







-hr-flowchart---vector-stencils-library.png--diagram-flowchart-example.png)
-hr-flowchart---vector-stencils-library.png--diagram-flowchart-example.png)

-hr-flowchart---vector-stencils-library.png--diagram-flowchart-example.png)

-hr-flowchart---vector-stencils-library.png--diagram-flowchart-example.png)
-hr-flowchart---vector-stencils-library.png--diagram-flowchart-example.png)

-hr-flowchart---vector-stencils-library.png--diagram-flowchart-example.png)






-hr-flowchart---vector-stencils-library.png--diagram-flowchart-example.png)

-hr-flowchart---vector-stencils-library.png--diagram-flowchart-example.png)



















-hr-flowchart---vector-stencils-library.png--diagram-flowchart-example.png)
-hr-flowchart---vector-stencils-library.png--diagram-flowchart-example.png)


