Make an Infographic
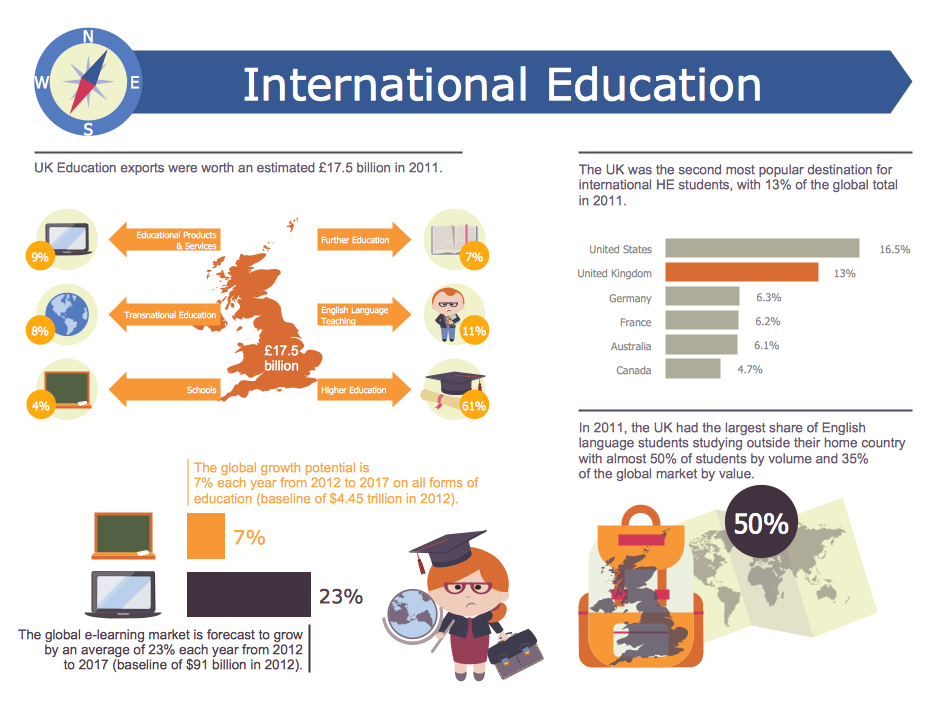
You want to make an infographic and need the useful and convenient drawing tools for this? In this case the ConceptDraw PRO software extended with Education Infographics Solution is a real godsend for you.HelpDesk
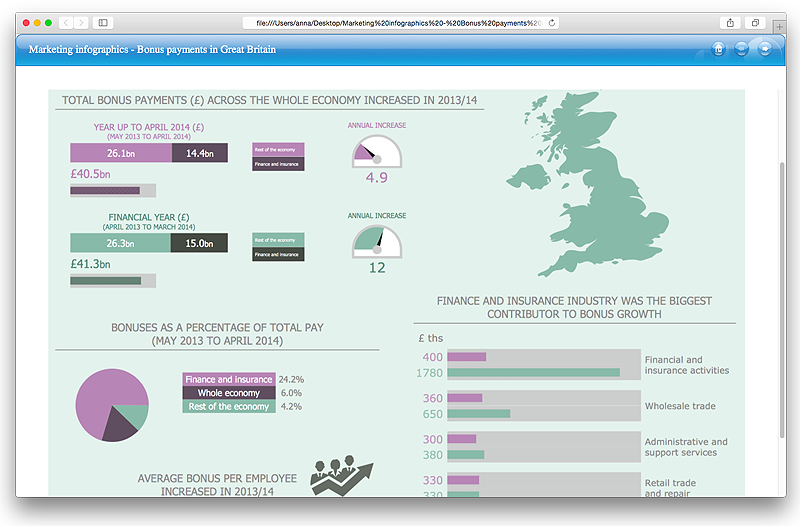
How to Make a Web Page from Infographics in ConceptDraw PRO
Create your own original marketing illustrations and infographics, presentation slides, website, and blog pages using ConceptDraw PRO.HelpDesk
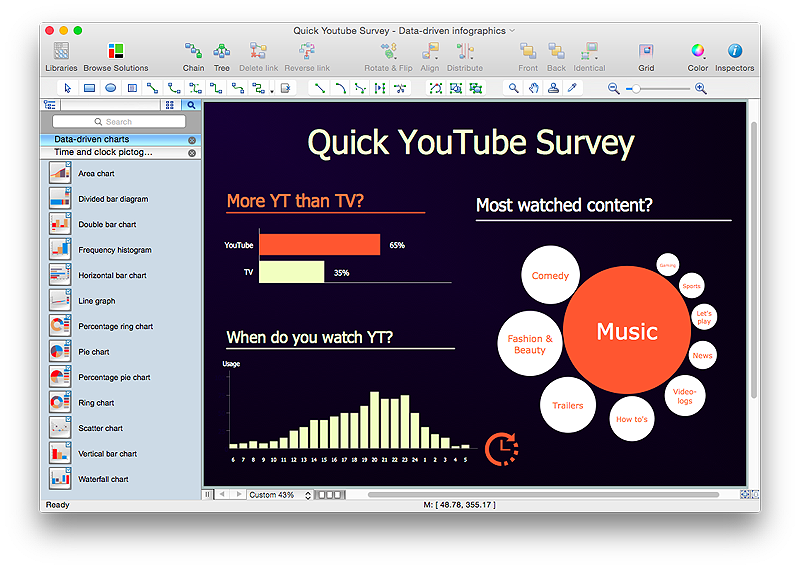
How to Create Data-driven Infographics
Data-driven infographics are used in wildly disparate areas of business and commerce. To make effective Data-driven infographics, it's useful to have a wide variety of graphical elements — icons, clipart, stencils, charts and graphs — to illustrate your diagram. ConceptDraw Data-driven Infographics solution provides all the tools you need to present data as described by this article — as well as the charts mentioned previously, you can find histograms, divided bar charts, ring charts, line graphs and area charts — meaning you can find the perfect medium for displaying a certain type of data. It allows you to draw data driven infographics quickly and easily using the special templates and vector stencils libraries.It can be used to quickly communicate a message, to simplify the presentation of large amounts of data, to see data patterns and relationships, and to monitor changes in variables over time.HelpDesk
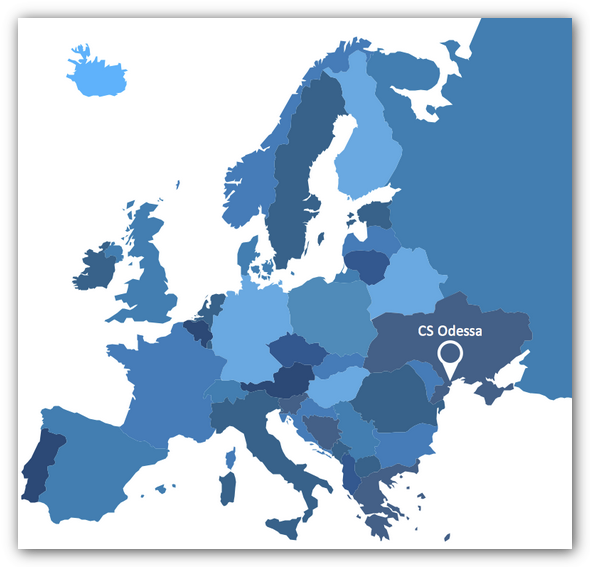
How to Create Infographics Using the Spatial Infographics Solution
Tips on how to use ConceptDraw Spatial Infographics Solution. Now you got the tool for quick and easy drawing and presenting of your own simple Spatial Infographics documents.
 What are Infographic Area
Solutions of the area What is Infographics from ConceptDraw Solution Park collect templates, samples and vector stencils libraries with design elements for the drawing information graphics.
How to Create a Powerful Infographic When You do not Have a Designer
Create a powerful infographic, become inspired by the people with ConceptDraw.Transportation Infographics
ConceptDraw is a visualization Software for making transportation infographics. Infographics design vector elements and vector graphics which will surely help you in your design process.Tools to Create Your Own Infographics
Over the past few centuries, data visualization has evolved so much that we use it every day in all areas of our lives. Many believe that infographic is an effective tool of storytelling, as well as analytics, and that it is able to overcome most of the language and educational barriers. Understanding the mechanisms of human perception will help you to understand how abstract forms and colors used in data visualization can transmit information more efficient than long paragraphs of text.Travel Infographics
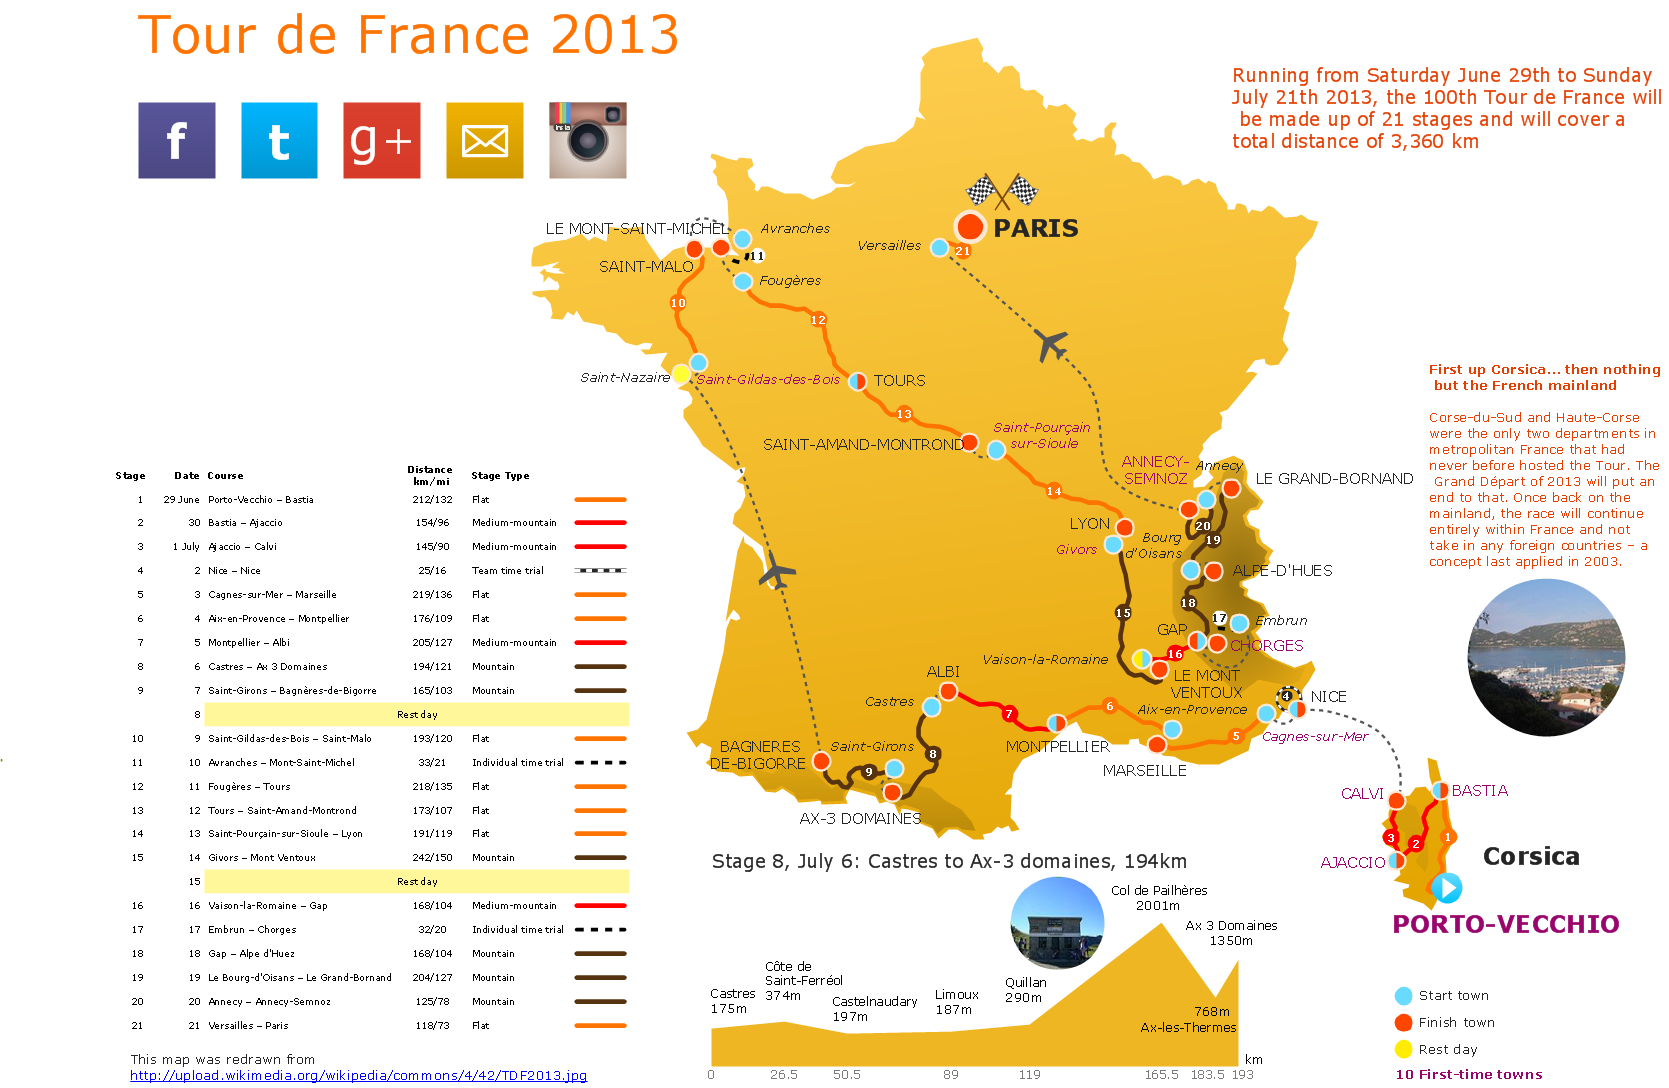
Creating Travel infographics is super-easy with ConceptDraw.How to Make an Infographic
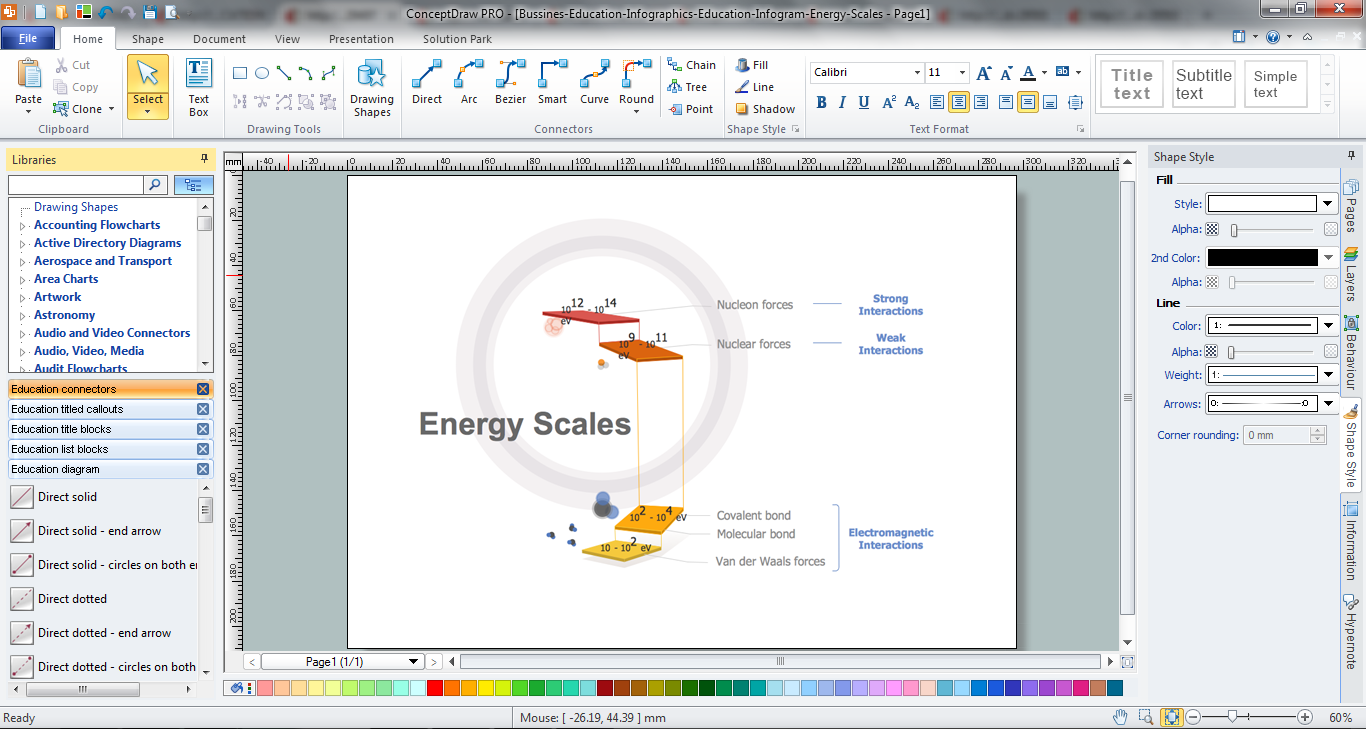
How to Make an Infographic quick and easy? The perfect way is to use the ConceptDraw PRO diagramming and vector drawing software extended with Education Infographics Solution from the Business Infographics Area.Winter Sports. Olympic Games Infographics. Medal Table
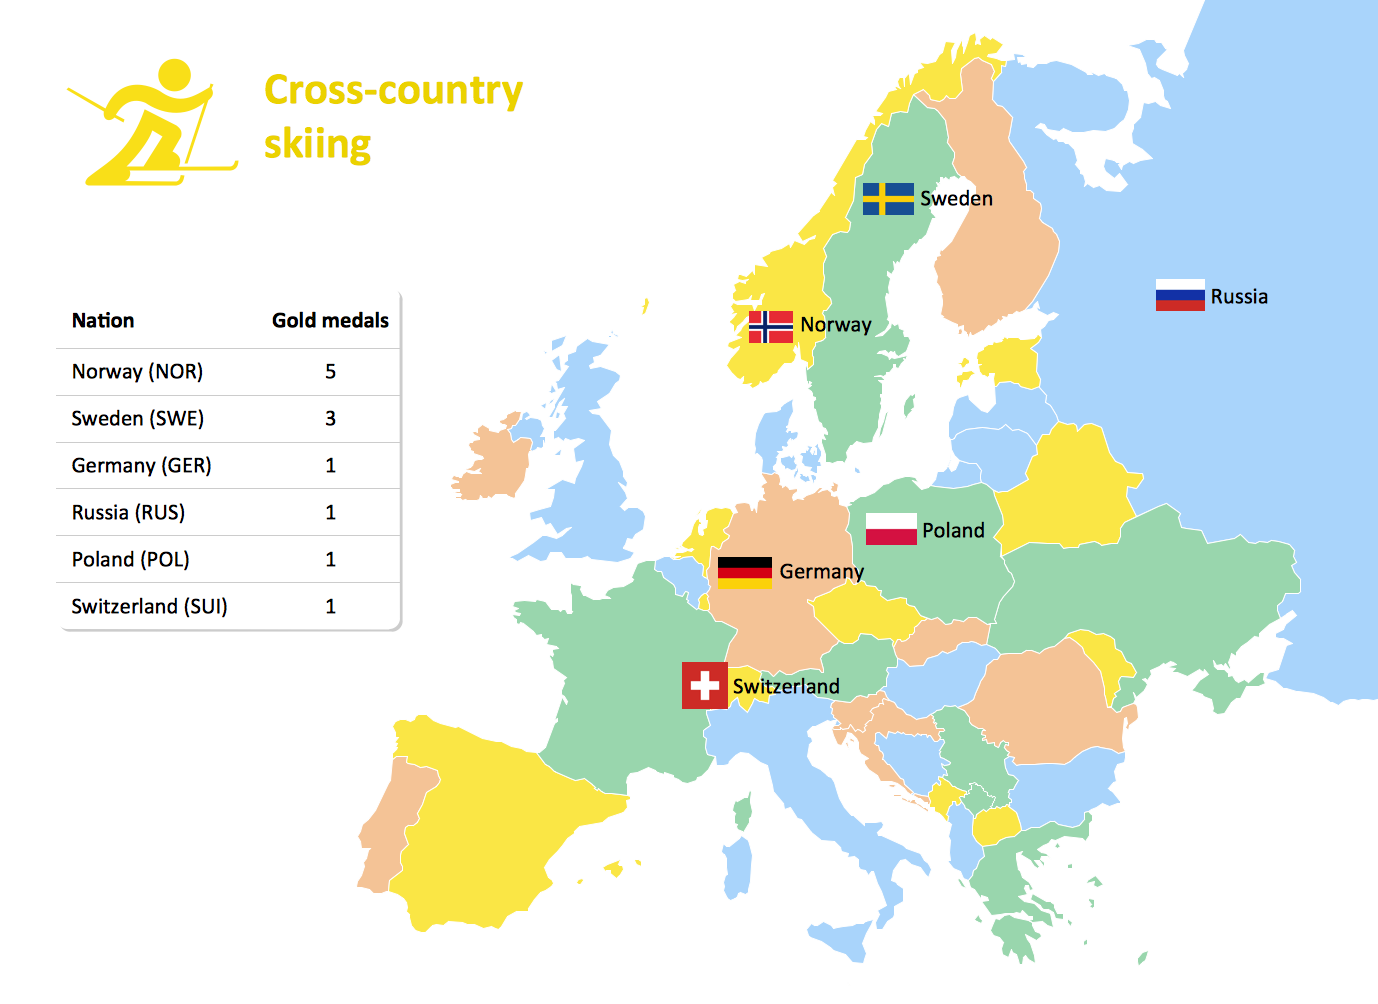
Visualizing data in infographics format is a modern way to represent any statistics related to global sporting events, such as Winter Olympic Games. ConceptDraw PRO software extended with the Winter Sports solution delivers a rich set of samples and templates helps you produce all kind of sporting information, such as tournament schedule or medal table.Map Infographic Design
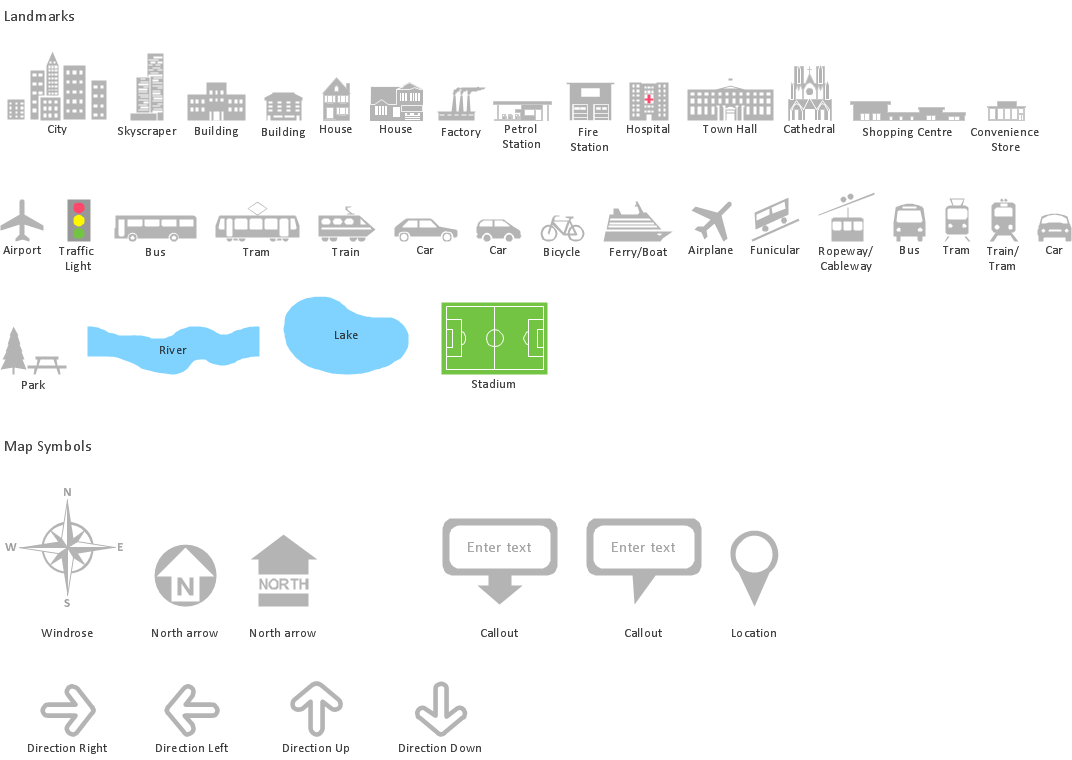
ConceptDraw collection of vector elements for infographics design.Sample Pictorial Chart. Sample Infographics
Sample Pictorial Chart - Pictorial Infographics solution provides easy-to-use design infographics drawing tools, large collection of different sample infographics and infograms, sample pictorial chart and templates to be filled in, and 10 libraries with great quantity of predesigned vector pictograms.Use Pictorial Infographics solution to draw your own design pictorial infographics documents quick and easy.
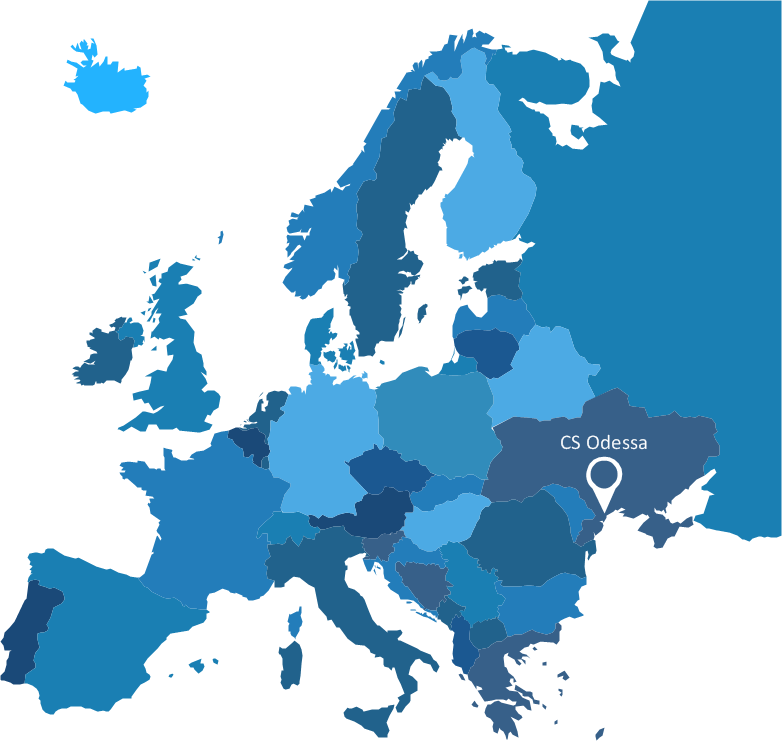
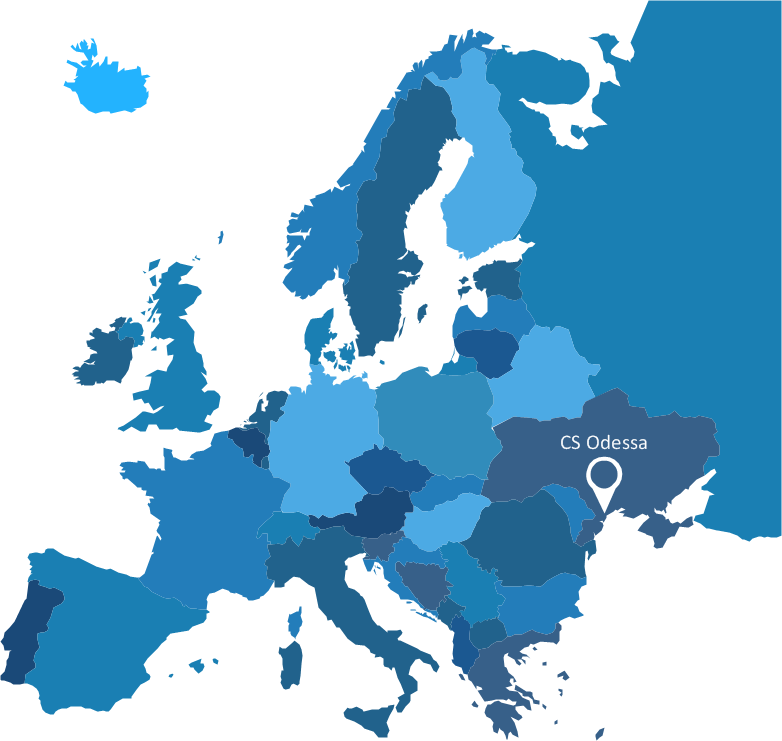
Spatial infographics Design Elements: Continental Map
ConceptDraw PRO is a software for making infographics illustrations. You can work with various components to build really impressive and easy-to-understand infographics design.Spatial infographics Design Elements: Transport Map
Do you like infographics and data visualization? Creating infographics is super-easy with ConceptDraw.Best Tool for Infographic Construction
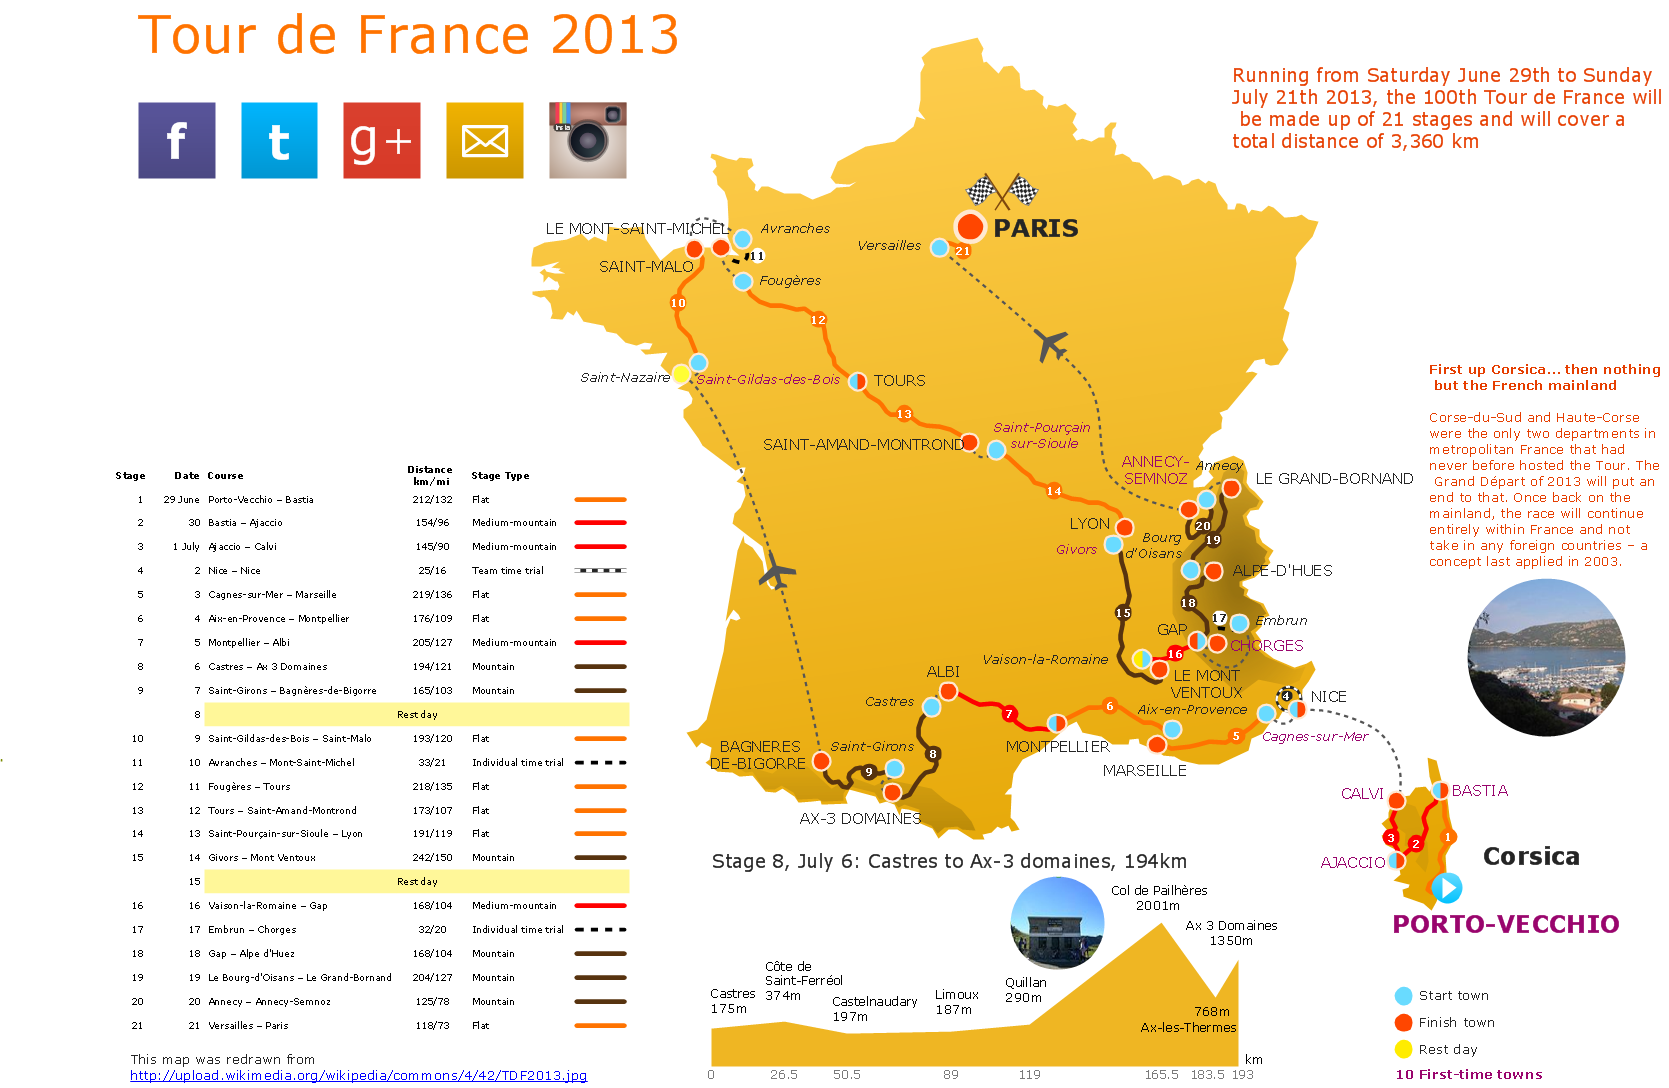
ConceptDraw is a best data visualization tool that will allow everyone to create rich infographics and visualizations quickly and easily.Map Infographic Creator
Follow samples and map templates to create nfographic maps. It's super-easy!- How to Make a Web Page from Infographics | Visio Exchange ...
- Metro Map | How to draw Metro Map style infographics ? (New York ...
- Maps | Brilliant Examples of Infographics Map, Transport, Road ...
- How to draw Metro Map style infographics ? Moscow, New York, Los ...
- Map Infographic Creator | How to draw Metro Map style infographics ...
- Spatial Infographics | Transportation Infographics | Visualization ...
- Map Infographic Design | Spatial Infographics | Map Infographic Tool ...
- Spatial Infographics | Map Infographic Maker | Spatial Infographics ...
- Spatial Infographics | What is Infographics Area | Visualization ...
- Brilliant Examples of Infographics Map, Transport, Road | Maps ...
- Map Infographic Maker | What is Infographics Area | Map Infographic ...
- Spatial infographics Design Elements: Continental Map | Spatial ...
- Excellent Examples of Infographic Maps | Spatial Infographics | PM ...
- Spatial infographics Design Elements: Transport Map
- Spatial infographics Design Elements: Continental Map | Spatial ...
- Maps | Map Infographic Creator | Brilliant Examples of Infographics ...
- How To Draw Building Plans | How to draw Metro Map style ...
- Map Infographic Design | Spatial infographics Design Elements ...
- Map Infographic Creator | Spatial infographics Design Elements ...
- Tools to Create Your Own Infographics | Spatial infographics Design ...
